


Crypto Today: Bitcoin, Ethereum, XRP hover near key support as investors assess geopolitical risks
- Bitcoin remains supported around $76,000, weighed down by a fragile US-Iran ceasefire and persistent ETF outflows.
- Ethereum hovers near the $2,100 support-turned-resistance level as declining institutional interest limits its recovery potential.
- XRP trades significantly below key moving averages as steady, mild inflows into ETFs struggle to lift the outlook.
Cryptocurrency prices are broadly consolidating near key short-term support levels, with Bitcoin (BTC) trading around $76,000 at the time of writing on Wednesday. Ethereum (ETH) remains below the critical $2,100 resistance and holds firmly above $2,100 as investors assess the escalating tensions between the United States (US) and Iran.
Meanwhile, Ripple (XRP) hovers above support at $1.33 while facing increasing selling pressure toward the medium-term $1.40 hurdle.
US and Iran exchange fire, threatening the ceasefire.
Market participants appear to be sitting on the fence, waiting for clarity on a potential Memorandum of Understanding (MOU) between the US and Iran. This follows US military “self-defense” strikes on Iranian missile sites and mine-laying vessels. Iran’s Islamic Revolutionary Guard Corps (IRGC) has threatened to retaliate, putting pressure on the still-holding but fragile ceasefire.
The IRGC described US strikes as a violation of the ceasefire, noting that it downed a US drone and fired at a fighter jet. Still, there is no official statement on the suspension of the ceasefire, and the two nations are reportedly working to finalize the MOU, particularly on language and Iran’s nuclear program.
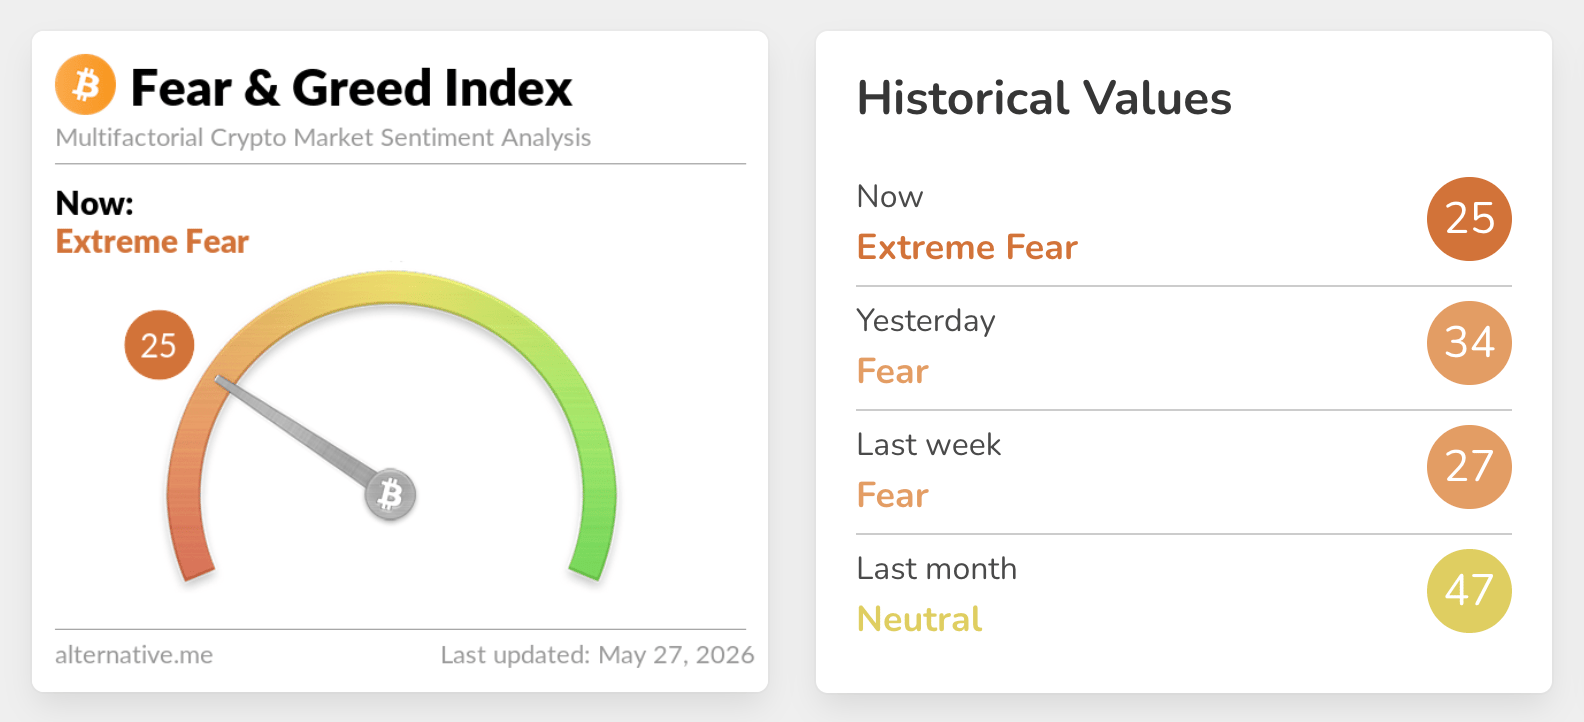
Sentiment in the broader crypto market remains largely in Extreme Fear Territory, according to the Fear & Greed Index, which stands at 25 on Wednesday, down from 34 the day before. The persistently suppressed sentiment reinforces the loss of appetite for risk assets, as the US and Iran exchange fire despite the ceasefire.
Bitcoin and Ethereum face ETF outflows
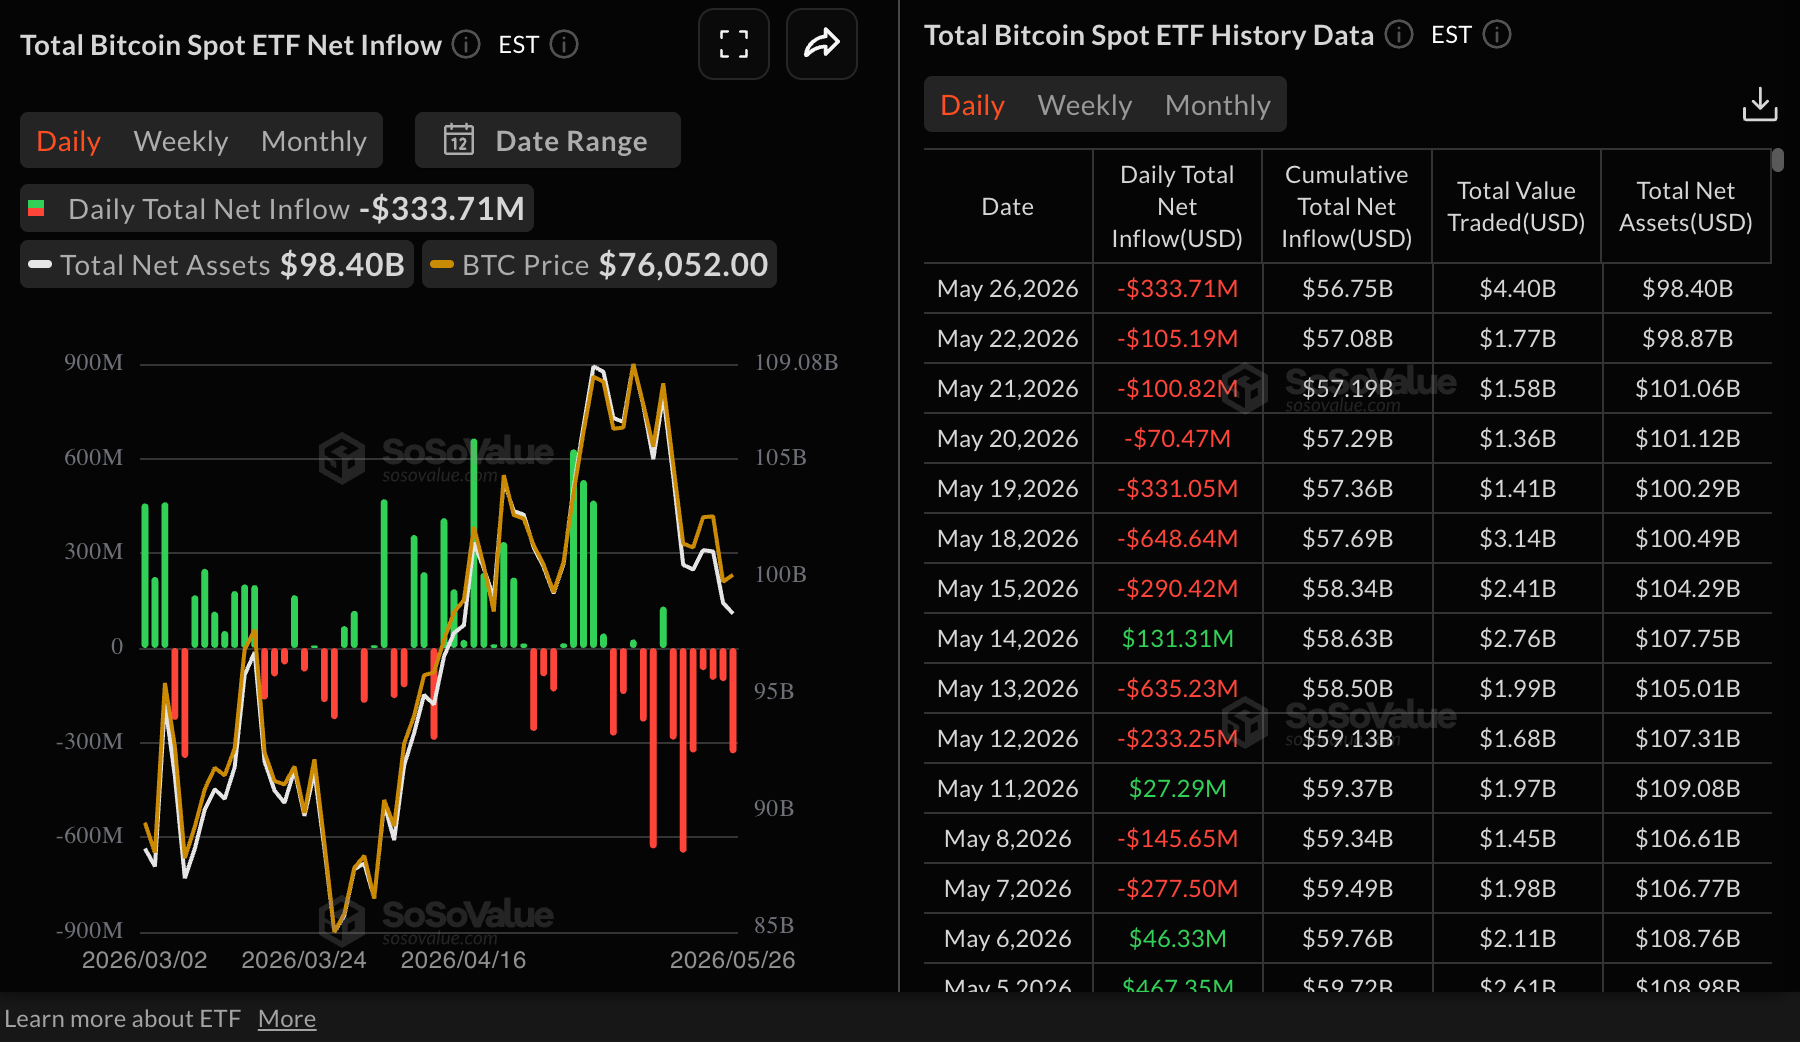
Institutions are persistently reducing their exposure to Bitcoin spot Exchange-Traded Funds (ETFs), which saw outflows totaling $334 million on Tuesday. The sell-off has driven cumulative inflows down to $56.75 billion while total assets under management moderate at $98.40 billion. Continued outflows are likely to keep exerting pressure while demand softens, leaving Bitcoin susceptible to losses.
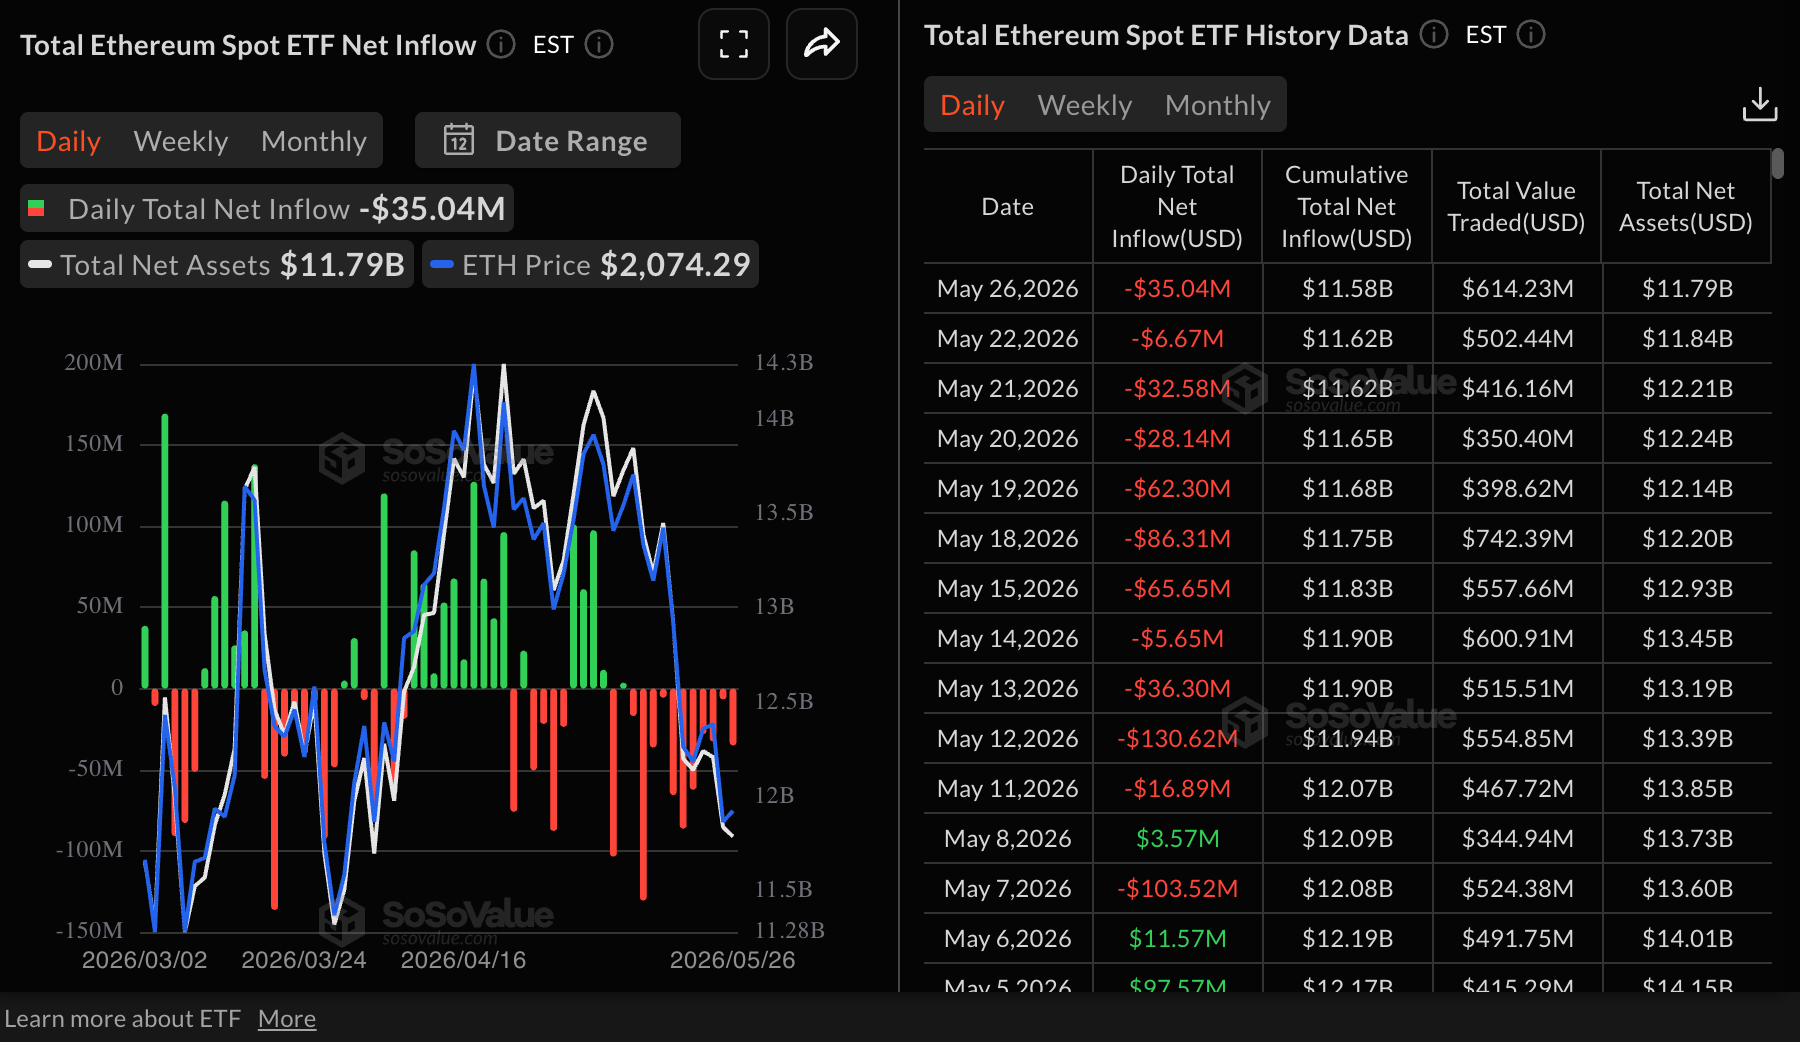
Ethereum spot ETFs face similar drawdowns, with outflows reaching $35 million on Tuesday. Cumulative inflows average $11.58 billion while total assets under management hold at $11.79 billion.
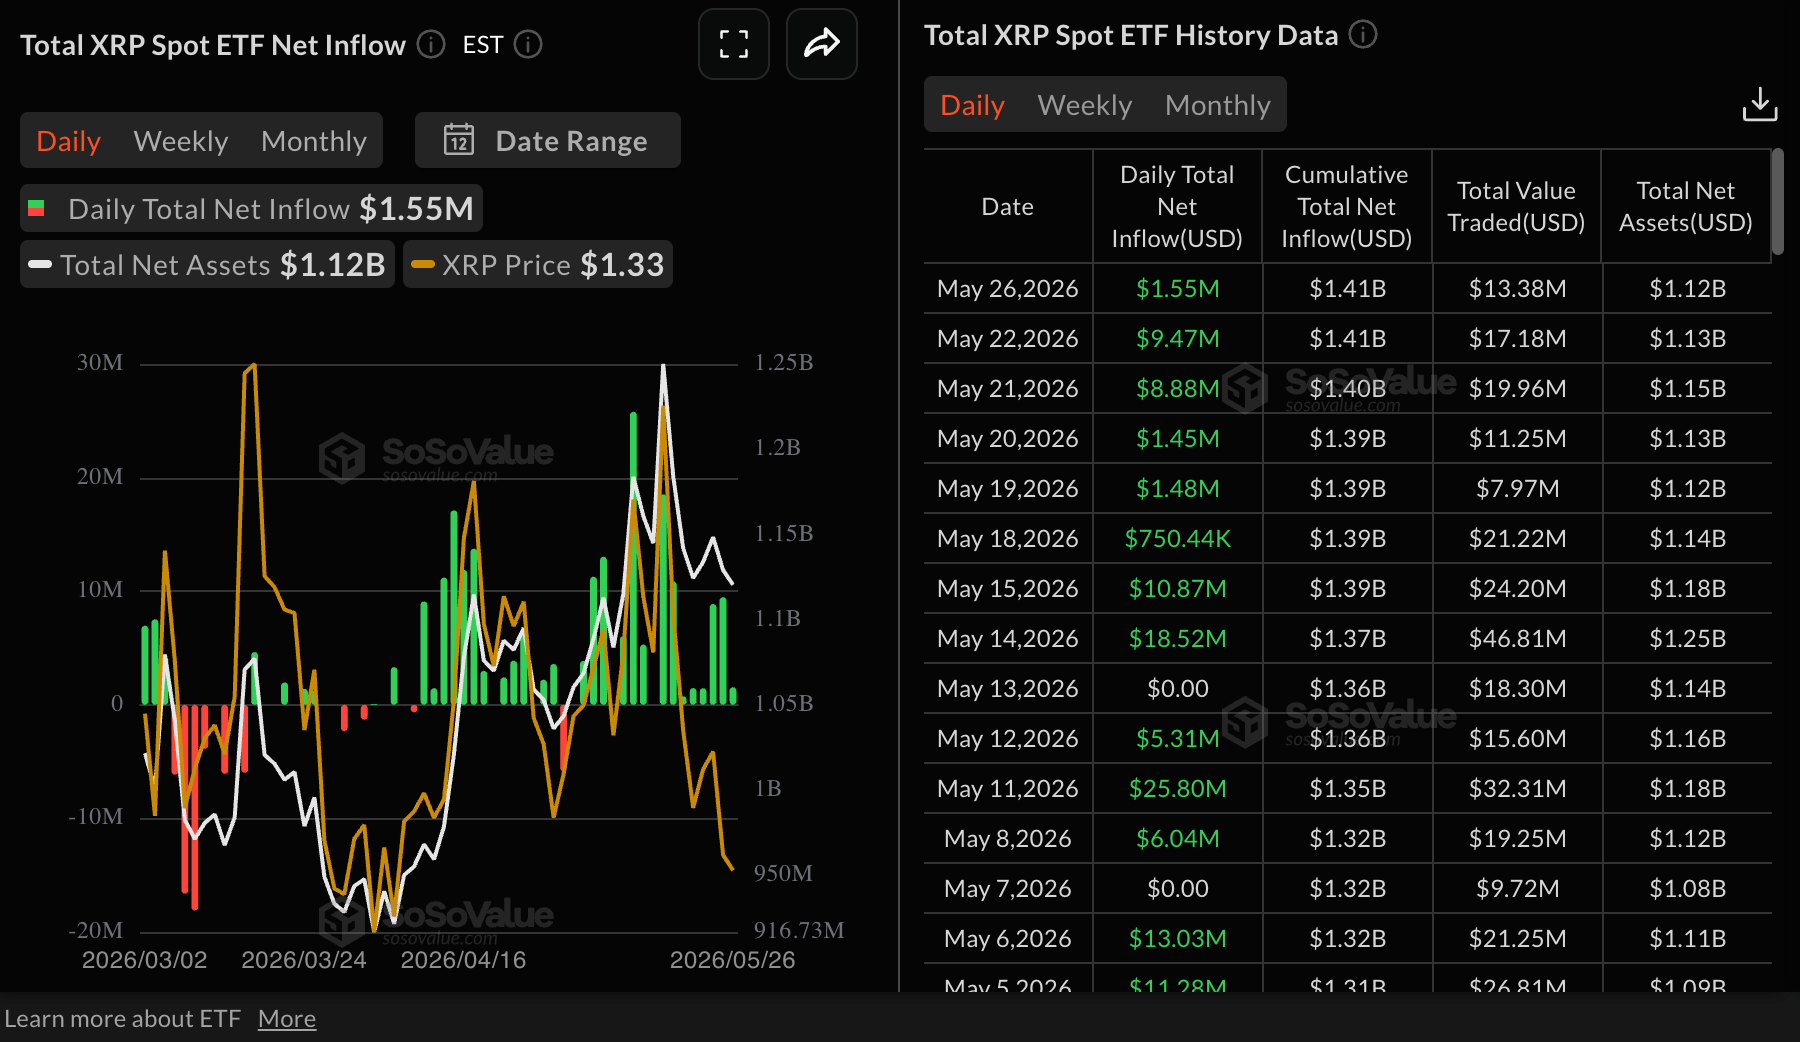
Meanwhile, XRP spot ETFs have sustained a steady bullish streak over the past two weeks, with inflows totaling $1.55 million on Tuesday. Cumulative inflows average $1.41 billion, while total assets under management stand at $ 1.12 billion.
Price analysis: Bitcoin holds short-term support
Bitcoin trades near $76,000, holding a bearish near-term bias as it remains capped beneath a dense band of moving averages. The 50-day Exponential Moving Average (EMA) at $76,724, the 100-day EMA at $76,847 and the 200-day EMA near $81,220 all sit overhead, suggesting rallies are likely to encounter supply while the pair consolidates below these trend gauges.
Momentum conditions are weak, with the Relative Strength Index (RSI) hovering in the low-40s on the daily chart and the Moving Average Convergence Divergence (MACD) histogram remaining negative, which hints that downside pressure persists despite the absence of extreme oversold conditions.
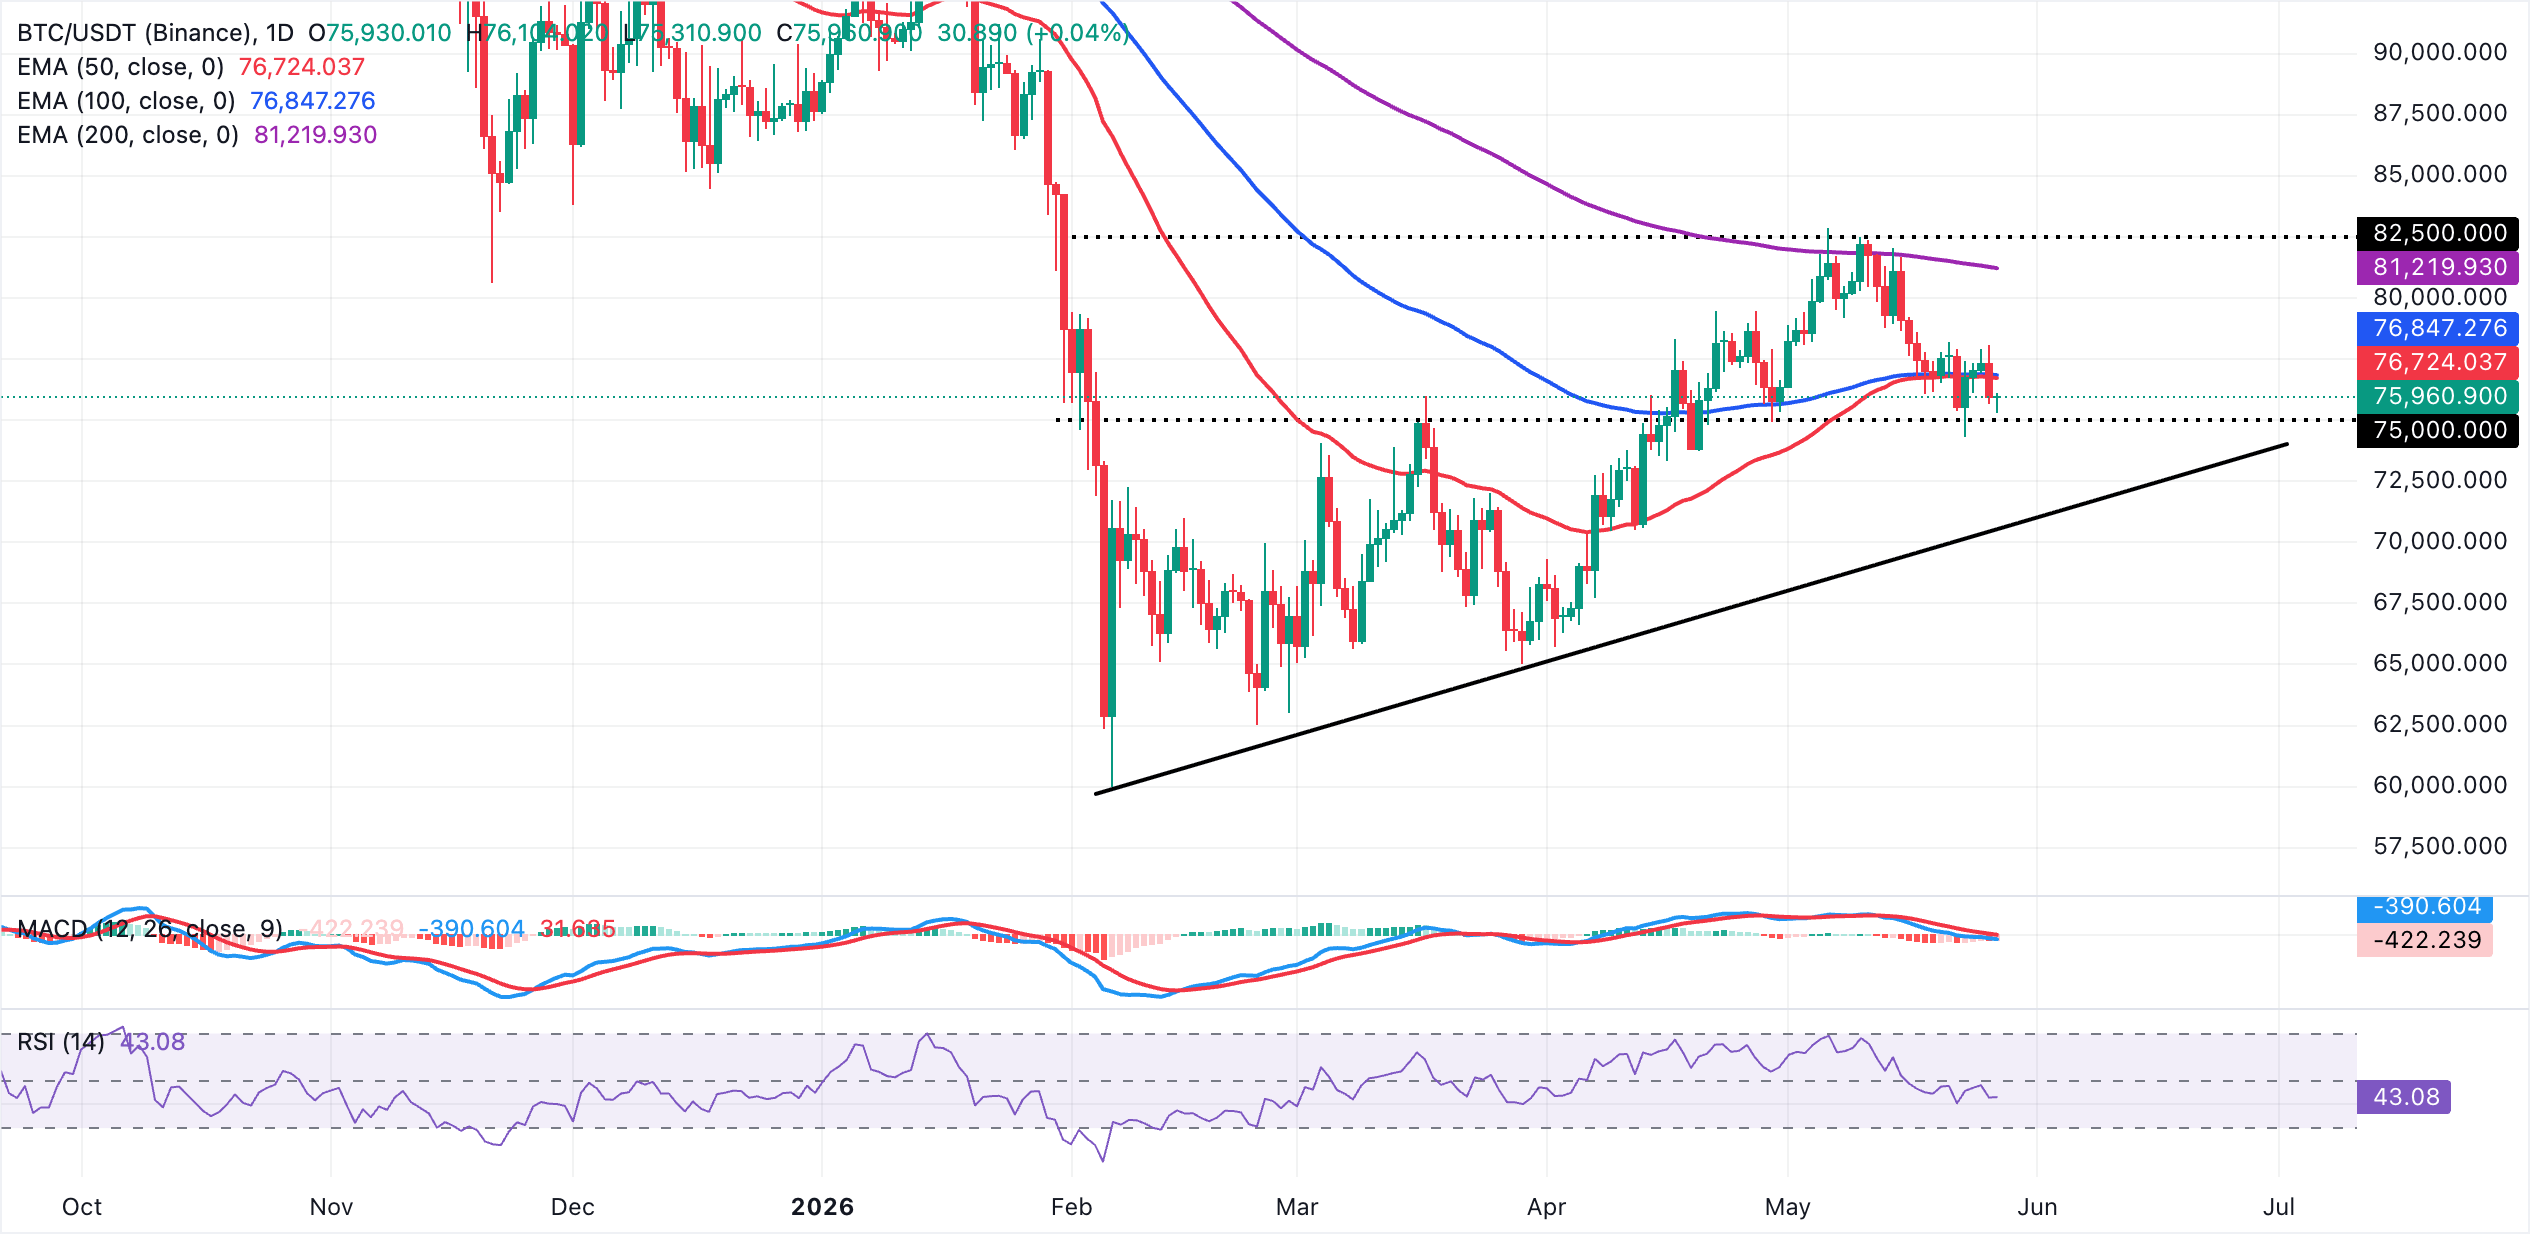
On the topside, immediate resistance lies at the 50-day EMA around $76,724, followed closely by the 100-day EMA at $76,847. A sustained break above this cluster would be needed to alleviate the current bearish tone and open the way toward the 200-day EMA near $81,220 as the next significant barrier.
On the downside, initial support falls on the rising trendline area around $70,574, where buyers may look to defend the broader bullish structure, and a decisive loss of this level would likely reinforce the corrective phase and expose deeper retracements in the sessions ahead.
Altcoins technical outlook: Ethereum and XRP upside remains limited
Ethereum trades at $2,090, retaining a bearish near-term bias as price holds below the 50-day, 100-day and 200-day EMAs. The clustering of these EMAs above the market suggests rallies are likely to be sold, while the RSI at 38 on the daily chart points to lingering downside pressure. At the same time, the MACD histogram remains in negative territory, which reinforces a weak tone even as the pair attempts to stabilize after recent losses.
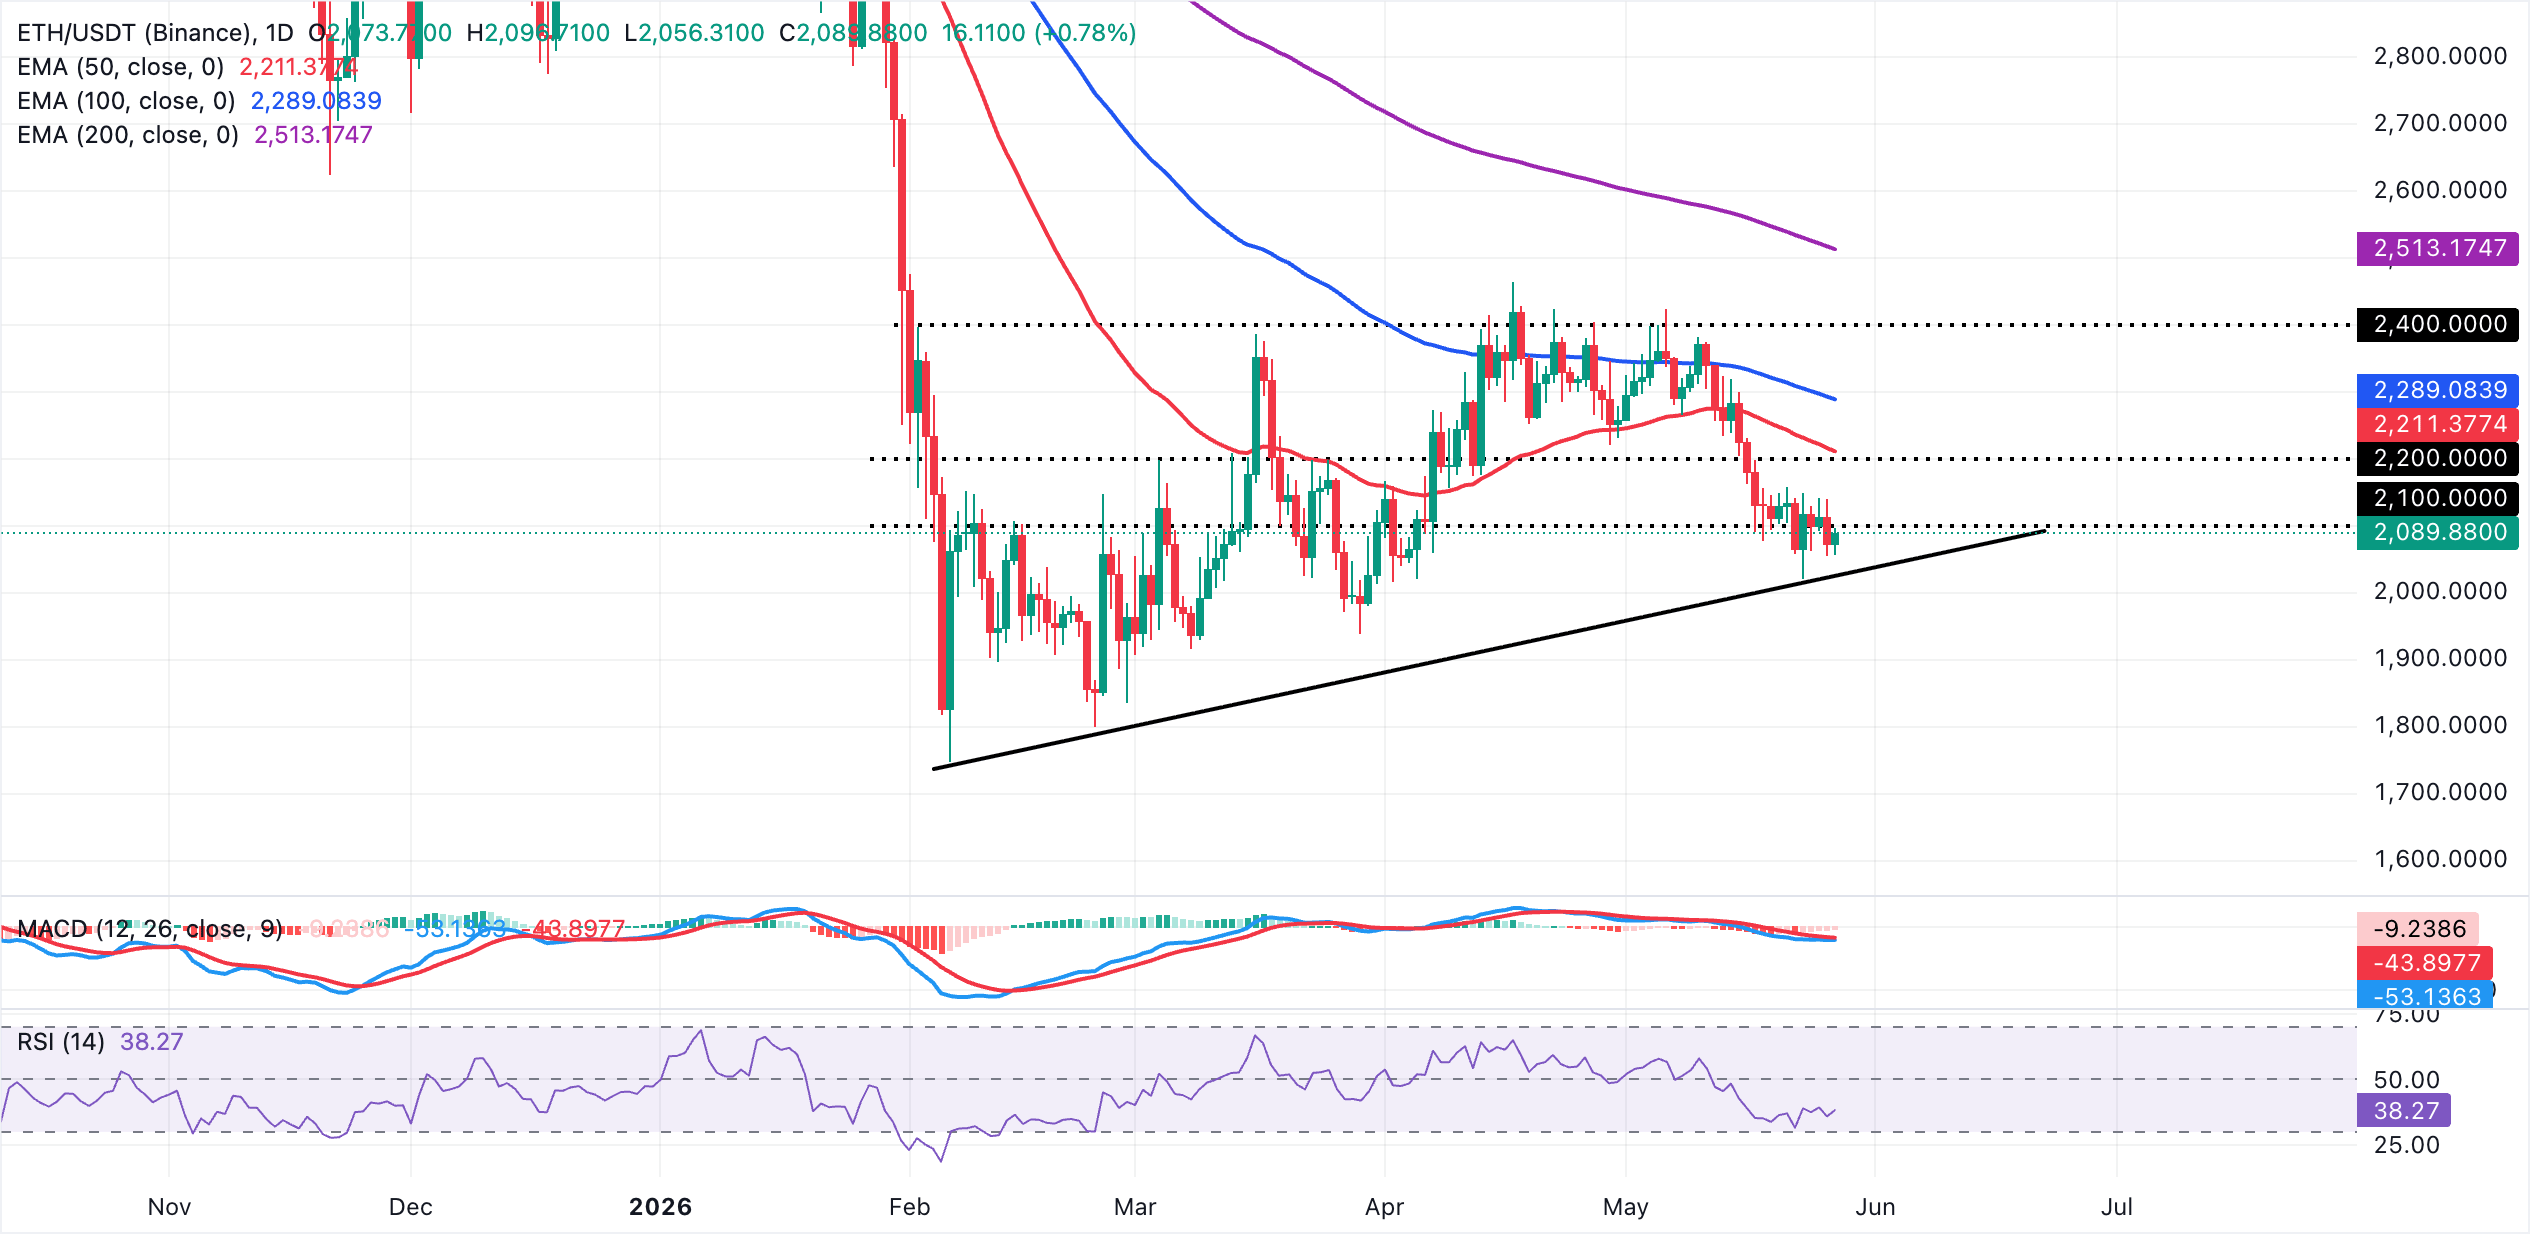
On the topside, initial resistance is seen at the 50-day EMA near $2,211, followed by the 100-day EMA around $2,289, with the 200-day EMA higher up at roughly $2,513 acting as a broader bearish cap. On the downside, the immediate focus is whether the market can defend the current $2,000 region. A clear break lower would expose the next demand zone around $1,900, where buyers may look to slow the decline.
XRP, on the other hand, trades at $1.33, holding a bearish near-term bias as price remains below the 50-day, 100-day, and 200-day EMAs at $1.40, $1.47, and $1.68 respectively. The MACD histogram remains in negative territory on the daily chart while the RSI hovers just under the 40 mark, suggesting persistent downside pressure rather than an imminent bullish reversal.
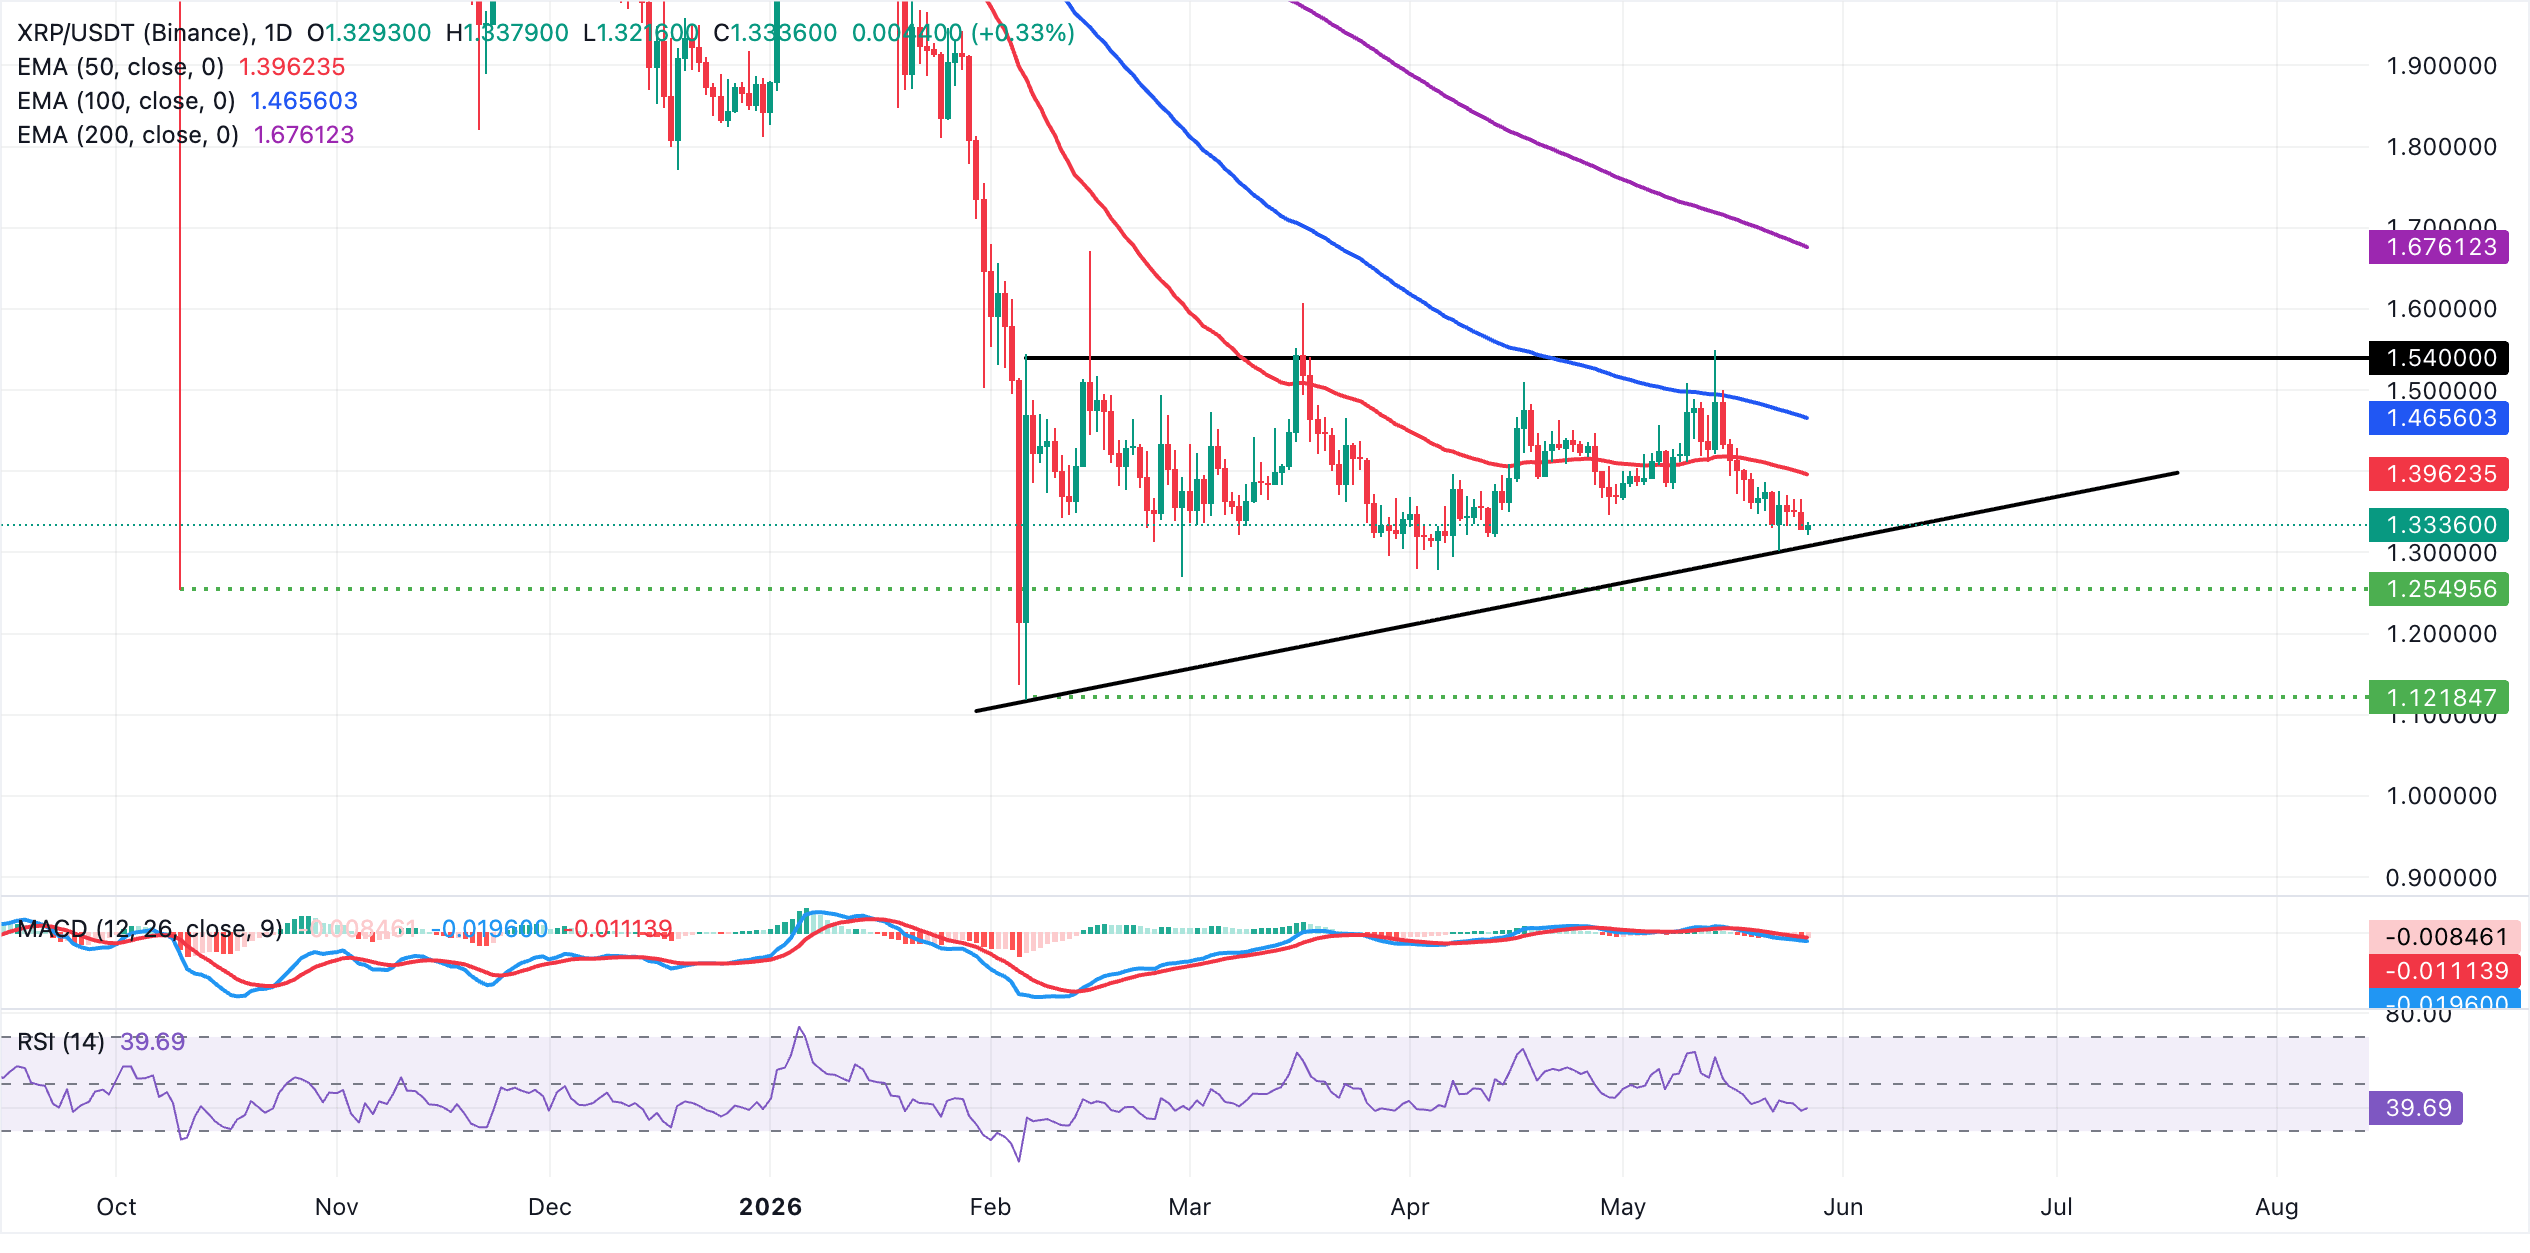
On the topside, initial resistance lies at the 50-day EMA near $1.40, with subsequent hurdles at the 100-day EMA around $1.47 and the 200-day EMA higher at $1.68, levels that would need to be reclaimed to ease the broader bearish tone. On the downside, immediate support is aligned with the ascending trend-line area around $1.31. A sustained break below this floor would likely open the way to a deeper retracement in the coming sessions.
(The technical analysis of this story was written with the help of an AI tool.)
Crypto ETF FAQs
An Exchange-Traded Fund (ETF) is an investment vehicle or an index that tracks the price of an underlying asset. ETFs can not only track a single asset, but a group of assets and sectors. For example, a Bitcoin ETF tracks Bitcoin’s price. ETF is a tool used by investors to gain exposure to a certain asset.
Yes. The first Bitcoin futures ETF in the US was approved by the US Securities & Exchange Commission in October 2021. A total of seven Bitcoin futures ETFs have been approved, with more than 20 still waiting for the regulator’s permission. The SEC says that the cryptocurrency industry is new and subject to manipulation, which is why it has been delaying crypto-related futures ETFs for the last few years.
Yes. The SEC approved in January 2024 the listing and trading of several Bitcoin spot Exchange-Traded Funds, opening the door to institutional capital and mainstream investors to trade the main crypto currency. The decision was hailed by the industry as a game changer.
The main advantage of crypto ETFs is the possibility of gaining exposure to a cryptocurrency without ownership, reducing the risk and cost of holding the asset. Other pros are a lower learning curve and higher security for investors since ETFs take charge of securing the underlying asset holdings. As for the main drawbacks, the main one is that as an investor you can’t have direct ownership of the asset, or, as they say in crypto, “not your keys, not your coins.” Other disadvantages are higher costs associated with holding crypto since ETFs charge fees for active management. Finally, even though investing in ETFs reduces the risk of holding an asset, price swings in the underlying cryptocurrency are likely to be reflected in the investment vehicle too.
추천 기사


