


Gold falls as US Dollar, Treasury yields rebound ahead of Fed Minutes
- Gold falls nearly 1.20% as the US Dollar and US Treasury yields resume their advance.
- Traders await the FOMC Minutes for fresh clues on the likelihood of another rate hike before year-end.
- XAU/USD drifts toward $4,100 support while holding below its key daily SMAs.
Gold (XAU/USD) edges lower on Wednesday, losing nearly 1.20% as the US Dollar (USD) and US Treasury yields resume their advance following a modest pullback the previous day. At the time of writing, XAU/USD trades around $4,114, with markets awaiting the minutes of the Federal Reserve’s (Fed) September monetary policy meeting, due at 18:00 GMT.
The US Dollar Index (DXY), which tracks the Greenback’s value against a basket of six major currencies, trades around 102.30, holding near levels last seen in April 2025. Meanwhile, the benchmark 10-year US Treasury yield rises to around 5.324%, approaching Monday’s peak of 5.349%, its highest level since 2002.
Oil-driven inflation risks stemming from the Middle East conflict, concerns over rising government debt and fiscal deficits, and a resilient US growth outlook are all contributing to the increase in borrowing costs. Higher Treasury yields raise the opportunity cost of holding non-yielding assets such as Gold while strengthening demand for the US Dollar, making the precious metal more expensive for buyers using other currencies.
Despite Wednesday’s decline, the yellow metal remains trapped in a consolidation range that has held for most of the past week. Traders are reassessing the Fed’s monetary policy path after recent US employment figures and Personal Consumption Expenditures (PCE) inflation data came in softer than expected.
Markets widely expect the US central bank to leave interest rates unchanged at its October 27-28 meeting following a 25-basis-point (bps) rate hike in September. However, persistent inflation risks, partly driven by elevated energy prices, keep the possibility of another increase in December on the table.
Against this backdrop, traders will closely examine the Federal Open Market Committee (FOMC) meeting minutes for fresh guidance on the likelihood of additional tightening.
A hawkish Fed outlook has weighed heavily on Gold since the Middle East conflict erupted in late February, leaving the metal more than 25% below January’s all-time high near $5,600. Nevertheless, longer-term demand continues to provide underlying support.
Central bank gold buying streak extends as China leads August demand
Analysts at ING highlight that official sector appetite for bullion remains robust, pointing to World Gold Council (WGC) data showing that "central banks remained net buyers in August, adding 39 tonnes and bringing year-to-date purchases to 170 tonnes."
ING notes that China once again dominated activity, with the PBoC "leading purchases with 20 tonnes, extending its buying streak to 22 consecutive months," while smaller but notable additions came from other emerging European and Central Asian buyers, as "Poland and Uzbekistan each added 8 tonnes to their reserves." This steady accumulation underscores the ongoing role of gold in central bank reserve diversification.
Technical analysis: XAU/USD consolidates with bearish bias below key SMAs
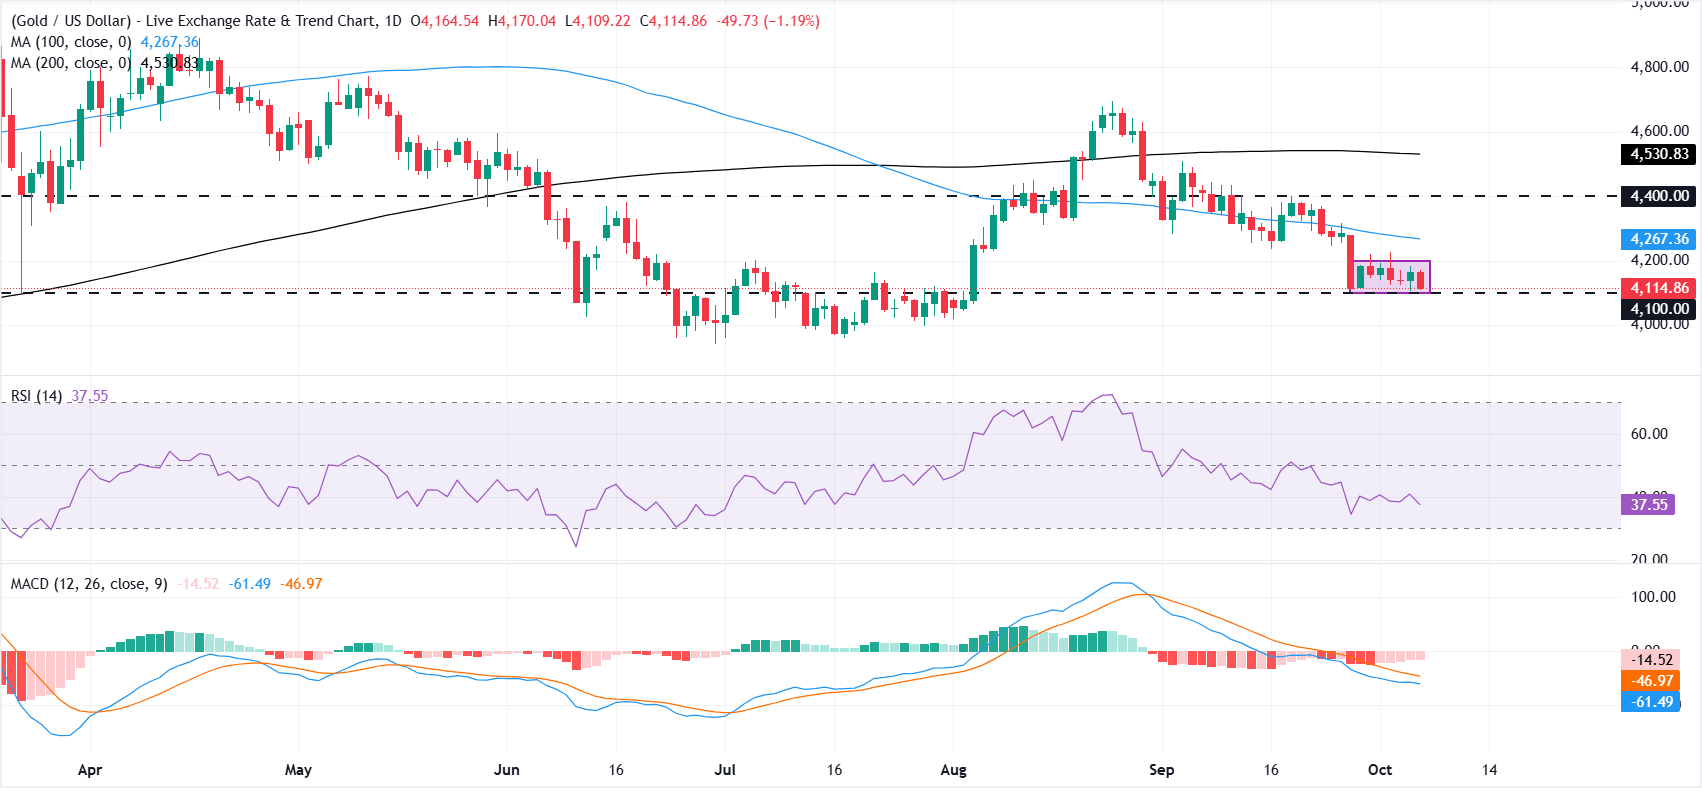
On the daily chart, XAU/USD drifts toward the lower end of its $4,100-$4,200 consolidation range. The metal remains well below the 100-day and 200-day Simple Moving Averages (SMAs) at $4,267 and $4,531, respectively, keeping the broader technical bias tilted to the downside.
Momentum indicators remain bearish but point to limited selling pressure. The Relative Strength Index (RSI) stands near 38 without reaching oversold territory, while the Moving Average Convergence Divergence (MACD) remains negative, with the histogram printing fading red bars.
On the downside, the $4,100 psychological mark acts as immediate support. A sustained break below this level could drag Gold toward the year-to-date lows within the $4,000-$3,950 zone.
On the topside, initial resistance is seen at $4,200, followed by the 100-day SMA near $4,267. A stronger recovery could bring the $4,400 horizontal barrier into focus, while the 200-day SMA near $4,531 remains a major obstacle for buyers.
(The technical analysis of this story was written with the help of an AI tool. Know more.)
Gold FAQs
Gold has played a key role in human’s history as it has been widely used as a store of value and medium of exchange. Currently, apart from its shine and usage for jewelry, the precious metal is widely seen as a safe-haven asset, meaning that it is considered a good investment during turbulent times. Gold is also widely seen as a hedge against inflation and against depreciating currencies as it doesn’t rely on any specific issuer or government.
Central banks are the biggest Gold holders. In their aim to support their currencies in turbulent times, central banks tend to diversify their reserves and buy Gold to improve the perceived strength of the economy and the currency. High Gold reserves can be a source of trust for a country’s solvency. Central banks added 1,136 tonnes of Gold worth around $70 billion to their reserves in 2022, according to data from the World Gold Council. This is the highest yearly purchase since records began. Central banks from emerging economies such as China, India and Turkey are quickly increasing their Gold reserves.
Gold has an inverse correlation with the US Dollar and US Treasuries, which are both major reserve and safe-haven assets. When the Dollar depreciates, Gold tends to rise, enabling investors and central banks to diversify their assets in turbulent times. Gold is also inversely correlated with risk assets. A rally in the stock market tends to weaken Gold price, while sell-offs in riskier markets tend to favor the precious metal.
The price can move due to a wide range of factors. Geopolitical instability or fears of a deep recession can quickly make Gold price escalate due to its safe-haven status. As a yield-less asset, Gold tends to rise with lower interest rates, while higher cost of money usually weighs down on the yellow metal. Still, most moves depend on how the US Dollar (USD) behaves as the asset is priced in dollars (XAU/USD). A strong Dollar tends to keep the price of Gold controlled, whereas a weaker Dollar is likely to push Gold prices up.
추천 기사


