


WTI Oil fluctuates near six-week high as Middle East tensions fuel volatility
- WTI Oil fluctuates near its highest level since July 24 as Middle East tensions keep supply concerns elevated.
- US crude stocks fall by 4.45 million barrels, exceeding market expectations.
- WTI holds above key moving averages, but the $90-$92 resistance zone caps immediate gains.
West Texas Intermediate (WTI) Oil sees two-way price swings on Wednesday as escalating tensions in the Middle East keep energy markets volatile and the geopolitical risk premium elevated. At the time of writing, WTI trades around $89.70 per barrel after reaching an intraday high of $90.78, its highest level since July 24.
Iran’s Islamic Revolutionary Guard Corps (IRGC) said on Wednesday that two Oil tankers struck naval mines while attempting to transit the waterway. According to the IRGC, the vessels were disabled and their crews forced to disembark after they ignored warnings against taking what it described as an “illegal route.”
Oil prices also draw support from a larger-than-expected decline in US inventories. The Energy Information Administration (EIA) reported that crude stocks fell by 4.45 million barrels last week, well above expectations for a 1.1-million-barrel draw and reversing the previous week’s modest increase of 95,000 barrels.
Strategists at Brown Brothers Harriman argue that "further upside in Oil prices appears limited as Persian Gulf oil exports recover." They highlight Goldman Sachs estimates that oil flows from the region have "returned to roughly two-thirds of their pre-war level of 20 million barrel per day," a view they say is broadly consistent with the US Energy Secretary’s assessment that, on average, "8 million barrels a day are passing through the Strait of Hormuz, while another 4 to 5 million barrels are bypassing it through pipelines." Together, these figures suggest that supply disruptions are easing even as geopolitical tensions remain elevated.
Looking ahead, traders await the OPEC+ meeting on Sunday. The alliance is likely to leave its Oil production policy unchanged for October, Reuters reported on Wednesday, citing three sources familiar with the matter.
Technical analysis
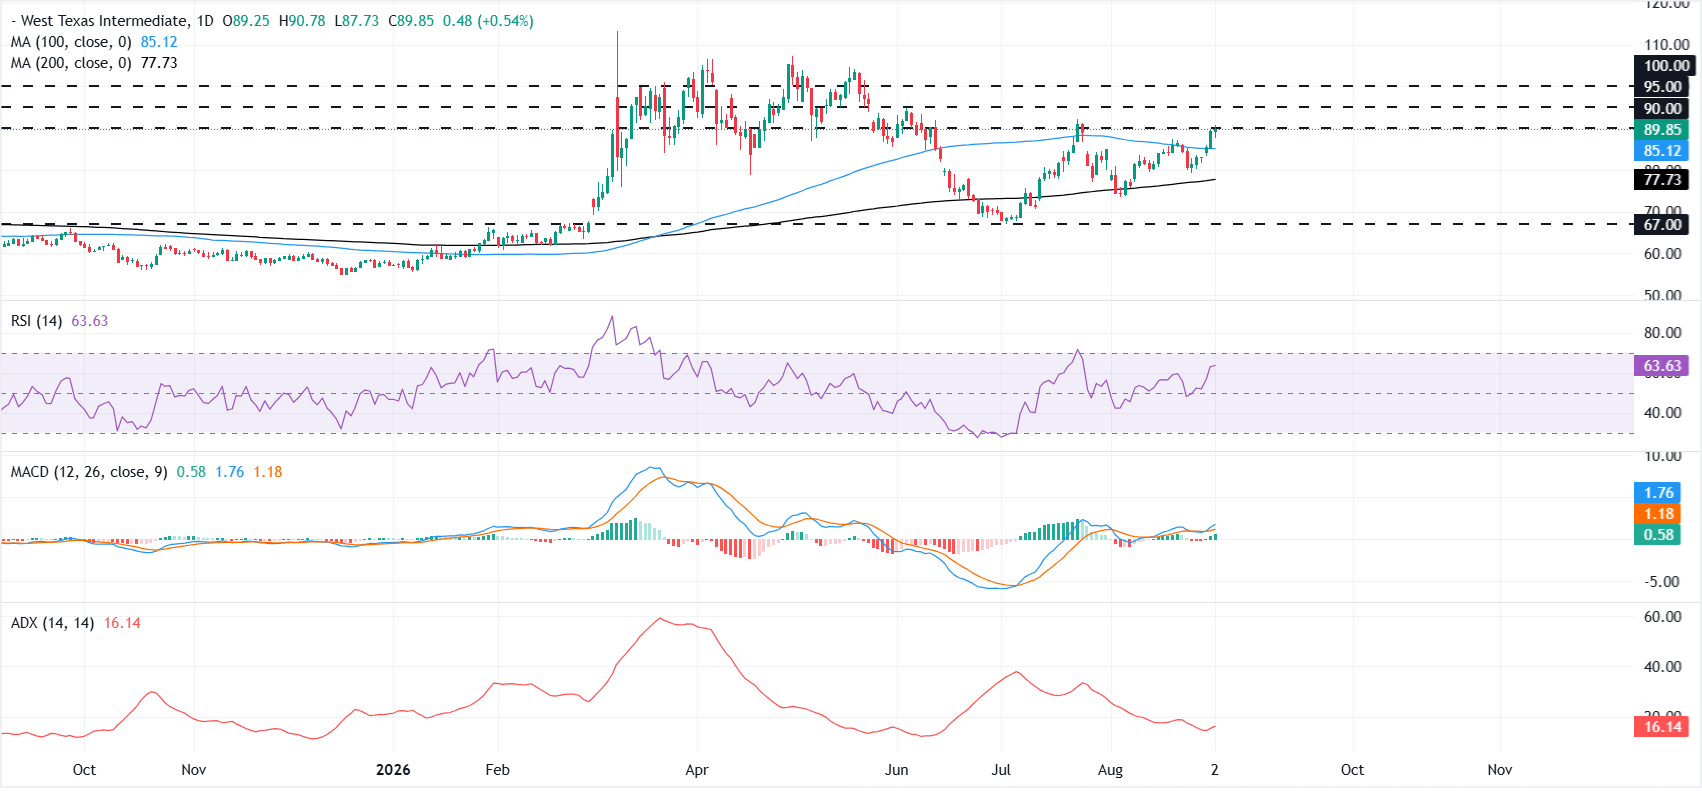
On the daily chart, WTI Oil retains a constructive bias as it holds comfortably above the 100-day and 200-day Simple Moving Averages (SMAs). However, the $90-$92 region forms a key resistance zone capping the immediate upside.
The Relative Strength Index (RSI) stands near 64, while the Moving Average Convergence Divergence (MACD) remains in positive territory. However, the Average Directional Index (ADX) near 16 suggests that the broader bullish trend lacks strength.
A sustained break above $92 could open the door toward $95, followed by the psychological $100 mark. On the downside, the 100-day SMA around $85 offers initial support. A decisive break below this level would expose the 200-day SMA near $77, while the horizontal floor around $67-$65 would come into focus only if the moving-average supports fail.
(The technical analysis of this story was written with the help of an AI tool. Know more.)
WTI Oil FAQs
WTI Oil is a type of Crude Oil sold on international markets. The WTI stands for West Texas Intermediate, one of three major types including Brent and Dubai Crude. WTI is also referred to as “light” and “sweet” because of its relatively low gravity and sulfur content respectively. It is considered a high quality Oil that is easily refined. It is sourced in the United States and distributed via the Cushing hub, which is considered “The Pipeline Crossroads of the World”. It is a benchmark for the Oil market and WTI price is frequently quoted in the media.
Like all assets, supply and demand are the key drivers of WTI Oil price. As such, global growth can be a driver of increased demand and vice versa for weak global growth. Political instability, wars, and sanctions can disrupt supply and impact prices. The decisions of OPEC, a group of major Oil-producing countries, is another key driver of price. The value of the US Dollar influences the price of WTI Crude Oil, since Oil is predominantly traded in US Dollars, thus a weaker US Dollar can make Oil more affordable and vice versa.
The weekly Oil inventory reports published by the American Petroleum Institute (API) and the Energy Information Agency (EIA) impact the price of WTI Oil. Changes in inventories reflect fluctuating supply and demand. If the data shows a drop in inventories it can indicate increased demand, pushing up Oil price. Higher inventories can reflect increased supply, pushing down prices. API’s report is published every Tuesday and EIA’s the day after. Their results are usually similar, falling within 1% of each other 75% of the time. The EIA data is considered more reliable, since it is a government agency.
OPEC (Organization of the Petroleum Exporting Countries) is a group of 12 Oil-producing nations who collectively decide production quotas for member countries at twice-yearly meetings. Their decisions often impact WTI Oil prices. When OPEC decides to lower quotas, it can tighten supply, pushing up Oil prices. When OPEC increases production, it has the opposite effect. OPEC+ refers to an expanded group that includes ten extra non-OPEC members, the most notable of which is Russia.
추천 기사


