


Gold pauses near three-month high after sharp rally
- Gold retreats after setting a fresh three-month high during Asian trading hours.
- Treasury buybacks revive the US Dollar debasement narrative and support demand for bullion.
- XAU/USD maintains a firm bullish bias above the 50-day, 100-day and 200-day SMAs.
Gold (XAU/USD) loses ground on Tuesday after setting a fresh three-month high of $4,697 earlier in the Asian session. Traders appear to be booking some profits following the recent rally, which has pushed the Relative Strength Index (RSI) into overbought territory. At the time of writing, XAU/USD trades around $4,640 after touching an intraday low of $4,618.
A modest recovery in the US Dollar (USD) also limits demand for the USD-denominated metal. The US Dollar Index (DXY), which tracks the Greenback’s value against a basket of six major currencies, trades around 99 after falling to 98.56 last week, its lowest level since May 14.
However, the downside could remain limited as both the near-term macroeconomic and technical pictures continue to favour Gold buyers. According to TD Securities, the precious metals complex is drawing strong support from developments in the US bond market, with the firm noting that the market is responding to US Treasury Secretary Scott Bessent's intervention this week, which may see “Treasury buying more than double to $8 billion between September 9 and November 4, as the battle is on to tame long-end yields.”
Strategists argue that this stepped-up buying “has lit a fire under gold and silver,” while “worries about America's fiscal situation are once again resurrecting the USD debasement narrative, which, in turn, is energizing gold bugs.”
Demand for Gold-backed exchange-traded funds also strengthened last week. World Gold Council (WGC) data show that global Gold ETFs attracted net inflows of $3.52 billion, equivalent to 23.6 tonnes. Year-to-date inflows now stand at $21.34 billion, or 116.1 tonnes, led by strong demand from Asia and Europe.
Middle East headlines remain at the centre of attention, adding to volatility amid a quiet US economic docket. Tehran is “fully prepared” to counter US sanctions, Iranian Finance Minister Ali Madanizadeh told the state-run media on Monday. His comments came after the US Treasury launched “Operation Economic Outcast,” a wider sanctions campaign aimed at cutting off financial support for the Iranian government.
Oil prices show little reaction to the latest developments. West Texas Intermediate (WTI) trades below its recent highs and is down nearly 3.5% on the day at the time of writing. However, prices remain well above pre-war levels, keeping energy-driven inflation risks alive and adding uncertainty around the Federal Reserve’s (Fed) interest-rate path.
Looking ahead, traders await the US Personal Consumption Expenditures (PCE) Price Index on Wednesday and Fed Chairman Kevin Warsh’s speech at the Jackson Hole Symposium on Friday.
Technical analysis: XAU/USD challenges $4,700 with bullish structure intact
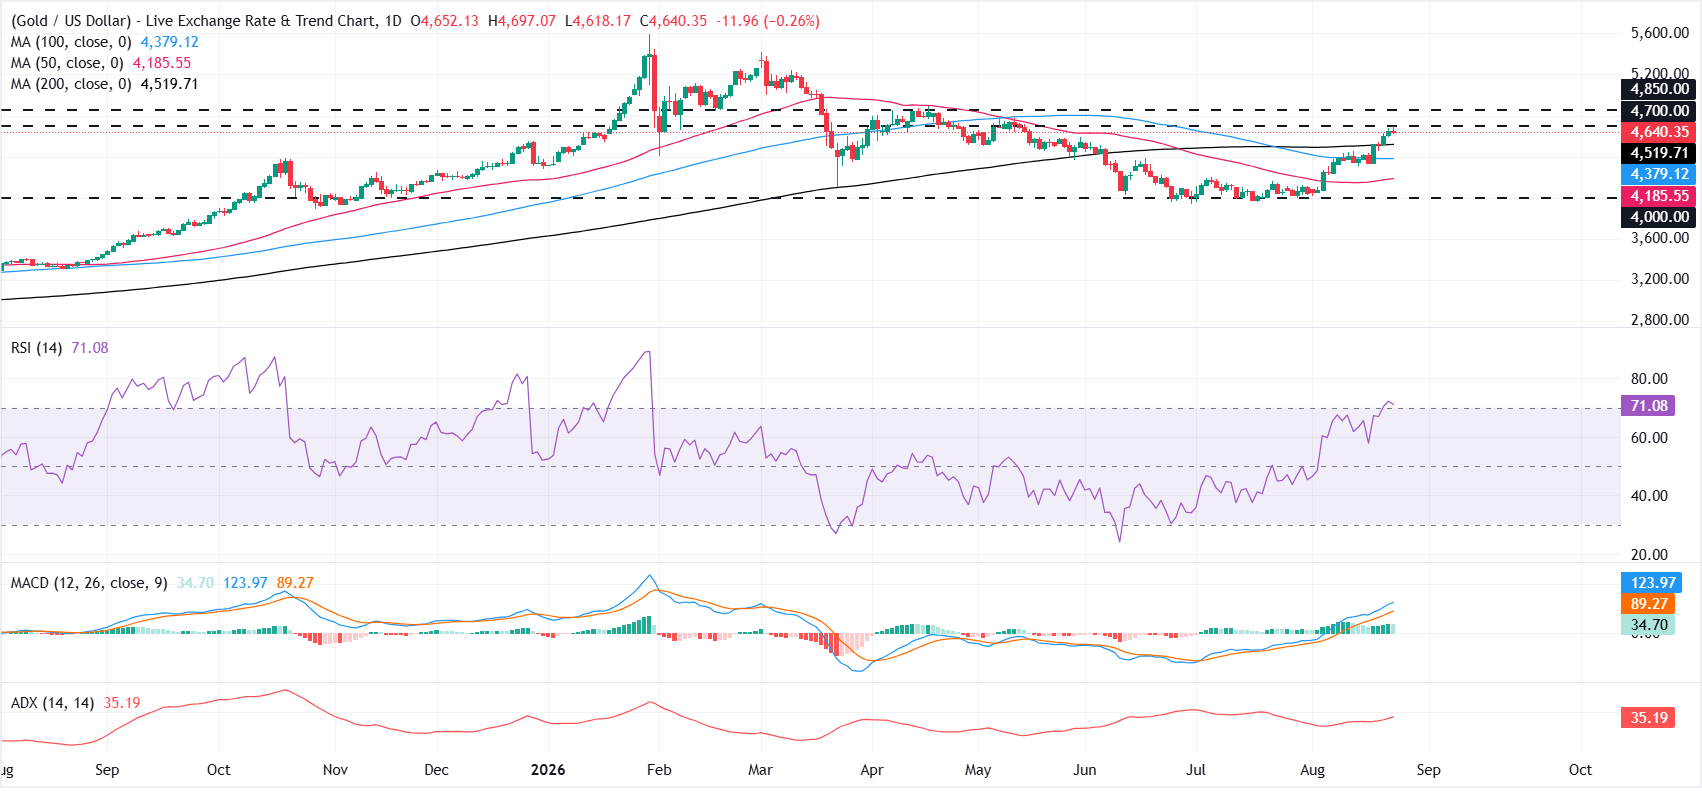
On the daily chart, XAU/USD holds a firm bullish bias as price extends well above the 50-day, 100-day and 200-day Simple Moving Averages (SMAs) clustered between roughly $4,185 and $4,520.
This stacked configuration of underlying SMAs suggests an entrenched uptrend, while the Relative Strength Index (14) near 71 signals overbought conditions and the Moving Average Convergence Divergence (MACD) remains firmly positive, hinting that bullish momentum is strong but potentially stretched as the metal approaches overhead supply.
On the topside, initial resistance emerges at the horizontal barrier around $4,700, with the next cap seen at $4,850 if buyers extend the advance. On the downside, immediate support is provided by the 200-day SMA near $4,520, ahead of the 100-day SMA around $4,379 and the 50-day SMA near $4,186, while a deeper correction would meet more substantial demand at the horizontal floor around $4,000.
(The technical analysis of this story was written with the help of an AI tool. Know more.)
Gold FAQs
Gold has played a key role in human’s history as it has been widely used as a store of value and medium of exchange. Currently, apart from its shine and usage for jewelry, the precious metal is widely seen as a safe-haven asset, meaning that it is considered a good investment during turbulent times. Gold is also widely seen as a hedge against inflation and against depreciating currencies as it doesn’t rely on any specific issuer or government.
Central banks are the biggest Gold holders. In their aim to support their currencies in turbulent times, central banks tend to diversify their reserves and buy Gold to improve the perceived strength of the economy and the currency. High Gold reserves can be a source of trust for a country’s solvency. Central banks added 1,136 tonnes of Gold worth around $70 billion to their reserves in 2022, according to data from the World Gold Council. This is the highest yearly purchase since records began. Central banks from emerging economies such as China, India and Turkey are quickly increasing their Gold reserves.
Gold has an inverse correlation with the US Dollar and US Treasuries, which are both major reserve and safe-haven assets. When the Dollar depreciates, Gold tends to rise, enabling investors and central banks to diversify their assets in turbulent times. Gold is also inversely correlated with risk assets. A rally in the stock market tends to weaken Gold price, while sell-offs in riskier markets tend to favor the precious metal.
The price can move due to a wide range of factors. Geopolitical instability or fears of a deep recession can quickly make Gold price escalate due to its safe-haven status. As a yield-less asset, Gold tends to rise with lower interest rates, while higher cost of money usually weighs down on the yellow metal. Still, most moves depend on how the US Dollar (USD) behaves as the asset is priced in dollars (XAU/USD). A strong Dollar tends to keep the price of Gold controlled, whereas a weaker Dollar is likely to push Gold prices up.
추천 기사


