


USD/JPY Price Forecast: Testing 200-day SMA amid strong US data, higher yields
- USD/JPY is testing the 200-day SMA, at the 158.50 area, after rallying beyond 3% in less than two weeks.
- Strong US business activity data and higher Treasury yields are boosting speculative support for the USD.
- Concerns of an upcoming intervention by Japanese authorities are keeping the Yen from depreciating further.
The US Dollar (USD) consolidates gains against the Japanese Yen (JPY) on Wednesday, with bulls pushing against the key 200-day Simple Moving Average (SMA), at 158.47. Strong US business activity data and a poor bond auction that sent US Treasury yields soaring boosted the US Dollar across the board on Wednesday, increasing negative pressure on an already weak Yen.
Preliminary US S&P Global Purchasing Managers Index (PMI) figures released on Wednesday revealed that business activity accelerated to its fastest pace in five years in September. US firms also reported a strong increase in jobs, which forced them to offer higher wages in a period of rising input costs as energy prices remain at high levels.
The data contributed to endorse hopes that the Federal Reserve (Fed) will have to hike interest rates further in the coming months, a view backed by Federal Reserve Governor Michael Barr later on, who affirmed that price stability is “crucial” to support durable growth and maximum employment.
Also on Wednesday, a five-year US Treasury bond auction met weak demand, which sent yields surging across the curve and provided additional support to the US Dollar.
Against this backdrop, the pair appreciates 0.8% this week and has rallied more than 3% in less than two weeks. This keeps investors on edge about a potential intervention by Tokyo authorities, which is keeping the US Dollar from rallying further on Thursday, although downside attempts are likely to remain capped.
Technical Analysis: Bulls are testing key resistance around 158.50
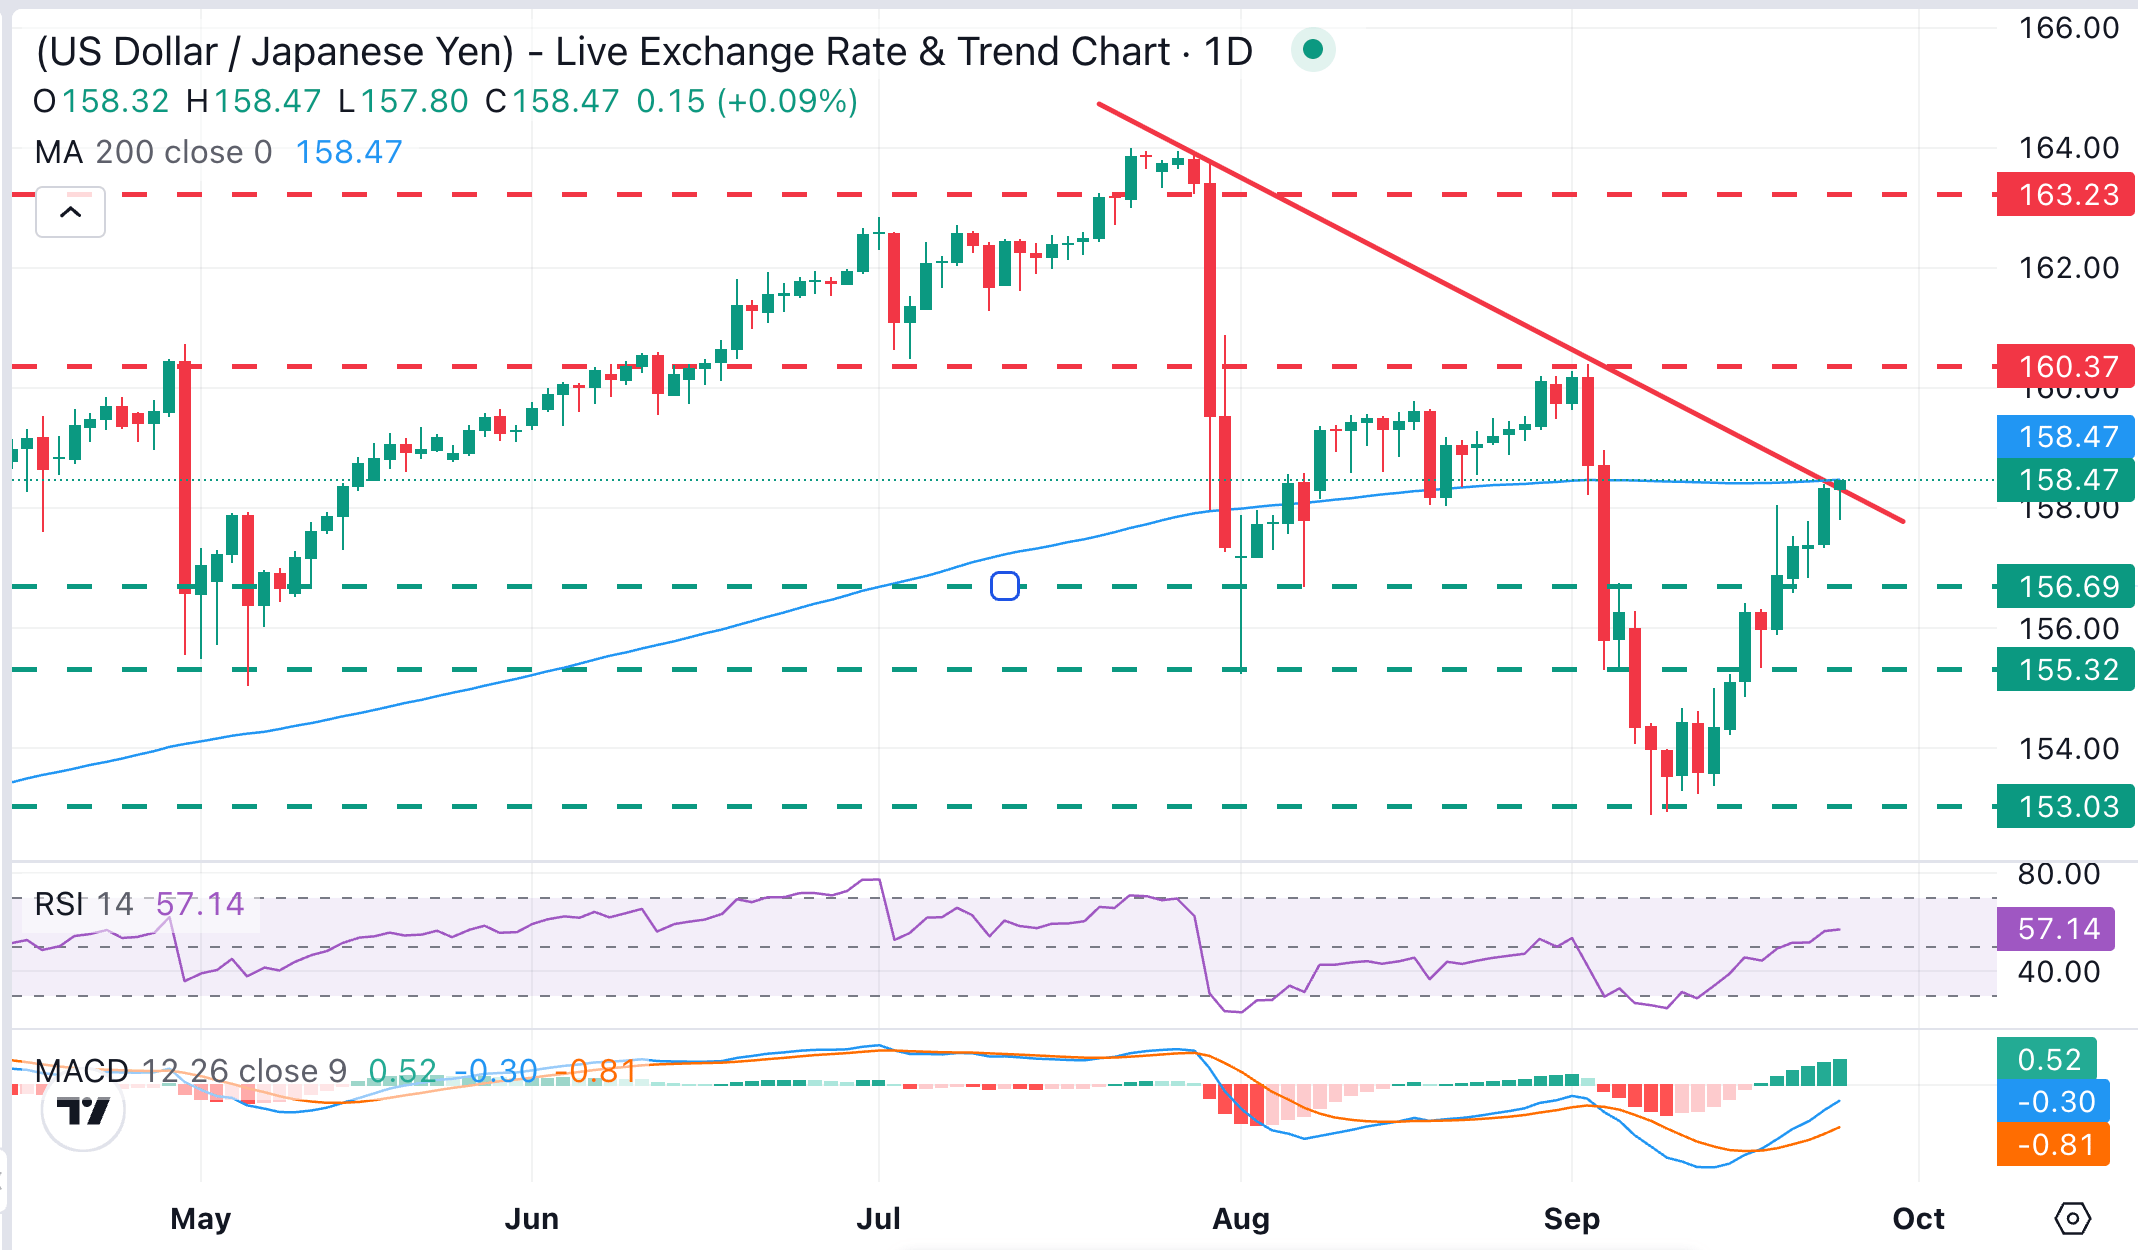
USD/JPY trades at 158.30, with near-term price action showing a firm bullish trend and the key resistance area around 158.30, where the descending trendline from July highs meets the 200-day simple moving average SMA, coming under pressure. Momentum indicators in the daily chart support the bullish view, as the Relative Strength Index (RSI) trends higher beyond the 50 midline and the Moving Average Convergence Divergence (MACD) histogram prints wider green bars.
A break of the 200-day SMA, a popular indicator for FX traders, would boost bulls' confidence and expose the late August and early September highs at the 160.35 area. On the downside, Wednesday's low of 157.36 is likely to test a potential bearish reaction ahead of the September 21 low at the 156.60 area, and the September 17 low, around 155.35.
(The technical analysis of this story was written with the help of an AI tool. Know more.)
US Dollar Price This week
The table below shows the percentage change of US Dollar (USD) against listed major currencies this week. US Dollar was the strongest against the Australian Dollar.
| USD | EUR | GBP | JPY | CAD | AUD | NZD | CHF | |
|---|---|---|---|---|---|---|---|---|
| USD | 0.89% | 1.13% | 1.05% | 0.83% | 1.13% | 0.80% | 0.22% | |
| EUR | -0.89% | 0.25% | 0.16% | -0.07% | 0.24% | -0.09% | -0.65% | |
| GBP | -1.13% | -0.25% | -0.19% | -0.32% | -0.01% | -0.35% | -0.91% | |
| JPY | -1.05% | -0.16% | 0.19% | -0.19% | 0.07% | -0.24% | -0.80% | |
| CAD | -0.83% | 0.07% | 0.32% | 0.19% | 0.37% | -0.04% | -0.59% | |
| AUD | -1.13% | -0.24% | 0.01% | -0.07% | -0.37% | -0.32% | -0.96% | |
| NZD | -0.80% | 0.09% | 0.35% | 0.24% | 0.04% | 0.32% | -0.57% | |
| CHF | -0.22% | 0.65% | 0.91% | 0.80% | 0.59% | 0.96% | 0.57% |
The heat map shows percentage changes of major currencies against each other. The base currency is picked from the left column, while the quote currency is picked from the top row. For example, if you pick the US Dollar from the left column and move along the horizontal line to the Japanese Yen, the percentage change displayed in the box will represent USD (base)/JPY (quote).
추천 기사


