


Japanese Yen weakens further against US Dollar as hawkish Fed bets dominate
- The Japanese Yen underperforms the US Dollar as Fed officials warn of persistent inflation risks.
- Hopes of US-Iran diplomacy weigh on oil prices.
- Japan is expected to intervene to support the currency.
The Japanese Yen (JPY) continues to underperform against the US Dollar (USD), with the USD/JPY pair trading 0.2% higher to near 157.70 during the European session on Wednesday. The pair trades higher due to continued outperformance by the US Dollar.
In early European trade, the US Dollar Index (DXY), which gauges the Greenback’s value against six major currencies, posts a fresh seven-week high at around 100.76.
Fed rhetoric keeps Dollar bulls on the front foot
Brown Brothers Harriman’s (BBH) Elias Haddad highlights that Federal Reserve (Fed) officials are reinforcing the prospect of additional tightening, underscoring the bank’s constructive view on the Dollar. BBH notes that St. Louis Fed President Alberto Musalem, a non-voter this year, cautioned that “further rate hikes may be needed to curb inflation,” while Chicago Fed President Austan Goolsbee, a 2027 voter, warned that policy could turn “more aggressive and more and more front-loaded” if demand is judged to be overheating. According to BBH, this combination of hawkish guidance from both current and future FOMC participants helps sustain the perception that “more tightening is in the pipeline,” supporting the US growth and yield advantage versus the Euro, Pound and Yen.
The US Dollar remains firm even as a significant decline in oil prices due to United States (US)-Iran diplomacy hopes has eased fears of high inflation expectations. The WTI Oil price has fallen over 13% from its recent high of $102.11 to below $89.00.
On the Tokyo front, financial markets expect Japan to intervene soon to support its currency, which has been under pressure since the Bank of Japan’s (BoJ) monetary policy announcement.
Japan’s two-pronged BoJ and MoF strategy unsettles Yen positioning
Analysts at Societe Generale note that the latest moves in USD/JPY have highlighted Japan’s evolving policy mix, with “spot rate checks by the MoF late on Friday” coming on the heels of “the rate increase by the BoJ earlier in the day.” They argue this combination “underlined the two-pronged policy approach in Japan where intervention is obfuscating the price action and wrongfooting tactical investors.” Positioning data underscore the impact: Societe Generale points out that “HF positions are under water after turning net long Yen 22% of OI last Tuesday,” while “Mrs Watanabe (retail) is in the money.” They add that “CFTC positions (pre-FOMC): JPY longs jumped to 22.2% OI from 2.2%,” illustrating how swiftly speculative exposure has swung toward the Yen even as official actions complicate the trading landscape.
USD/JPY Technical Analysis
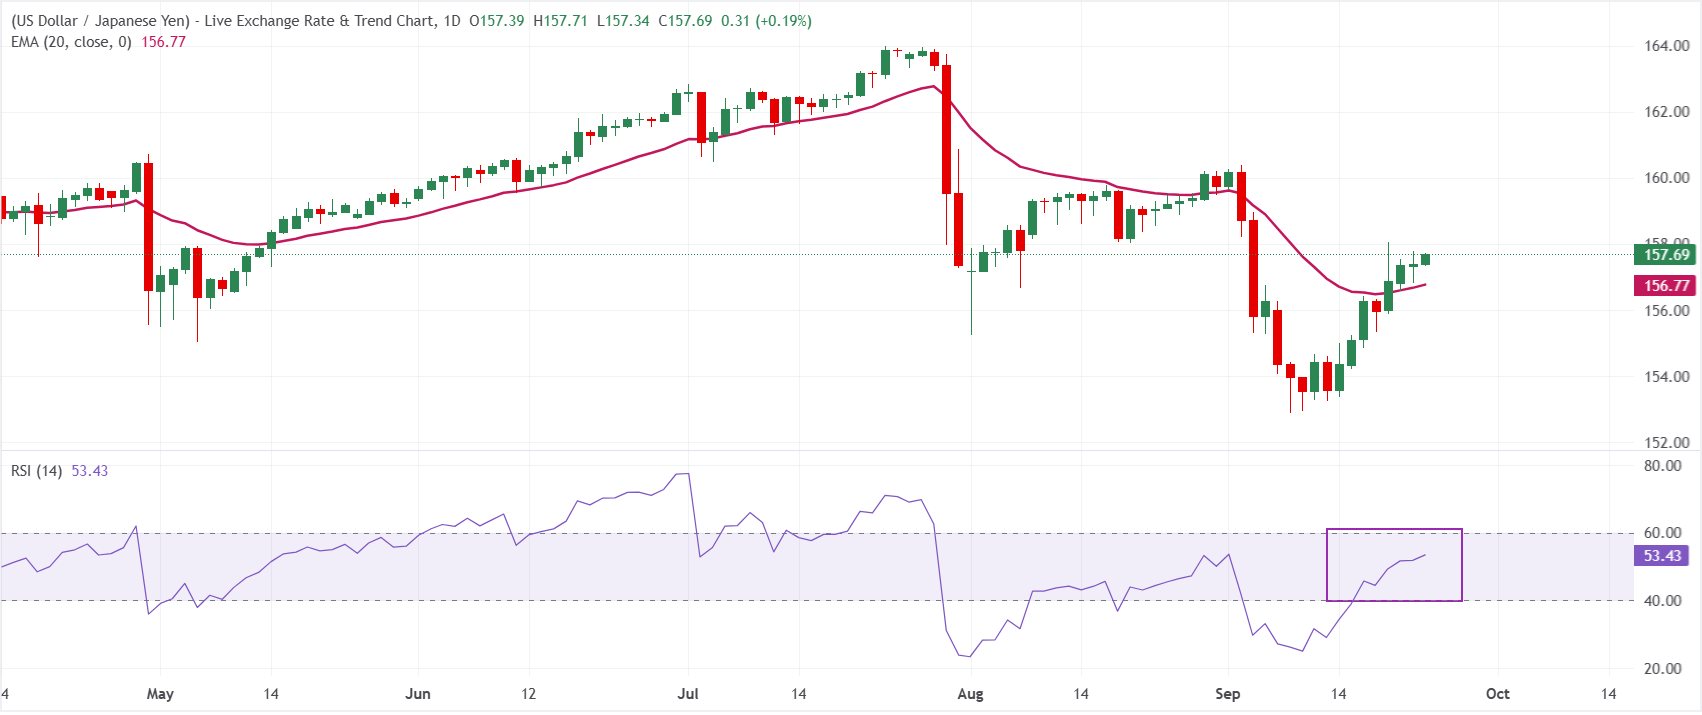
In the daily chart, USD/JPY trades at 157.70. The pair holds above the 20-period exponential moving average (EMA) at 156.77, which underpins a mildly bullish near-term bias as price consolidates near recent highs. The Relative Strength Index (14) at 53.44 sits in neutral-positive territory, suggesting steady but not overstretched upside momentum while the spot remains supported by the short-term trend line defined by the 20-EMA.
On the downside, initial support is seen at the 157.70 area as an immediate pivot, followed by the 20-day EMA at 156.77, where buyers could look to defend the broader uptrend. With no nearby technical resistance levels from the provided dataset, traders may monitor psychological round numbers and recent swing highs beyond the current price for potential caps, while a sustained break below 156.77 would hint at a deeper corrective phase.
(The technical analysis of this story was written with the help of an AI tool. Know more.)
Inflation FAQs
Inflation measures the rise in the price of a representative basket of goods and services. Headline inflation is usually expressed as a percentage change on a month-on-month (MoM) and year-on-year (YoY) basis. Core inflation excludes more volatile elements such as food and fuel which can fluctuate because of geopolitical and seasonal factors. Core inflation is the figure economists focus on and is the level targeted by central banks, which are mandated to keep inflation at a manageable level, usually around 2%.
The Consumer Price Index (CPI) measures the change in prices of a basket of goods and services over a period of time. It is usually expressed as a percentage change on a month-on-month (MoM) and year-on-year (YoY) basis. Core CPI is the figure targeted by central banks as it excludes volatile food and fuel inputs. When Core CPI rises above 2% it usually results in higher interest rates and vice versa when it falls below 2%. Since higher interest rates are positive for a currency, higher inflation usually results in a stronger currency. The opposite is true when inflation falls.
Although it may seem counter-intuitive, high inflation in a country pushes up the value of its currency and vice versa for lower inflation. This is because the central bank will normally raise interest rates to combat the higher inflation, which attract more global capital inflows from investors looking for a lucrative place to park their money.
Formerly, Gold was the asset investors turned to in times of high inflation because it preserved its value, and whilst investors will often still buy Gold for its safe-haven properties in times of extreme market turmoil, this is not the case most of the time. This is because when inflation is high, central banks will put up interest rates to combat it. Higher interest rates are negative for Gold because they increase the opportunity-cost of holding Gold vis-a-vis an interest-bearing asset or placing the money in a cash deposit account. On the flipside, lower inflation tends to be positive for Gold as it brings interest rates down, making the bright metal a more viable investment alternative.
추천 기사


