


USD/CAD Price Forecast: Eyes 50-day EMA after breaking above confluence around 1.3900
- USD/CAD may find immediate resistance at the 50-day EMA of 1.3949.
- The 14-day Relative Strength Index hovers near 51, signaling balanced market momentum.
- The primary support lies at the nine-day EMA of 1.3882.
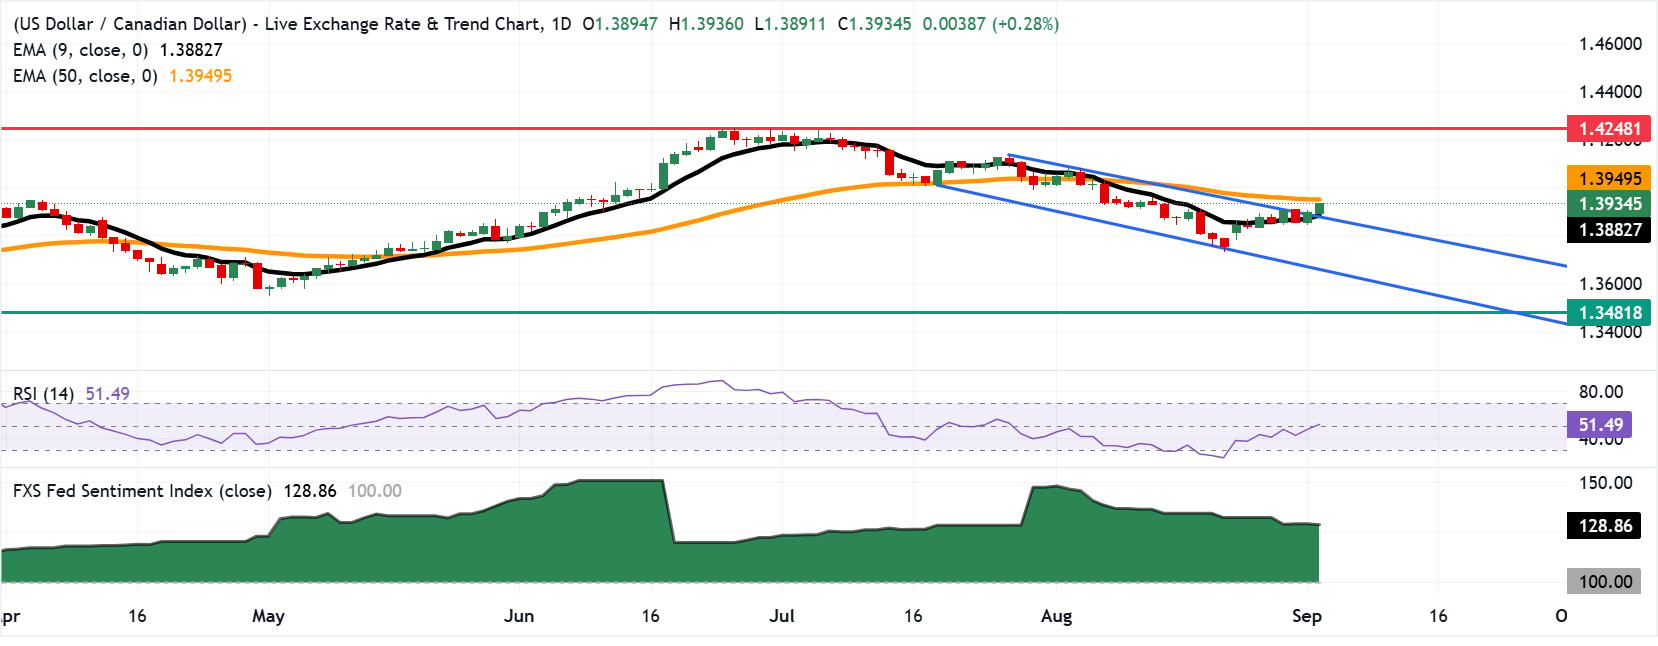
USD/CAD extends its gains for the second consecutive day. trading around 1.3940 during the European hours on Wednesday. The technical analysis of the daily chart indicates the pair is positioned above the descending channel top, signalling a bullish reversal.
The USD/CAD is consolidating in a neutral near-term bias as it holds above the short-term nine-day Exponential Moving Average (EMA) but remains capped by the 50-day EMA. This split structure suggests the pair is stabilizing after recent weakness, with the 14-day Relative Strength Index (RSI) hovering around 51 and hinting at balanced momentum rather than a clear directional impulse.
The USD/CAD pair may test the immediate resistance at the 50-day EMA of 1.3949. A break above the medium-term price average would strengthen the bullish bias and support the pair to explore the region around the nearly 17-month high of 1.4248, which was recorded on June 24, 2026.
On the downside, the primary support lies at the nine-day EMA of 1.3882. A pullback toward the descending channel could revive the bearish bias and put downward pressure on the USD/CAD pair to test the descending channel bottom around 1.3670. A break below the channel would open the doors for the pair to navigate the region around 1.3481, the lowest since October 2024.
Barr flags risk of renewed hikes as inflation stays too high
Barr’s latest remarks register slightly more hawkish than the established baseline, with a 7/10 FXS Speechtracker score versus a 6.8/10 historical average, as the emphasis on “inflation remains too high” and the risk of further tightening dominates the tone. The conditional stance—favoring steady rates only if there is confidence inflation is moderating, but warning that a lack of progress would warrant an interest rate hike—keeps a clear tightening bias in play even as Barr acknowledges a stable labor market and “solid” growth supported by artificial intelligence investment. Overall, the message reinforces upside risks to rates and supports the Dollar on balance, especially if incoming data fail to confirm disinflation.
The FXS Fed Sentiment Index slipped by 0.42 points to 128.86, signaling a modest pullback in perceived hawkishness despite remaining firmly above the neutral 100 mark. This configuration suggests that while the broader Fed tone captured by the FXS Fed Sentiment Index has eased slightly, it still resides in clearly hawkish territory, consistent with Barr’s conditional tightening bias reflected in the FXS Speechtracker score.
(The technical analysis of this story was written with the help of an AI tool. Know more.)
Canadian Dollar Price Today
The table below shows the percentage change of Canadian Dollar (CAD) against listed major currencies today. Canadian Dollar was the weakest against the Japanese Yen.
| USD | EUR | GBP | JPY | CAD | AUD | NZD | CHF | |
|---|---|---|---|---|---|---|---|---|
| USD | 0.16% | 0.11% | -0.21% | 0.30% | 0.24% | 1.42% | 0.38% | |
| EUR | -0.16% | -0.07% | -0.35% | 0.16% | 0.08% | 1.23% | 0.22% | |
| GBP | -0.11% | 0.07% | -0.28% | 0.22% | 0.13% | 1.27% | 0.28% | |
| JPY | 0.21% | 0.35% | 0.28% | 0.49% | 0.43% | 1.58% | 0.57% | |
| CAD | -0.30% | -0.16% | -0.22% | -0.49% | -0.06% | 1.09% | 0.08% | |
| AUD | -0.24% | -0.08% | -0.13% | -0.43% | 0.06% | 1.15% | 0.16% | |
| NZD | -1.42% | -1.23% | -1.27% | -1.58% | -1.09% | -1.15% | -0.99% | |
| CHF | -0.38% | -0.22% | -0.28% | -0.57% | -0.08% | -0.16% | 0.99% |
The heat map shows percentage changes of major currencies against each other. The base currency is picked from the left column, while the quote currency is picked from the top row. For example, if you pick the Canadian Dollar from the left column and move along the horizontal line to the US Dollar, the percentage change displayed in the box will represent CAD (base)/USD (quote).
추천 기사


