


Tesla Shares Rebound After Falling to Two-Month Low, May Retest $400 Mark if $350 Holds
TradingKey - Tesla (TSLA) shares staged a noticeable rebound after consecutive pullbacks. In the latest trading session, the stock dipped to as low as $347.60 before buying interest returned, ultimately rising 4.23% to $358.22 and temporarily pulling away from its recent nearly two-month low. However, with its cumulative decline over the past week still exceeding 10%, this recovery is closer to a technical bounce from oversold levels; whether it can evolve into a fresh rally still hinges on whether the $350 support holds firm.
Just as market sentiment turned cautious, Cathie Wood chose to increase her holdings against the trend. She stated that ARK is capitalizing on pullbacks in Tesla and SpaceX shares to expand its positions, as both companies remain its highest-conviction long-term investments. Public trading disclosures show that ARK's funds recently bought a total of approximately 35,300 Tesla shares while adding about 455,000 shares of SpaceX. Wood believes that Tesla's Robotaxi business has entered an accelerated deployment phase, and the current pullback instead offers an opportunity to reposition.
This view is not entirely without operational support. Tesla previously disclosed that Cybercab has begun joining the Austin Robotaxi fleet, with cumulative autonomous test mileage nearing 2 million miles as of the end of the third quarter. As fleet size expands and dispatch efficiency improves, whether Robotaxi can transition from pilot operations to broader commercialization will directly impact market assessments of Tesla's long-term valuation.
Source: TradingView
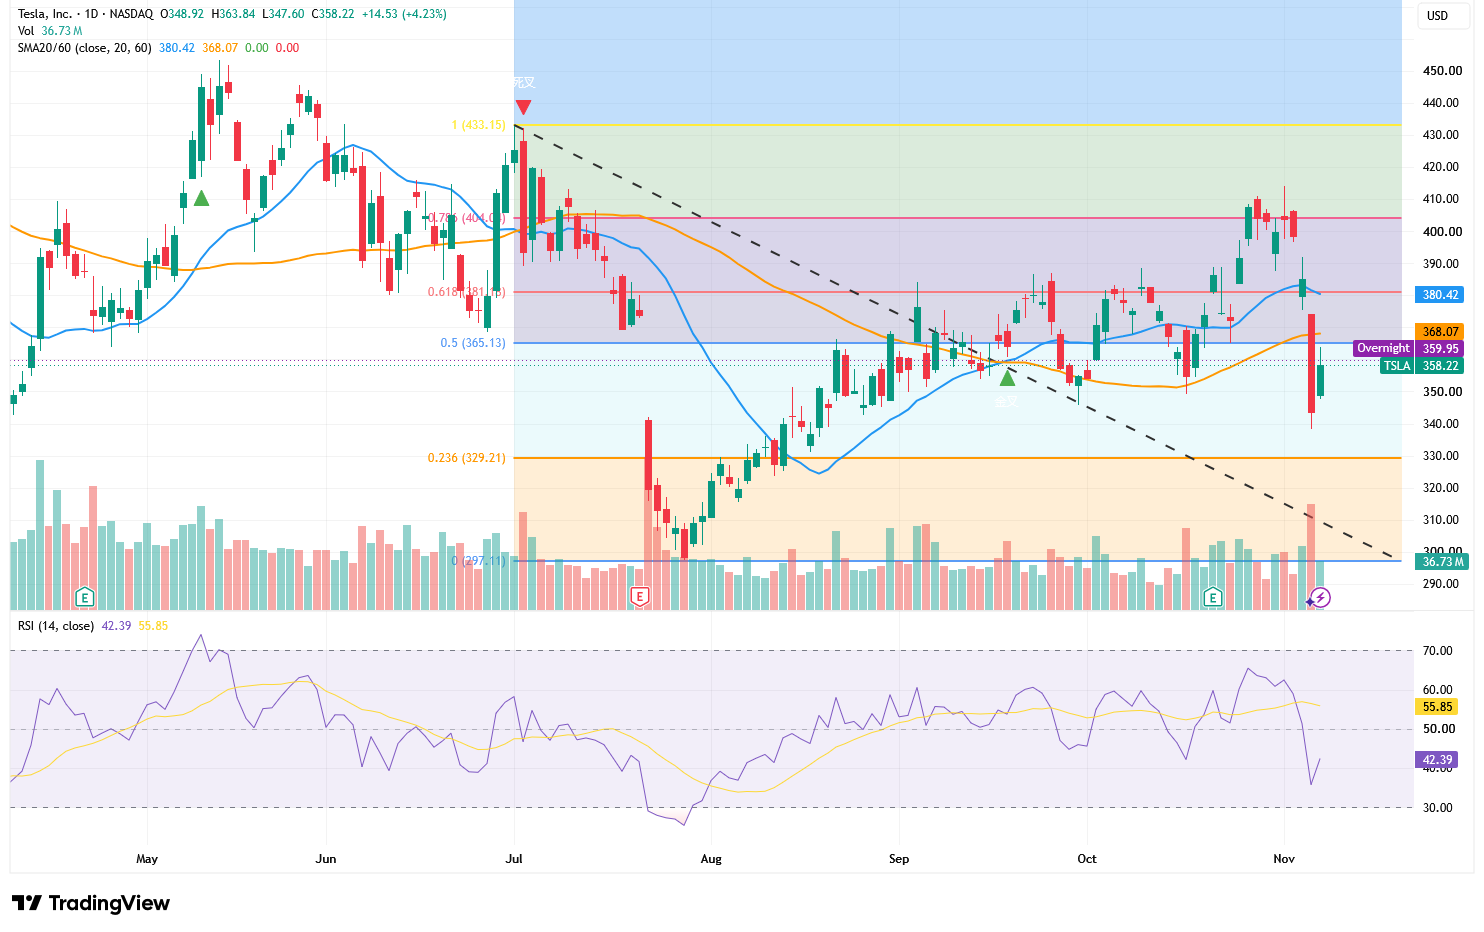
Tesla shares rebounded after briefly dipping near $338, rising 4.23% in the latest session to close at $358.22 and reclaiming $350. This area represents both a recent dense trading zone and a core battleground between short-term bulls and bears; the swift reclaim indicates that underlying buying support exists at lower levels.
However, the current stock price remains below both the 60-day moving average of $368.07 and the 20-day moving average of $380.42, indicating that the rebound has not yet reversed the short-term weakness. The 0.5 Fibonacci retracement level of $365.13 and the 60-day moving average form the first layer of resistance. If the stock can break above $365–$368 on expanding volume, the next target will be $380–$381. Only a further breakout above this zone would meaningfully repair the downtrend structure, opening the door for the stock to challenge the $400–$404 resistance band.
The RSI has currently rebounded to 42.39, but remains below the 50 neutral threshold and the signal line at 55.85, reflecting that while buying momentum has somewhat recovered, it has yet to regain dominance. Meanwhile, trading volume expanded notably during the previous decline, whereas volume during this rebound has been relatively limited, indicating that the market still requires clearer signals of stabilization.
To the downside, watch the $350 support level first. If the daily chart closes below $350 again, this rally may merely be a brief oversold bounce, and the stock could retest its recent low of $338; if that level is breached, attention will turn to the 0.236 Fibonacci level at $329.21.
Recommended Articles


