


GE Vernova Stock Forecast: $9 Billion Trench Deal Puts $949 Breakout in Focus
TradingKey - GE Vernova (NYSE: GEV) closed November 3 at $918.20, gaining 6.49%, according to MarketWatch’s report. That is the latest completed session heading into November 4. Stronger earnings and the proposed $9 billion Trench acquisition support its electricity-infrastructure growth story, but the rebound still faces overhead resistance.
My fundamental view is constructive. The trading question is whether buyers can reclaim $949.31 while management converts exceptional demand into sustainable margins and cash returns.
Trench Expands the Grid Opportunity
GE Vernova’s acquisition announcement sets a roughly $9 billion equivalent price for Trench, funded equally with cash and debt. Announced October 28, the transaction is expected to close in late 2027, subject to approvals. Trench supplies high-voltage bushings, instrument transformers and coils, extending GE Vernova’s existing grid capabilities.
Trench projects approximately $1.9 billion in 2028 revenue and a 36% adjusted EBITDA margin. Those are forecasts, not current earnings. I see strategic value in securing a supplier and expanding capacity, but financing costs and integration will determine whether attractive product margins translate into shareholder returns.
Operating Growth Matters More Than Headline EPS
The quarterly filing reports third-quarter revenue of $12.64 billion and diluted EPS of $4.81, versus $1.64 a year earlier. Operating income increased to $1.39 billion from $366 million. This provides stronger evidence of business improvement than EPS alone.
Importantly, year-to-date earnings include a non-taxable Prolec GE acquisition gain. That should not be confused with recurring third-quarter profit. Pricing, productivity and delivery execution are the measures I would emphasize when assessing the durability of earnings growth.
Backlog Provides Visibility, Not Guaranteed Revenue
The earnings release shows $29.3 billion in quarterly orders, up 96% organically, and approximately $197 billion in backlog. Gas equipment backlog and slot reservations totaled 122 gigawatts, with management targeting at least 130 gigawatts by year-end.
What catches my attention is the scale of future delivery commitments. Reservations and firm orders represent different commercial stages, and neither equals recognized revenue. The bullish case requires manufacturing capacity to expand without eroding contract profitability. A large backlog can amplify execution problems as easily as it supports visibility.
Higher Guidance Requires Cash-Flow Discipline
Management’s results update raises 2026 revenue guidance to $46.5 billion–$47.5 billion, adjusted EBITDA margin to 13.5%–14.5%, and free cash flow to $16 billion–$17 billion. These remain forecasts, with the latter two measures presented on a non-GAAP basis.
The cash-flow discussion identifies customer down payments and slot-reservation receipts as major funding sources. Those collections support liquidity before manufacturing and delivery obligations are fulfilled. For me, the critical test is cash retained across the full contract cycle, not simply cash received upfront.
Wind Losses Keep the Recovery Uneven
The segment outlook anticipates $400 million–$500 million in Wind EBITDA losses for 2026, compared with approximately $400 million previously. Electrification’s quarterly orders also declined 9% organically against a demanding comparison, despite strong grid demand.
These weaknesses temper the broader growth story. I would become more cautious if Wind consumes additional resources while grid deliveries or margins disappoint. The Trench transaction increases the importance of disciplined capital allocation across the portfolio.
The Next Catalyst Is Delivery Against Expectations
The company’s events calendar lists its fourth-quarter earnings webcast for January 27, 2027. Before then, order conversion, capacity expansion and progress toward year-end commitments remain the operating indicators to watch. The Trench agreement is an October announcement, not a newly disclosed November 4 catalyst.
My focus is whether stronger demand produces better underlying profitability. Further order wins would support confidence; delivery delays, weaker margins or less durable cash generation would challenge the thesis.
GE Vernova Technical Analysis: $949.31 Is the Recovery Test
GE Vernova’s latest completed close of $918.20 leaves the daily rebound below the supplied chart’s moving averages and descending trendline. What catches my attention is the strength of the recovery without a confirmed trend reversal. Buyers have regained momentum, but overhead supply remains the immediate obstacle.
The first test is the 50-day EMA at $934.25, followed by the $948.51–$949.31 resistance zone. I would want a daily close above $949.31 before adopting a bullish recovery bias, with $1,029.92 the next supplied upside objective. An intraday push into resistance would provide weaker confirmation.
RSI at 50.78 signals improving, neutral momentum rather than overbought conditions. MACD’s marginal bullish crossover below zero supports stabilization, although it does not establish a durable uptrend. Initial support stands at $867.50. A daily close below that level would undermine the rebound and expose $796.52, where the recent selloff found buyers. I remain neutral between support and resistance, favoring confirmation over chasing the sharp advance.
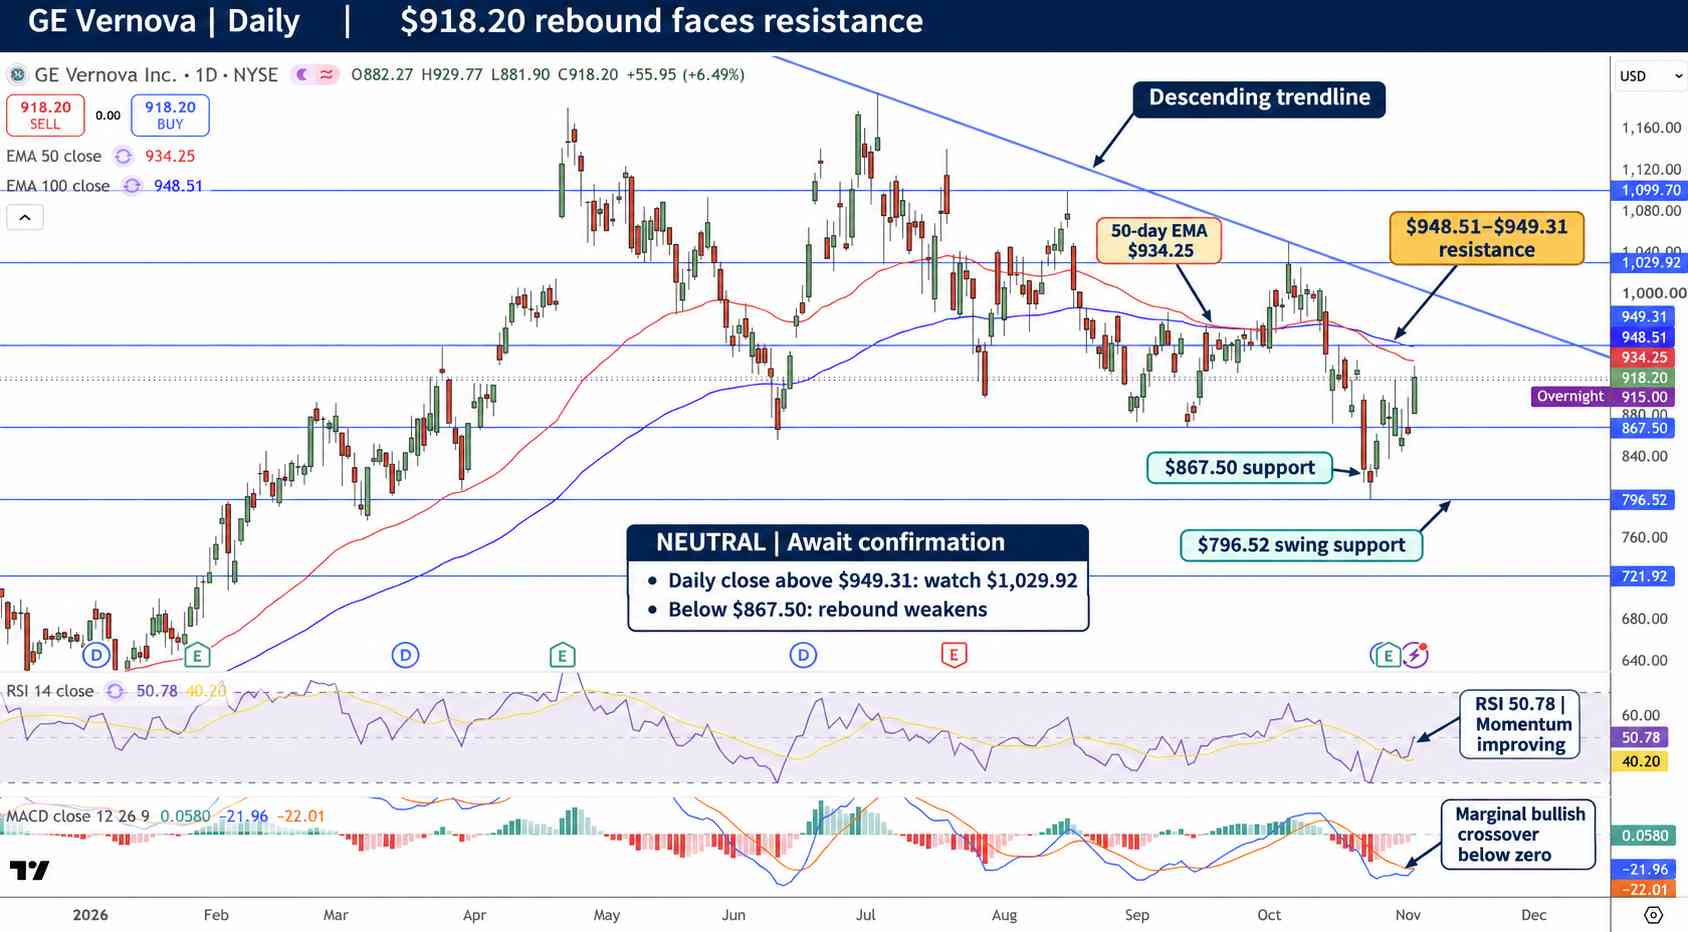
GEV Price Chart - Source: Tradingview
Key Levels
- Latest completed close: $918.20 on November 3, 2026
- Immediate resistance: $934.25; then $948.51–$949.31
- Upside target: $1,029.92 after a daily close above $949.31
- Immediate support: $867.50
- Downside target: $796.52 below $867.50
- RSI status: 50.78, neutral with improving momentum
FAQ
Why is GE Vernova stock in focus?
Stronger earnings, substantial order visibility and the proposed Trench acquisition strengthen its grid-growth strategy. Delivery execution and cash quality remain the central tests.
What would confirm further GEV upside?
A daily close above $949.31 would confirm the supplied recovery setup and bring $1,029.92 into focus. A close below $867.50 would undermine that view.
Bottom Line
I remain constructive on GE Vernova’s grid opportunity, but neutral on the chart until a daily close above $949.31. Acquisition execution and advance-funded cash generation are the main fundamental risks. Below $867.50, the recovery thesis weakens and $796.52 becomes the next downside test.
Recommended Articles


