

META Stock Price Forecast: JPMorgan Raises Price Target to $940, Sees Over 50% Upside

Source Tradingkey

TradingKey - Meta (META) shares have continued to weaken recently. As of the close on October 28 US Eastern Time, the stock fell for the fifth consecutive trading day, with a cumulative decline of over 12%. Amid the pullback, JPMorgan recently further raised its price target on Meta to $940, indicating that the institution maintains relatively positive expectations for the growth of its advertising business and AI products. However, the current stock price trend has not yet shown clear signs of bottoming out.

JPMorgan Raises Meta Price Target to $940, Remains Bullish on AI and Advertising Business

JPMorgan analyst Doug Anmuth raised Meta's price target to $940 from $920 and maintained an "Overweight" rating. Based on the closing price of $620.19 on October 27, the new price target implies a potential upside of approximately 52%. JPMorgan noted that Meta delivered strong third-quarter revenue, operating profit, and adjusted earnings, while the high end of its fourth-quarter revenue guidance of $73 billion to $76 billion was about $1 billion above the bank's previous expectation.

JPMorgan highlighted that Meta's core advertising business maintained rapid growth, with AI advertising tools and video business supporting ad conversion rates, pricing, and revenue growth. Meanwhile, its personal AI assistant Muse surpassed 10 million users after launching in the US and Canada, with approximately 25% of users using it daily, while products such as Muse Wonder, Meta Model API, and Muse Code have also begun to demonstrate early usage demand. On the other hand, Meta's capital expenditures this year are projected to reach $135 billion to $145 billion, reflecting a continued high level of AI infrastructure investment; therefore, the market will remain focused on whether these investments can gradually translate into revenue and cash flow growth.

Meta Stock Technical Analysis
meta-96175a432c0d4f93836b5bad40af2b0f

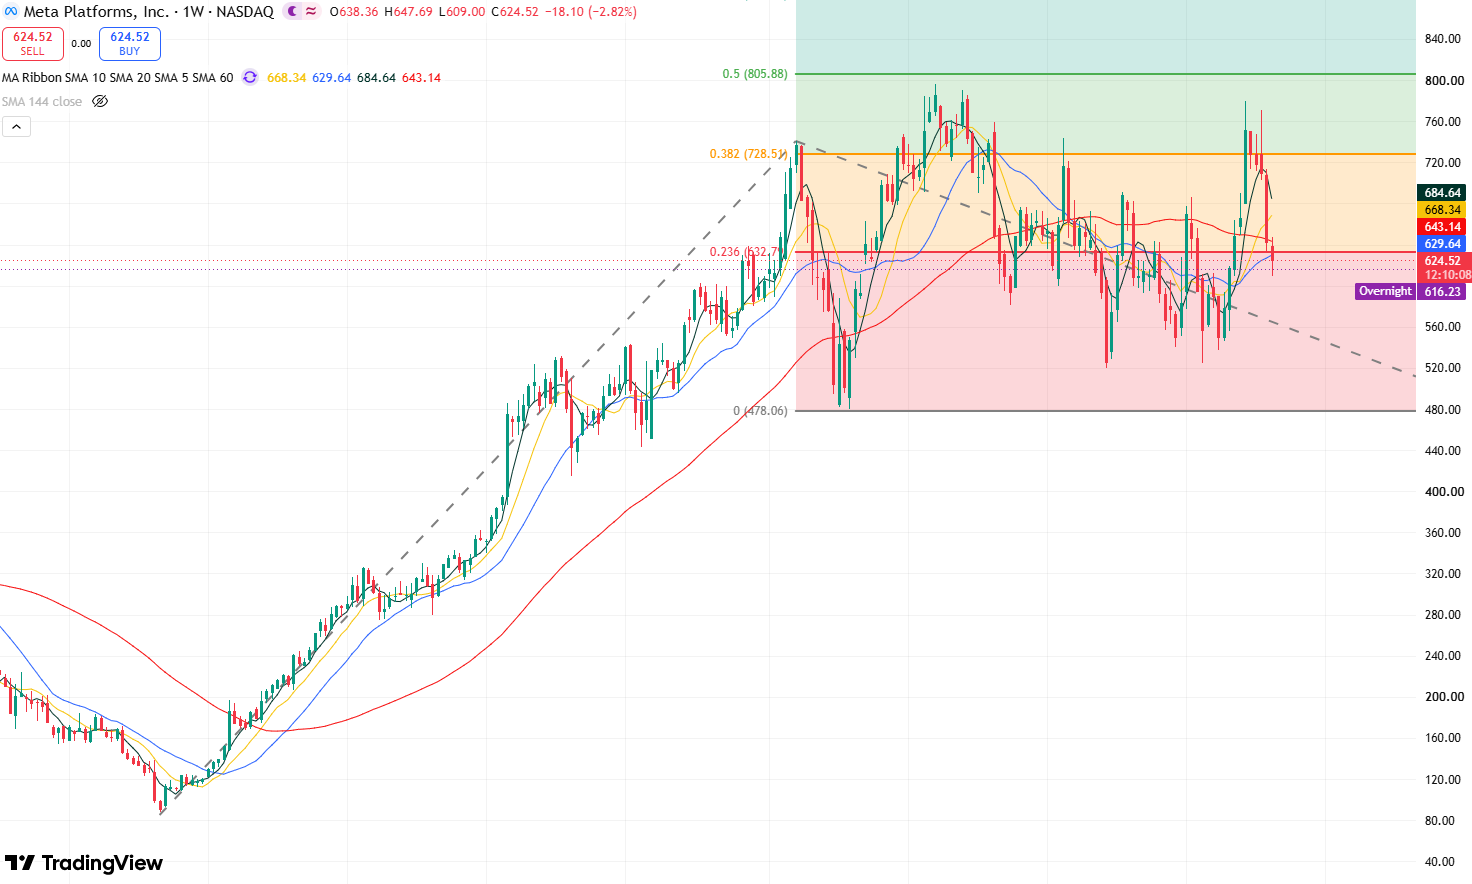
META stock weekly chart, Source: TradingView

From the weekly chart of META's stock price, the shares have weakened for the fifth consecutive week and broken below the 5-day, 10-day, 20-day, and 60-day moving averages, indicating a clear softening in overall momentum. However, the price has not yet broken below the 144-day moving average, suggesting that the long-term bullish trend remains intact.

Currently, the stock's overall price action reflects a high-level consolidation after failing to break through resistance at $800 on a renewed attempt, with $525 and $800 defining the bounds of the range. The price has pulled back to above the 144-day moving average; if signals of stabilization emerge at this moving average, the stock remains poised to test the $800 mark again in the short to medium term.

Conversely, if the stock breaks below the 144-day moving average, it may open up downside room toward $525. If this level fails to hold, the price could experience a deeper pullback toward $500–$478.

Disclaimer: For information purposes only. Past performance is not indicative of future results.
placeholder
Anthropic files for a $2 trillion IPO — the $80.7 billion loss is the decoy, the $450 billion compute bill is the riskAnthropic publicly filed its S-1 on October 26, revealing $16.29 billion of first-half revenue (+1,304% year over year) and a $80.7 billion net loss — of which $72.4 billion is a non-cash convertible-note charge. The real number is the $450 billion of signed, mostly non-cancelable compute commitments. Here is what the filing says, why NVDA, ARM and MU are the tradeable read-through, and the conditions that decide whether the AI trade passes its first public valuation test.
Author  Irene Q.
Oct 27, Tue
Anthropic publicly filed its S-1 on October 26, revealing $16.29 billion of first-half revenue (+1,304% year over year) and a $80.7 billion net loss — of which $72.4 billion is a non-cash convertible-note charge. The real number is the $450 billion of signed, mostly non-cancelable compute commitments. Here is what the filing says, why NVDA, ARM and MU are the tradeable read-through, and the conditions that decide whether the AI trade passes its first public valuation test.
placeholder
Brent's $115 front month sits $4.6 above January — the $14 spread to WTI is the supply-risk premiumDecember Brent trades at $115.29 while January is $110.71, a $4.58 backwardation. The December Brent-WTI spread is $14.2, versus a $3-5 normal. That gap, not the headline, is where the Middle East supply risk is priced. Here is what the curve says, why the December contract's expiry on October 30 will mechanically cut the headline by $4.6, and the 108.81 neckline that decides the next move.
Author  Irene Q.
Oct 28, Wed
December Brent trades at $115.29 while January is $110.71, a $4.58 backwardation. The December Brent-WTI spread is $14.2, versus a $3-5 normal. That gap, not the headline, is where the Middle East supply risk is priced. Here is what the curve says, why the December contract's expiry on October 30 will mechanically cut the headline by $4.6, and the 108.81 neckline that decides the next move.
placeholder
The Fed held at 3.75%–4.00% — and two officials voted to hike. December is now 85% pricedThe FOMC held by a 10–2 vote, with Governor Cook and Cleveland Fed President Hammack dissenting for a 25bp hike. Chair Warsh offered no forward guidance and no dot plot, the 2-year yield fell 8bp to 4.70%, and the dollar slipped to 101.84 even as markets moved December hike odds to 85%–87%. Tonight's Q3 GDP and September core PCE are the next referee.
Author  Irene Q.
Oct 29, Thu
The FOMC held by a 10–2 vote, with Governor Cook and Cleveland Fed President Hammack dissenting for a 25bp hike. Chair Warsh offered no forward guidance and no dot plot, the 2-year yield fell 8bp to 4.70%, and the dollar slipped to 101.84 even as markets moved December hike odds to 85%–87%. Tonight's Q3 GDP and September core PCE are the next referee.
placeholder
Gold Price Analysis Today | Forex Gold Analysis | XAU/USD Analysis - October 30, 2026Get the latest gold price analysis, forex gold insights, and XAU/USD analysis for October 30, 2026. Read on for the details.
Author  Mitrade
Oct 30, Fri
Get the latest gold price analysis, forex gold insights, and XAU/USD analysis for October 30, 2026. Read on for the details.
placeholder
US GDP grew 3.4% and core PCE held at 3.1% — December is now a hike trade, not a cut tradeUS Q3 GDP rose 3.4%, above the 3.1% estimate, while September headline PCE hit 3.6% and core held at 3.1%. December hike odds are near 90%; inventories, AI capex and energy explain why.
Author  Irene Q.
Oct 30, Fri
US Q3 GDP rose 3.4%, above the 3.1% estimate, while September headline PCE hit 3.6% and core held at 3.1%. December hike odds are near 90%; inventories, AI capex and energy explain why.
goTop
quote