


Lam Research Stock Forecast: Record Quarter Fails to Stop a Premarket Slide Below $242.80 Support
TradingKey - Lam Research (NASDAQ: LRCX) closed at $260.81 on Wednesday, October 21, down 1.00%. The stock lost around 7% in after-hours trading on its fiscal first-quarter report. Pre-market quotes were around $240.07, putting the stock below $242.80 support.
Lam Research reported record revenues and margins and EPS for the quarter and gave a positive first outlook for 2027 industry spending. The selling was for more immediate reasons: a narrow beat, December guidance, and a sharp expected decline in China revenue, among others.
Q1 FY2027: Record Quarter, Narrow Beat
Revenues for the quarter grew 22% sequentially and 54% year over year to $8.22 billion from $8.13 billion expected, and non-GAAP EPS came in at $2.20, beating estimates in the range of $2.15 to $2.18. Non-GAAP gross and operating margins also came in at all time highs of 52.4% and 40.2% respectively.
Expectations were this high, that a beat of about $90 million on revenues and a few cents on EPS was not enough to excite the market.
Supply Constraints Capped the December Guide
Lam issued December quarter revenue guidance of $8.6 billion, plus or minus $400 million. That was slightly above the $8.54 billion consensus. The company sees non-GAAP EPS of $2.33, plus or minus $0.15. It expects a gross margin of 52.5% and an operating margin of 40.5%.
CFO Doug Bettinger said the revenue guidance was limited by "near-term supply chain constraints." Although that indicates the constraints were on the supply side, it shows that Lam cannot fulfill all orders this quarter.
China Share Set to Fall
Revenue from China was 35% of total revenue in the September quarter, up from 26% in the June quarter. Bettinger expects a "meaningfully" lower number from China for the December quarter, due to lower revenue from domestic Chinese customers. Part of the strength in September, therefore, came from a region that is expected to pull back in December. That makes the record quarter even less clean than the headline suggests.
NAND Jumped 40% as Memory Matched Foundry
Forty-six percent of revenue for systems came from foundry and the remaining 46% came from memory, which included non-volatile memory (NVM) at 26% and DRAM at 20%. The remaining 8% was from logic and other. NAND revenue grew approximately 40% from the prior quarter, as customers transitioned to 256 layers and above. Lam expects 2026 systems revenue to grow well over 40%, for the third year in a row outgrowing the market.
2027 WFE Outlook Tops $200 Billion
For 2026 Lam expects wafer fab equipment (WFE) spending in the mid-$150 billion range. It sees spending above $200 billion for 2027, led by DRAM, then high-end foundry logic and NAND. CEO Tim Archer said visibility is out to 2028, however, he was cautious, saying that clean-room space and component shortages will constrain industry's ability to meet end demand into 2027.
This is the gap the market is valuing. A $200 billion call did not stop the after-hours sell off, because the same constraints that cap 2027 are already limiting December.
Record Cash Flow Funds Buybacks
Free cash flow reached a record high of $3.24 billion. Lam spent about $1 billion on buybacks, paid $325 million in dividends, and increased cash on hand to $7.45 billion from $5.60 billion. Deferred revenue increased to $2.66 billion, and the authorization for buybacks remains at $3 billion.
Lam Research Technical Analysis: Daily Close Below $242.80 Could Open $199.29
LRCX has dropped to the bottom of the $260 to $279.75 demand zone on the daily chart and is currently pressing against the rising trendline from December. This trendline, along with the demand zone, has helped to recover the major sell offs in July and September. If price breaks below the demand zone, it is also likely to break below the current uptrend. The pre-market price at $240.07 would break the demand zone, trendline, and $242.80. Price is trading well below both moving averages at $302.18 and $304.23, which are both also curling over.
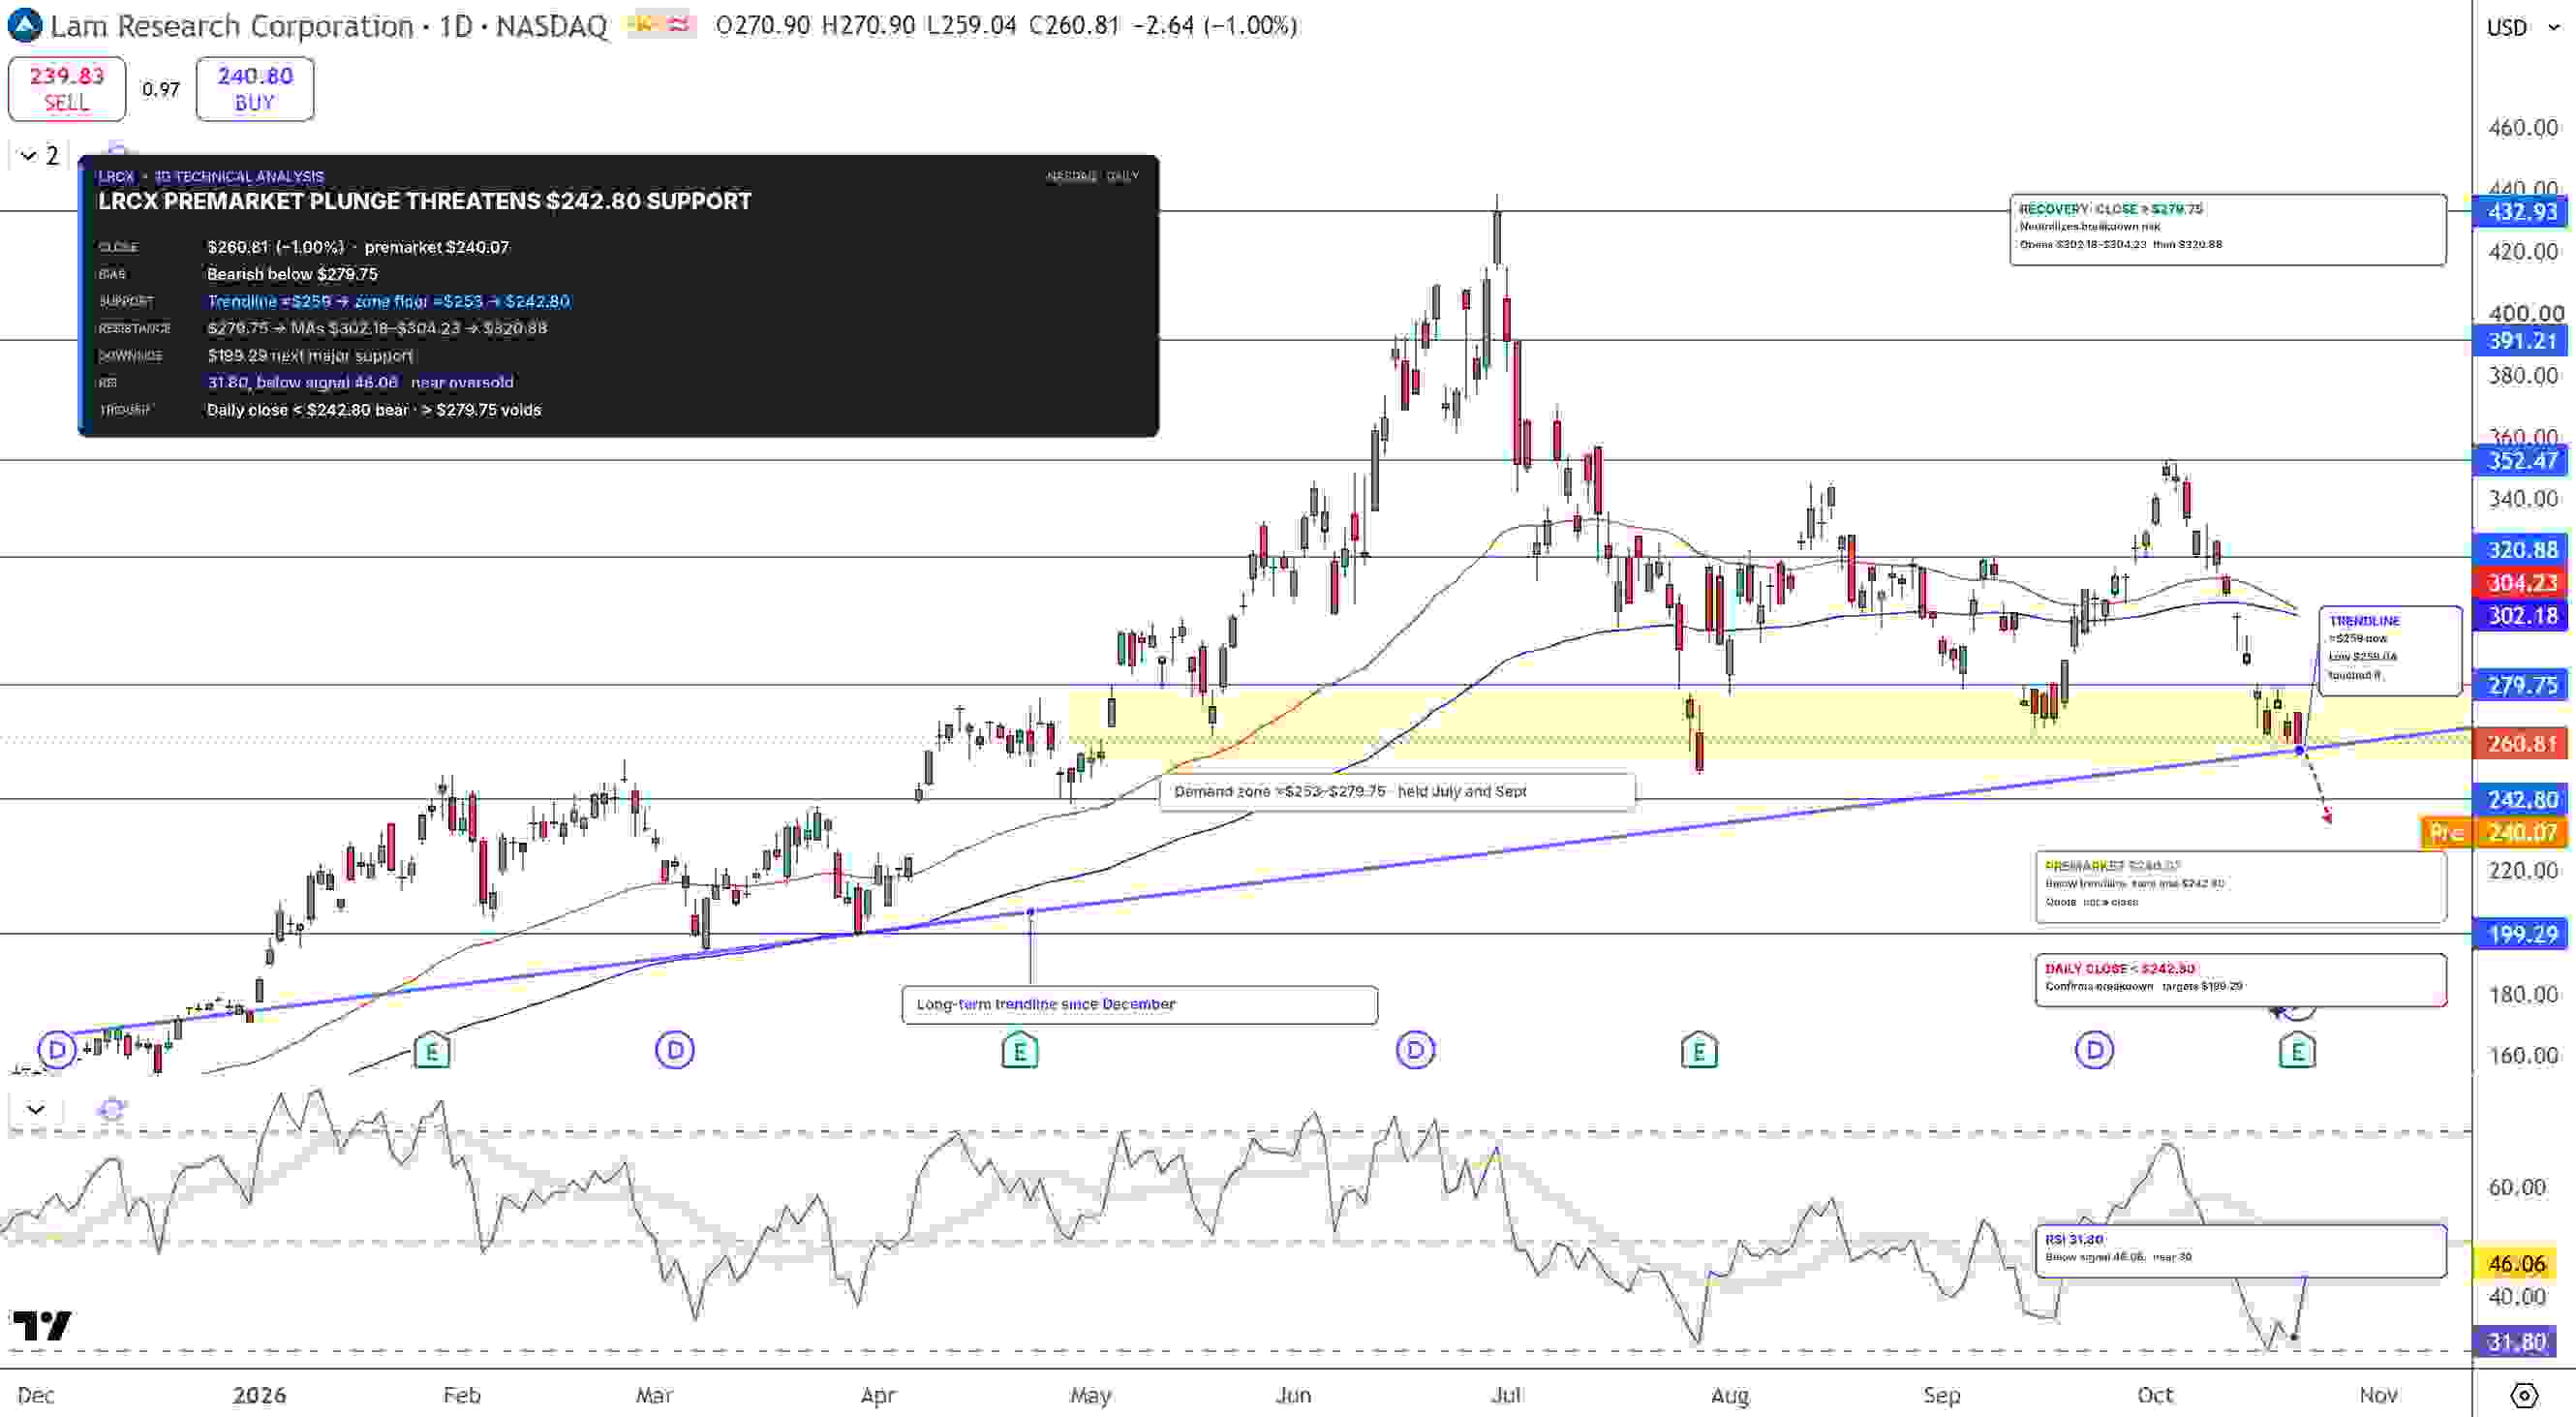
Lam Research Stock Price Chart - Source: Tradingview
RSI is at 32 and trending lower. If price breaks below the demand zone, it is likely to push RSI below 30. An RSI below 30 is typically seen as oversold. However, it usually does not indicate a bottom.
If an uptrend should occur, the first obstacle would be the top of the demand zone at $279.75. A daily close above this level would negate the break and open up the $302.18 and $304.23 moving averages. To the downside, a daily close below the $242.80 level with a confirmed break of the trendline would open $199.29.
I am bearish on LRCX as long as it is below the $279.75 demand zone.
Key Levels
Last close: $260.81, down 1.00% on October 21
Support: $242.80, $199.29
Resistance: $279.75, $302.18 to $304.23, $320.88
RSI: 31.80, below its 46.06 signal line
Bullish trigger: Daily close above $279.75
Bearish trigger: Daily close below $242.80
FAQs
Why is Lam Research stock falling after earnings?
Lam Research recorded a beat with revenue coming in at $8.22 billion. However, that beat was narrow as December revenue guidance came in at $8.6 billion, only slightly above the consensus due to supply constraints. On top of that, the management team expects revenue from China to drop substantially in the current quarter.
What is the Lam Research stock forecast after earnings?
Below $279.75, the bias is bearish. A daily close below $242.80 opens $199.29, and a daily close above $279.75 would open $302.18 to $304.23 and $320.88.
Bottom Line
Long-term demand story for Lam strengthened with the $200 billion WFE call for 2027. However, constraints on the supply side as well as a pullback from China in the current quarter limit the upside. Level to watch is $242.80, and in my opinion, a close below this level would open $199.29, and a close above $279.75 would open $302.18 and $304.23.
Recommended Articles


