


Natural Gas - Futures (NATGAS-F) Moved Sharply on Oct 23: Inventories, the Dollar, or Geopolitics?
Natural Gas - Futures (NATGAS-F) is up 13.65% at Oct 23 20:00(ET), now at $3.147, with a 7-day up of 1.22%.
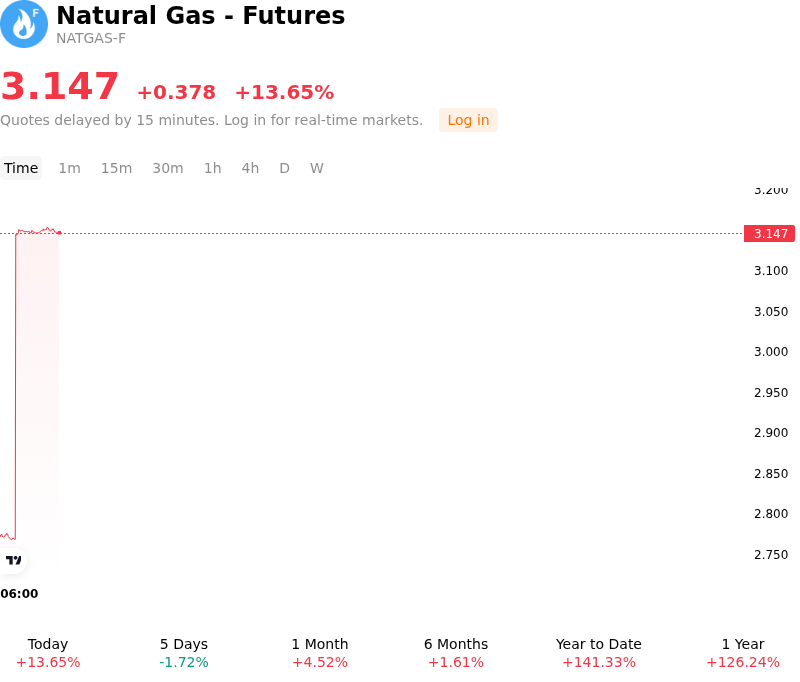
What is driving Natural Gas - Futures (NATGAS-F)’s stock price up today?
The sharp upward momentum in U.S. natural gas futures was primarily driven by tighter-than-expected supply-demand fundamentals and a bullish market reaction to weekly inventory data. The U.S. Energy Information Administration reported a smaller-than-anticipated injection into underground storage relative to historical standards, marking another consecutive week where storage builds trailed the five-year average. This under-performance significantly narrowed the broader inventory surplus heading into the traditional winter heating season, alleviating concerns over localized storage saturation and reinforcing a tighter market balance.
Supply-side developments further amplified the upward movement, as lower 48 dry gas production pulled back from record highs recorded in late summer. Recent force majeure notices, pipeline maintenance, and operational disruptions in key producing basins curtailed daily output levels. At the same time, feedgas intake at major U.S. liquefied natural gas export terminals remained robust, operating near maximum operational capacity. Elevated overseas benchmark prices across European and Asian gas markets sustained strong foreign demand for U.S. energy cargoes, preventing domestic supply from accumulating at Henry Hub hubs.
The magnitude of the price advance was additionally reinforced by aggressive institutional short-covering and technical buying. Having previously traded down toward multi-month lows on warm autumn weather forecasts, oversold market conditions left front-month futures vulnerable to a short squeeze once fundamentals showed signs of tightening. As traders re-evaluated winter risk premiums against early forecasts for mid-autumn cold fronts in key Midwest and Eastern heating zones, capital flows quickly pivoted from short positioning to defensive long coverage.
Technical Analysis of Natural Gas - Futures (NATGAS-F)
Technically, Natural Gas - Futures (NATGAS-F) shows a MACD (12,26,9) value of -0.065, indicating a neutral signal. The RSI at 54.261 suggests neutral condition and the Williams %R at 29.373 suggests buy condition. Please monitor closely.
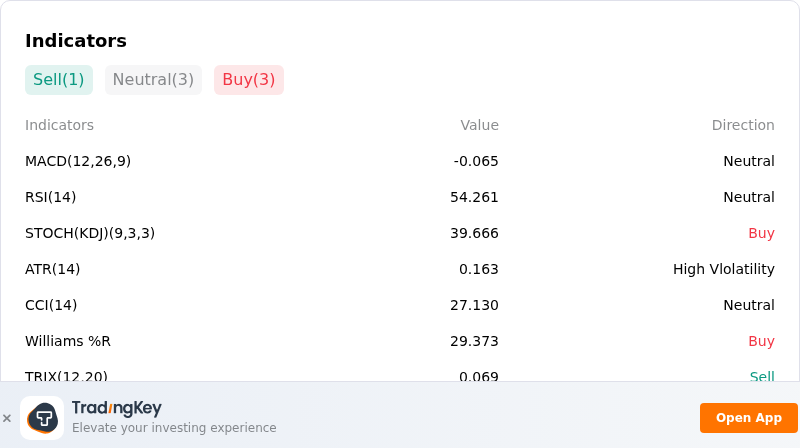
More details about Natural Gas - Futures (NATGAS-F)
Recent Events and Risks:
- Unusually Mild Autumn Weather Forecasts: Recent short- and medium-term weather model revisions indicate unseasonably mild temperatures across major U.S. heating regions through early November, reducing upcoming 15-day Total Degree Days to historical lows and delaying seasonal residential and commercial heating demand.
- Robust Domestic Dry Gas Production: U.S. Lower-48 dry gas production remains elevated at approximately 112.9 Bcf/d—up 5.3% year-over-year—maintaining strong physical supply into the domestic grid and reinforcing structural downside pressure during a period of weak consumption.
- Continued Weekly Inventory Accumulation: EIA natural gas storage reports confirmed a substantial weekly injection of up to 77–81 Bcf, keeping total Lower-48 working gas inventories above the five-year historical average and expanding national pre-winter storage levels toward 3.85 Tcf.
- Technical Support Breakdown and Long Liquidation: Front-month NYMEX natural gas futures broke below critical technical support levels near $2.80–$2.96/MMBtu to reach multi-week contract lows, accelerating algorithm-driven stop-loss selling and long-position unwinding across energy derivative markets.
Recommended Articles


