


Nvidia Stock Price Forecast: Jensen Huang Says AI Chip Demand Is Strong, Dan Ives Sees Selloff as Buying Opportunity; Can the Stock Return to an Uptrend?
TradingKey - On October 16 Eastern Time, against the backdrop of a 1.4% drop in the Nasdaq Composite Index, Nvidia (NVDA) stock price rose against the trend.
Although the semiconductor sector showed volatile performance this week, with investors weighing the pace of AI investments while harboring doubts about rising infrastructure costs and demand sustainability, Jensen Huang addressed market concerns on Thursday, pointing out that demand for AI computing infrastructure remains strong. He stated: "Nvidia receives AI chip orders from customers almost every day. We are constantly increasing supply, and order volumes continue to grow."
Earlier this week, strong financial results and optimistic outlooks released by TSMC and ASML also eased market concerns over a potential slowdown in AI chip demand.
Tech industry analyst Dan Ives believes the recent sell-off in the AI sector presents a buying opportunity for Nvidia. He maintained his "Outperform" rating and $300 price target on Nvidia, stating that demand for the company's AI chips remains strong, with supply capacity staying a more significant bottleneck than customer purchase intent.
Nvidia's preliminary outlook for fiscal year 2028 points to approximately 70% revenue growth, with supply expected to remain the main bottleneck during this period. Ives noted that a significant portion of demand is already backed by contracts, with related investments funded by cash flows generated by the large cloud computing companies themselves. This forms the basis for his continued bullish stance on Nvidia amid market concerns over borrowing costs and AI infrastructure financing.
Ives believes the market continues to underestimate Nvidia's advantage across the entire AI infrastructure landscape. Beyond GPUs, its business spans networking, complete computing systems, and the CUDA software platform, shaping how AI infrastructure is built and operated. He expects that as infrastructure buildout extends from training to inference, agentic AI, and robotics, Nvidia's share of every dollar in new infrastructure spending will continue to rise.
In addition, Nvidia released three brand-new "open-weight" Nemotron 3.5 AI models on Thursday, designed to support agentic AI applications. Developers can access the weight parameters of these models and configure them based on their specific application needs. This release further expands Nvidia's AI software portfolio. As AI agents become one of the target application directions for its infrastructure business, the company is also strengthening its market position beyond GPU hardware sales by offering models that developers can configure.
From a technical perspective, after the recent wave of pullback in AI tech stocks, Nvidia has fallen below its previous ascending channel and is trading below all five exponential moving averages. It is currently undergoing low-level consolidation following the channel breakdown, testing support at the 0.5 Fibonacci retracement level ($216), with no clear bottoming reversal formed yet. The intraday narrowing of losses indicates that the decline has temporarily paused.
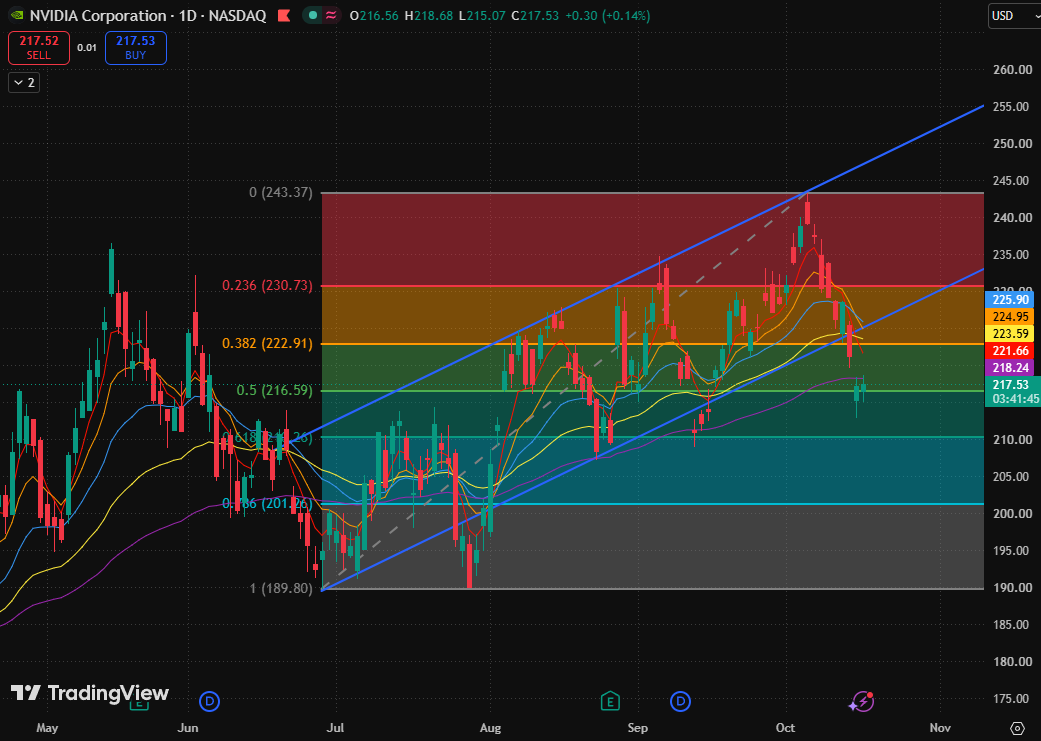
Nvidia daily chart, Source: TradingView
Structurally, the stock price had previously logged higher lows along the ascending channel. After reaching $243.37 in early October, it pulled back continuously and subsequently broke below the lower boundary of the channel. While the September pullback still found support at the edge of the channel, the price has now fallen outside it, indicating that the original upward momentum has been disrupted. Any subsequent rebound will first face pressure from repairing the breakdown.
Regarding moving averages, the 5-day, 10-day, and 20-day exponential moving averages stand at $221.52, $224.87, and $225.86, respectively, forming a bearish alignment in the short term; the 80-day EMA is at $223.57, and the 160-day EMA is at $218.23. The price is below all moving averages, though the five EMAs have not yet formed a complete bearish alignment, indicating that the short-term trend has weakened while the long-term structure remains under test.
In terms of upside room, whether the stock price can reclaim the 160-day EMA is the first watch point, with more critical resistance concentrated between $222.91 and $225.86, formed jointly by Fibonacci resistance, multiple moving averages, and the lower boundary of the broken channel.
On the downside, if the stock price decisively breaks below $216.59, the pullback could extend to the 0.618 Fibonacci retracement level ($210), turning the channel breakdown into a deeper giveback of gains.
Recommended Articles


