


Bitcoin Price Forecast: BTC Rebounds After Falling Below $80,000, Can Price Break $87,000?
TradingKey - As of Friday (October 16), Bitcoin (BTC) maintained a range-bound pattern following a sharp drop on Thursday, with the latest price trading around $82,300. Prior to this, BTC briefly fell near $79,700 on October 15, touching a nearly four-week low, before rapidly rebounding above $82,000. However, the current price remains below the level near $84,000 at the beginning of this week, indicating that short-term correction pressure has not been fully relieved.
US PPI Beats Expectations, But Cooling Fed Rate-Hike Expectations Support Bitcoin Rebound
From a fundamental perspective, recent Bitcoin volatility has been primarily driven by U.S. inflation data, Federal Reserve monetary policy expectations, and spot ETF capital flows.
Data released by the U.S. Bureau of Labor Statistics on Thursday showed that the September PPI rose 1.3% month-over-month, marking the largest increase since March 2022, and advanced 6.3% year-over-year. Meanwhile, U.S. retail sales grew 0.8% month-over-month in September, beating market expectations of 0.3%, indicating that U.S. inflation pressures remain elevated and economic activity maintains a degree of resilience.
Persistently high inflation suggests that the Federal Reserve may need to maintain higher interest rates, and a high-rate environment typically enhances the relative appeal of interest-bearing assets such as bonds, putting pressure on risk assets including Bitcoin. Following the release of these two data points, Bitcoin briefly fell below the $80,000 mark.
However, the market did not continuously raise the probability of an October rate hike due to the higher-than-expected PPI. On one hand, September retail sales growth was mainly driven by rising gasoline prices; core retail sales—excluding autos, gasoline, building materials, and food services—grew by only 0.1%, indicating that consumer demand has not accelerated across the board.
On the other hand, Federal Reserve Chair Warsh did not explicitly signal another rate hike in October in his latest speech on Friday, emphasizing that subsequent policy decisions will depend on economic data. Meanwhile, U.S. Treasury yields pulled back from previous highs and the dollar's rally slowed, providing some support for Bitcoin's rebound from below $80,000.
On the flows front, U.S. spot Bitcoin ETFs recorded a net inflow of $5.1 million on October 15, snapping a net outflow of $261.4 million in the previous trading session. However, the cumulative net outflow from October 12 to 15 remained around $146 million, indicating that institutional capital demand has not significantly improved.
Bitcoin Price Technical Analysis
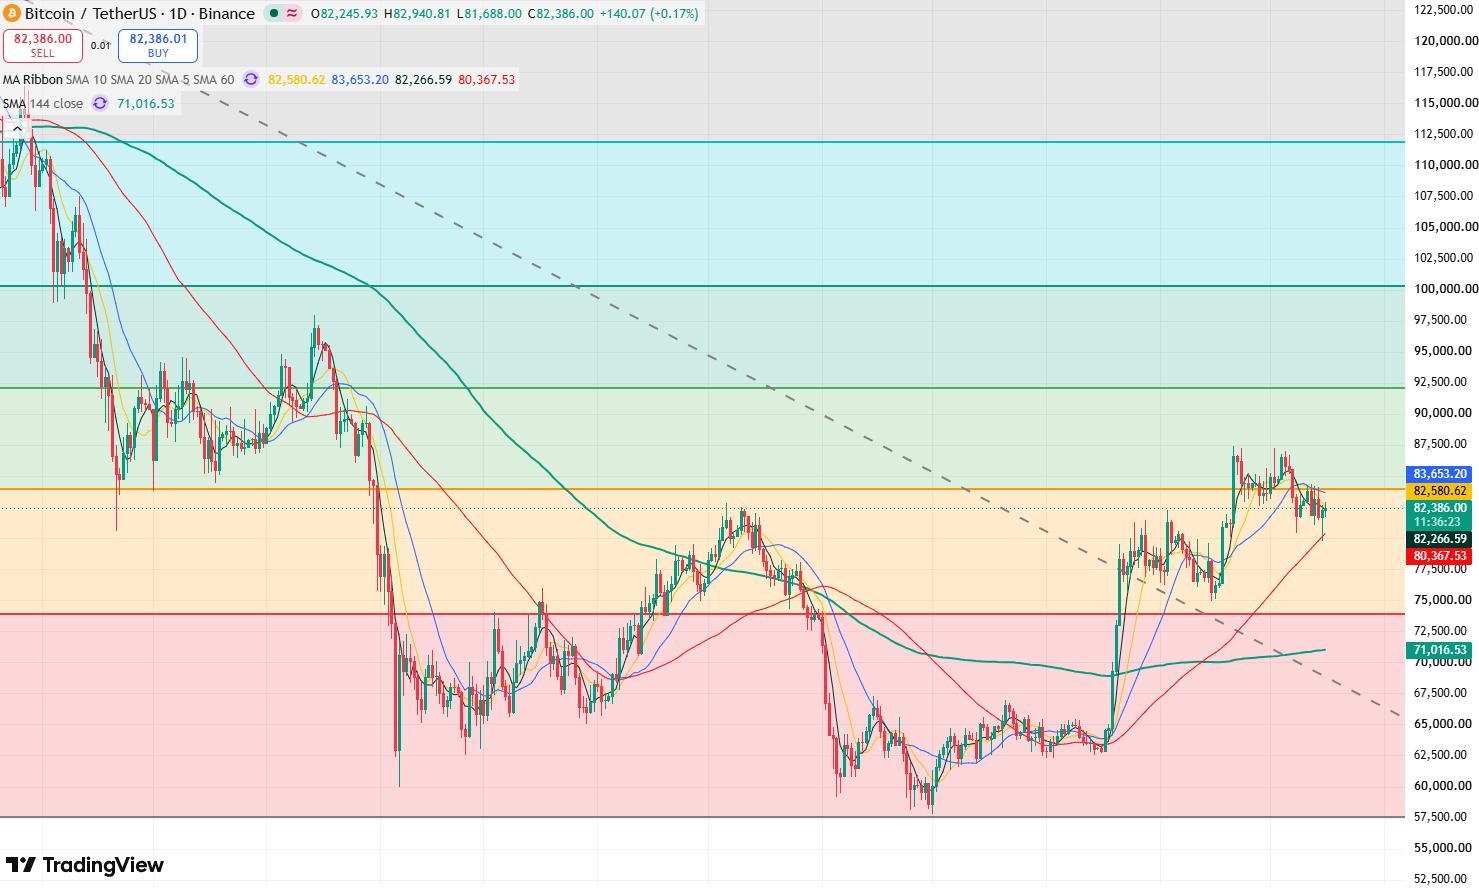
Bitcoin daily price chart, Source: TradingView
Looking at Bitcoin's daily chart, after rebounding to around $87,000 in early October, Bitcoin continued to pull back, successively falling below $84,000 and $82,000 this week, and even briefly piercing the $80,000 mark on Thursday. However, prices quickly recovered lost ground, indicating that certain buying support still exists around $80,000.
Currently, Bitcoin dropped to near $80,000 on Thursday while remaining above its 60-day moving average. Technically, this may form a confluence of support, sustaining a price rebound for two consecutive trading days, signaling strengthened short-term bullish momentum and significantly increasing the likelihood of a continued rebound in the short term.
On the upside, the primary overhead resistance level to watch is $84,000. If it breaks through and holds above this level, Bitcoin is expected to challenge the key resistance at $87,000 again. Only when Bitcoin forcefully breaks through $87,000 can it open up greater upside space.
On the downside, the primary support level to watch below is $81,000. If this level is breached, Bitcoin may continue downward to test the $80,000-$79,800 range. If Bitcoin falls below $79,800, it could pull back further toward the key support level at $75,000.
Recommended Articles


