


SpaceX Stock Price Forecast: Barclays Sees Tesla Merger Proposal Announced in Late October to Early November, Technicals Point to Stock Recovery
TradingKey - On October 15 Eastern Time, SpaceX (SPCX) shares once fell to $140.66, down over 20% from the recent high of $176.42 on October 6 and hitting a new low since early September.
However, the sharp pullback in the stock price does not necessarily mean a parallel deterioration in fundamentals; this decline is more likely dragged down by a broad sell-off in AI hardware stocks.
Meanwhile, speculation surrounding a merger between SpaceX and Tesla (TSLA) continues to heat up, which could serve as the latest catalyst for a recent stock price recovery. Barclays analyst Dan Levy believes the two companies could announce merger plans prior to Tesla's annual shareholder meeting this year, with SpaceX more likely acting as the acquirer to integrate both businesses via a stock swap.
Barclays stated that the merger proposal could be announced before Tesla's annual general meeting (held by December 6 at the latest), with late October to early November also being a potential window, though securing shareholder approval is becoming more difficult. The firm noted that a merger between Tesla and SpaceX would fully capitalize on vertical integration opportunities and accelerate the development of AI.
Levy stated: "While the industrial logic of a merger has faced persistent skepticism, we believe recent management commentary suggests they see key benefits to a combination. Crucially, while we expect some financial synergies, the true value lies in vertical integration."
In addition, Levy views Terafab as a key driver for the merger, as Musk firmly believes this semiconductor manufacturing facility is critical to meeting the computing needs of Tesla/SpaceX. However, as a joint development model, this creates a "complex situation" requiring approval from the boards of both companies.
Barclays believes that a merger could reduce friction stemming from separate board approvals. Other potential synergies include Starlink in-vehicle connectivity, Optimus access to Grok, and space data centers utilizing Tesla Energy products.
From a technical standpoint, SpaceX's current price has pulled back to near the 160-day moving average and sits below the 0.618 Fibonacci retracement level ($147.97). The current pattern reflects a post-breakout giveback of gains, returning to the original consolidation zone.
Previously, the stock price rebounded from its August low, grinding higher before breaking out of the consolidation range in early October to test $176.42. However, it subsequently retreated continuously, breaking below the 0.382 Fibonacci retracement level ($158.84) and the 0.5 Fibonacci retracement level ($153.40) in succession. This indicates that the gains from this breakout have been significantly given back, shifting the focus from an upward push to testing support within the original consolidation zone.
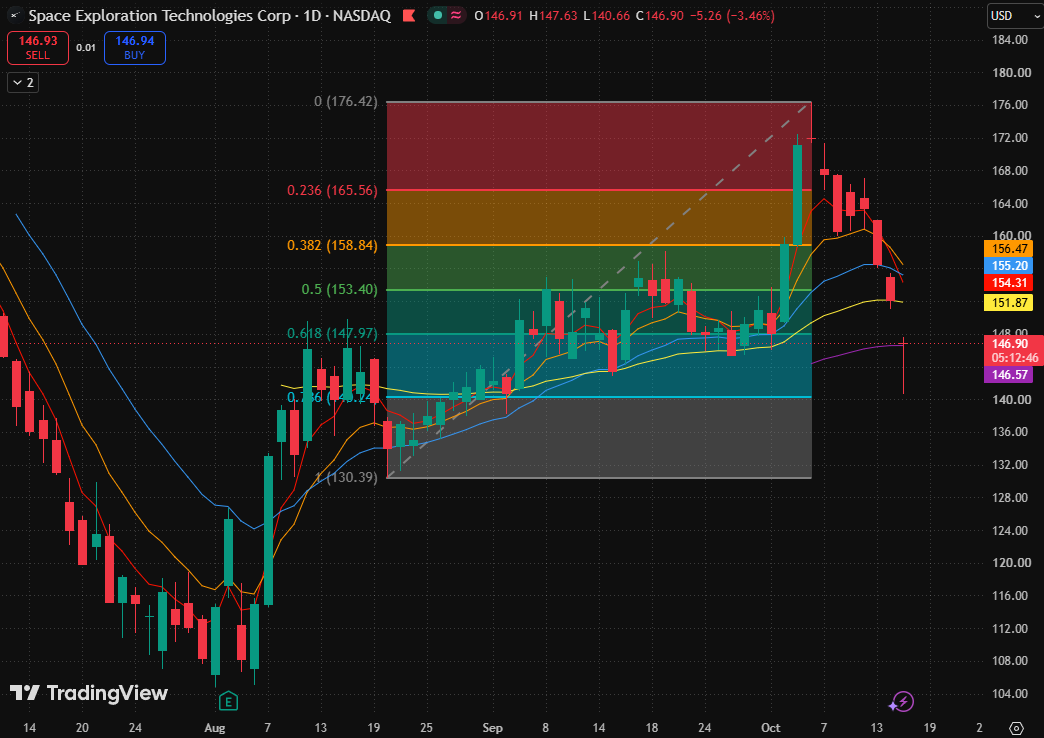
SpaceX daily chart, Source: TradingView
Regarding moving averages, the 5-day moving average stands at $154.24, below the 10-day moving average of $156.43 and the 20-day moving average of $155.18, indicating weakening short-term momentum; the price has also fallen below the 80-day moving average, but the 160-day moving average continues to slope gently upward. Thus, this reflects short- to medium-term weakness with long-term moving average support yet to be confirmed, rather than a full bearish alignment.
As of press time, today's stock price bounced noticeably after dipping lower, forming a long lower shadow, which indicates buying support at lower levels, though the price has yet to reclaim key retracement levels.
The next key level to watch is whether the stock price can reclaim and hold above the 0.618 Fibonacci retracement level ($147.97). If it stabilizes above this level, a recovery rally may ensue, with the next price target at the 80-day moving average ($151.86) as well as the dense resistance zone formed by the 5-day, 20-day, and 10-day moving averages.
If the stock loses the 160-day moving average and fails to reclaim it on a bounce, it will test lower toward the 0.786 Fibonacci retracement level ($140.24) and the intraday low ($140.66) to seek support.
Recommended Articles


