


History Says Berkshire Hathaway Stock Holds Up When the Market Falls: It Beat the S&P 500 in 11 of 13 Down Years
Key Points
Berkshire Hathaway is a conglomerate that isn't dependent on any single industry.
Its diversification provides multiple sources of earnings and cash flow.
- 10 stocks we like better than Berkshire Hathaway ›
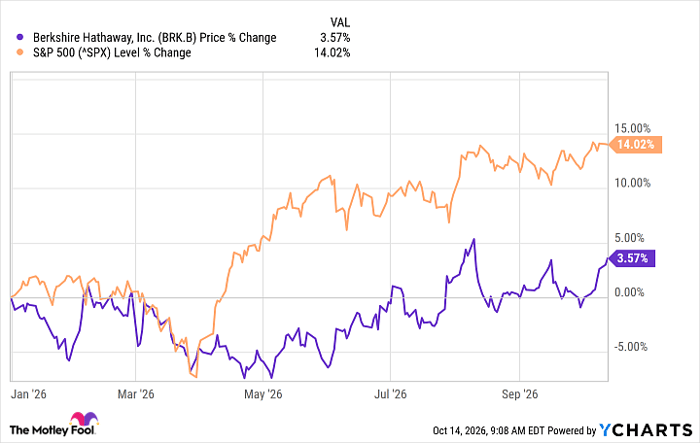
Berkshire Hathaway (NYSE: BRKA) (NYSE: BRKB) hasn't given investors much to get excited about this year. While the S&P 500 (SNPINDEX: ^GSPC) has gained about 14% in 2026, shares of Warren Buffett's former company are up only 3%.
But there's an interesting argument for owning Berkshire Hathaway that has nothing to do with how the stock is performing today. In fact, it becomes particularly compelling when the rest of the stock market is struggling.
Missed Nvidia in 2009? This Rare Signal Is Flashing Again. In 2009, a "Double Down" signal flashed for a little-known chipmaker called Nvidia. For the first time in years, that same "Total Conviction" signal is flashing for a company 1/100th the size of Nvidia. Continue »
Consider this: Since 1965, Berkshire Hathaway has outperformed the S&P 500 in 11 of the 13 years when the benchmark index posted a negative annual return.
That's an outstanding record -- and one that investors might want to consider before dismissing Berkshire as a stock that's lost its momentum.
Image source: Getty Images.
Berkshire Hathaway has a history of beating during down markets
One of the most interesting features of Berkshire Hathaway's annual shareholder letter is a table comparing the company's stock performance against the S&P 500, including dividends, dating back to 1965.
The results are remarkable. During that period, Berkshire delivered a compounded annual gain of 19.7%, compared to 10.5% for the S&P 500. That's the kind of performance that made Buffett one of the greatest investors of all time.
But I was particularly interested in what happened during the years when the stock market declined. The S&P 500 recorded 13 losing years between 1965 and 2025. Berkshire outperformed the index in 11 of them, including several occasions when its stock actually gained value while the broader market declined.
|
Years the S&P 500 Posted a Loss Since 1965 |
Berkshire Hathaway Performance |
S&P 500 Performance |
|---|---|---|
|
1966 |
-3.4% |
-11.7% |
|
1969 |
19.4% |
-8.4% |
|
1973 |
-2.5% |
-14.8% |
|
1974 |
-48.7% |
-26.4% |
|
1977 |
46.8% |
-7.4% |
|
1981 |
31.8% |
-5% |
|
1990 |
-23.1% |
-3.1% |
|
2000 |
26.6% |
-9.1% |
|
2001 |
6.5% |
-11.9% |
|
2002 |
-3.8% |
-22.1% |
|
2008 |
-31.8% |
-37% |
|
2018 |
2.8% |
-4.4% |
|
2022 |
4% |
-18.1% |
Source: Berkshire Hathaway.
For example, in 2022, the S&P 500 fell 18.1% as inflation and rising interest rates weighed on stocks. Berkshire managed a 4% gain. And during the 2008 financial crisis, the S&P 500 plunged 37%. Berkshire had a bad year as well, falling 31.8%, but shareholders still came out ahead of investors holding the broader index.
The exceptions were 1974 and 1990, when Berkshire suffered steeper losses than the S&P 500. In 1974, Berkshire plunged 48.7%, compared to a 26.4% decline for the index.
So, Berkshire isn't necessarily a haven when stocks fall. But its history suggests it has frequently provided investors with some protection against the worst of a market decline.
Why Berkshire Hathaway is different
There's a reason Berkshire has held up relatively well in difficult markets. It's not a typical stock, and its business isn't dependent on any single industry.
Berkshire owns companies ranging from the insurance giant GEICO to the BNSF railroad, as well as energy utilities, manufacturing operations, and retail businesses. It also has an investment portfolio that includes major holdings in Apple, American Express, and Coca-Cola.
That diversification doesn't eliminate risk, but it gives Berkshire multiple sources of earnings and cash flow, even when some parts of the economy are struggling.
Then there's the company's enormous cash position. In the company's second-quarter earnings report, Berkshire reported about $365.5 billion in cash and U.S. Treasury securities. Although some of that money is needed to support the insurance business, it also enables Berkshire to invest when attractive opportunities arise.
That's an important distinction. When stock prices fall, companies that need financing can find themselves in trouble. Berkshire, meanwhile, has the financial resources to purchase businesses or stocks at prices that may be considerably more attractive than they were during a bull market.
It's a strategy Buffett used for decades, and new Chief Executive Officer Greg Abel has emphasized that Berkshire will remain disciplined in how it invests shareholders' money.
Is Berkshire Hathaway stock a buy today?
Berkshire's lackluster performance in 2026 presents an interesting choice for investors.
The S&P 500 has continued climbing, while Berkshire has largely been on the sidelines. For investors seeking exposure to the market's fastest-growing companies, Berkshire may not look particularly appealing.
BRK.B data by YCharts
But Berkshire doesn't need a market decline to be a successful investment. Its collection of operating businesses, investment portfolio, and enormous financial resources can generate value over time, regardless of what the S&P 500 does in any particular year.
Still, with the S&P 500 enjoying another strong year and Berkshire stock taking a breather, investors have an opportunity to consider a company with a remarkable history of holding its own when markets struggle.
Berkshire may not be the stock that leads the market higher. But during the past six decades, it has frequently been the stock investors were glad they owned when the market headed lower.
Should you buy stock in Berkshire Hathaway right now?
Before you buy stock in Berkshire Hathaway, consider this:
The Motley Fool Stock Advisor analyst team just identified what they believe are the 10 best stocks for investors to buy now… and Berkshire Hathaway wasn’t one of them. The 10 stocks that made the cut could produce monster returns in the coming years.
Consider when Netflix made this list on December 17, 2004... if you invested $1,000 at the time of our recommendation, you’d have $379,986!* Or when Nvidia made this list on April 15, 2005... if you invested $1,000 at the time of our recommendation, you’d have $1,404,152!*
Now, it’s worth noting Stock Advisor’s total average return is 948% — a market-crushing outperformance compared to 215% for the S&P 500. Don't miss the latest top 10 list, available with Stock Advisor, and join an investing community built by individual investors for individual investors.
See the 10 stocks »
*Stock Advisor returns as of October 15, 2026.
American Express is an advertising partner of Motley Fool Money. Patrick Sanders has no position in any of the stocks mentioned. The Motley Fool has positions in and recommends American Express, Apple, and Berkshire Hathaway. The Motley Fool has a disclosure policy.
Recommended Articles


