


The Stock Market Has Been Sending a Quiet Warning Signal for Years. Here's What History Says Comes Next.
Key Points
Tech companies have soared in value, dominating major indexes.
The S&P 500's top 10 holdings now account for roughly 40% of the index's value.
If AI stocks are hit with volatility, it could hurt the broader market.
- 10 stocks we like better than S&P 500 Index ›
The majority of investors are feeling pessimistic about the market.
Over 53% believe stock prices will fall in the next six months, according to the latest weekly poll from the American Association of Individual Investors, while just 29% believe the market will continue climbing. With bond market chaos, oil price pressure, and inflation, there's been no shortage of stressors within the market lately.
Missed AI’s "Act 1"? Act 2 Could Be 15x Bigger. Most investors think they missed the AI boat because they didn't buy Nvidia in 2005. But according to our analysts, we’re only at the end of "Act 1"—the R&D phase. "Act 2" is the global rollout. Continue »
It's anyone's guess how the market will perform in the coming months, but an eventual pullback is inevitable -- and history suggests some investors are overlooking a sneaky risk factor.
Image source: Getty Images.
Tech giants are ruling the market, for better or worse
Company valuations have been climbing for years, but the tech industry has pushed these stocks to new heights. Now these stocks have historic control over the broader market.
The 10 largest stocks in the S&P 500 (SNPINDEX: ^GSPC) now account for around 40% of the index's overall value, which is the most concentrated it's been since the mid-1960s, according to S&P Global.
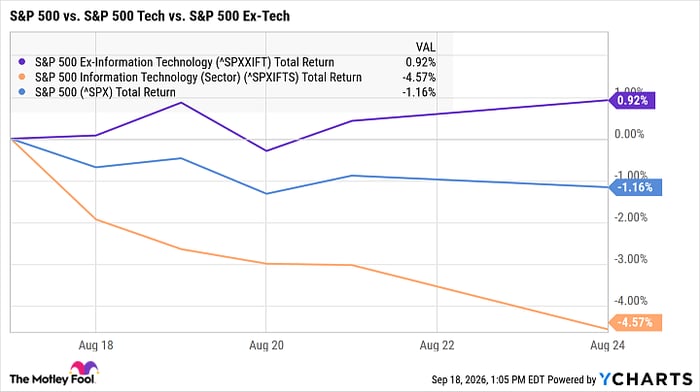
For investors, this means that a handful of stocks have an outsize effect on the market's overall performance. When those stocks are thriving -- as they have been in recent years -- it can lift the market to new records. But if they stumble, they risk dragging the rest of the S&P 500 down with them.
^SPXXIFT data by YCharts
We've seen this play out recently with short-term tech sell-offs. In mid-August, for example, the tech sector within the S&P 500 sank by more than 4.5% in just one week. However, despite the fact that the rest of the index was up by close to 1% in that time, the S&P 500 itself ended that week in the red.
History is offering a warning to investors
Between the 1960s and today, there was another period that saw a sudden spike in S&P 500 concentration: the dot-com bubble. In March 1995, the S&P 500's top 10 holdings accounted for just under 18% of the index's value. By March 2000, that figure had climbed to nearly 27%.
Back then, the top 10 holdings were also more diversified, with industrial and energy giants like General Electric and ExxonMobil dominating the S&P 500. Today, the top 10 holdings are Nvidia, Apple, Alphabet, Microsoft, Amazon, Meta Platforms, Broadcom, Tesla, Micron Technology, and Berkshire Hathaway.
In other words, almost all of the S&P 500's largest stocks are from tech companies -- and most of them are making big swings on artificial intelligence (AI). That's a lot of concentration in just one area of the market, and if we are in an AI bubble, it could lead to greater volatility within the S&P 500.
What should investors do right now?
To be clear, nobody can predict exactly what's coming for the market in the near term. While pullbacks are a natural part of the market's cycle, it's impossible to say when one will arrive, how long it will last, or how severe it might be.
That said, you can make three moves to protect your investments against volatility:
- Diversify your portfolio: If tech stocks take a turn for the worse, having stocks from other sectors can help limit the damage. While your diversification needs will depend on your goals and risk tolerance, it's generally recommended to invest in at least 50 stocks across multiple industries.
- Invest in quality companies: Weak or overvalued stocks are more likely to underperform over the long term, and some may not survive a bear market at all. Healthy stocks with robust underlying business fundamentals have the best shot at thriving over time.
- Hold your investments for at least a few years: A long-term outlook is perhaps the most important factor. The market has recovered from every downturn it's ever faced, and with enough time, it's all but guaranteed to survive the next one, too.
No matter what lies ahead for the stock market, a little preparation goes a long way. With a well-diversified portfolio full of strong stocks, you'll be well positioned to build long-term wealth despite short-term volatility.
Should you buy stock in S&P 500 Index right now?
Before you buy stock in S&P 500 Index, consider this:
The Motley Fool Stock Advisor analyst team just identified what they believe are the 10 best stocks for investors to buy now… and S&P 500 Index wasn’t one of them. The 10 stocks that made the cut could produce monster returns in the coming years.
Consider when Netflix made this list on December 17, 2004... if you invested $1,000 at the time of our recommendation, you’d have $387,158!* Or when Nvidia made this list on April 15, 2005... if you invested $1,000 at the time of our recommendation, you’d have $1,365,749!*
Now, it’s worth noting Stock Advisor’s total average return is 932% — a market-crushing outperformance compared to 211% for the S&P 500. Don't miss the latest top 10 list, available with Stock Advisor, and join an investing community built by individual investors for individual investors.
See the 10 stocks »
*Stock Advisor returns as of September 20, 2026.
Katie Brockman has no position in any of the stocks mentioned. The Motley Fool has positions in and recommends Alphabet, Amazon, Apple, Berkshire Hathaway, Broadcom, Meta Platforms, Micron Technology, Microsoft, Nvidia, and Tesla. The Motley Fool has a disclosure policy.
Recommended Articles


