


US S&P Global PMI expected to show moderating business activity in October
- US business activity is expected to slow slightly in October, while remaining firmly in expansion territory.
- Manufacturing and services surveys are forecast to ease, following strong readings in September.
- The US Dollar could find support if stronger-than-expected business activity reinforces expectations of further Fed rate hikes.
The United States (US) S&P Global preliminary Purchasing Managers Indices (PMIs) for October will be released on Friday, providing fresh insights into the health of the world's largest economy ahead of next week's Federal Reserve (Fed) monetary policy meeting.
The report includes the Manufacturing PMI, Services PMI and Composite PMI, which measure business activity across the private sector. Readings above 50 indicate expansion, while figures below that threshold signal contraction.
The October surveys come at a time when recent US economic data continue to highlight resilient economic activity, despite persistent inflationary pressures and elevated borrowing costs. Investors will closely monitor the figures for signs of slowing growth and renewed price pressures that could influence the Fed's monetary policy outlook and the US Dollar (USD).
What can we expect from the October S&P Global PMI report?
Market expectations point to a moderate slowdown in US private-sector activity in October, following particularly strong readings in September. The S&P Global Manufacturing PMI is expected to decline slightly to 55.6 from 55.9 in September, while the Services PMI is forecast to ease to 57.9 from 58.8. Meanwhile, the Composite PMI stood at 58.4 in September, highlighting robust growth across the US private sector.
Although both sectors are expected to lose some momentum, the anticipated figures remain comfortably above the 50 threshold, suggesting that the US economy continues to expand at a healthy pace.
The report will be particularly important given the latest signs of persistent inflationary pressures. Recent US economic releases show stronger-than-expected inflation, while Retail Sales and labor market indicators continue to suggest that domestic demand remains resilient.
Against this backdrop, the Fed is widely expected to leave interest rates unchanged at its October 28 meeting, following a 25-basis-point (bps) increase in September. However, investors are fully pricing in another rate hike in December, according to the CME FedWatch tool.
When will the October flash US S&P Global PMIs be released, and how could they affect EUR/USD?
The S&P Global Manufacturing, Services and Composite PMIs for October will be released on Friday at 13:45 GMT. The publication could trigger volatility in the US Dollar and the EUR/USD pair, particularly as investors position themselves ahead of the Fed's October 28 monetary policy decision.
A stronger-than-expected report could reinforce expectations of additional Fed rate hikes in the coming months. Such a scenario would likely support US Treasury yields and the US Dollar, potentially weighing on EUR/USD.
Conversely, a sharper-than-anticipated slowdown in business activity, particularly in the services sector, could raise concerns about the sustainability of US economic growth. Weaker PMI readings could encourage investors to reassess the likelihood of further monetary tightening, putting downward pressure on the Greenback and supporting EUR/USD.
However, the market reaction could remain relatively limited if the figures broadly match expectations, given that both manufacturing and services activity are forecast to remain firmly in expansion territory.
With another Fed rate hike already largely priced in for December, investors will closely assess whether Friday's PMI figures confirm the resilience of the US economy or point to a slowdown. A stronger-than-expected report could reinforce expectations of further monetary tightening, while disappointing readings could cast doubt on the strength of economic growth and weigh on the US Dollar.
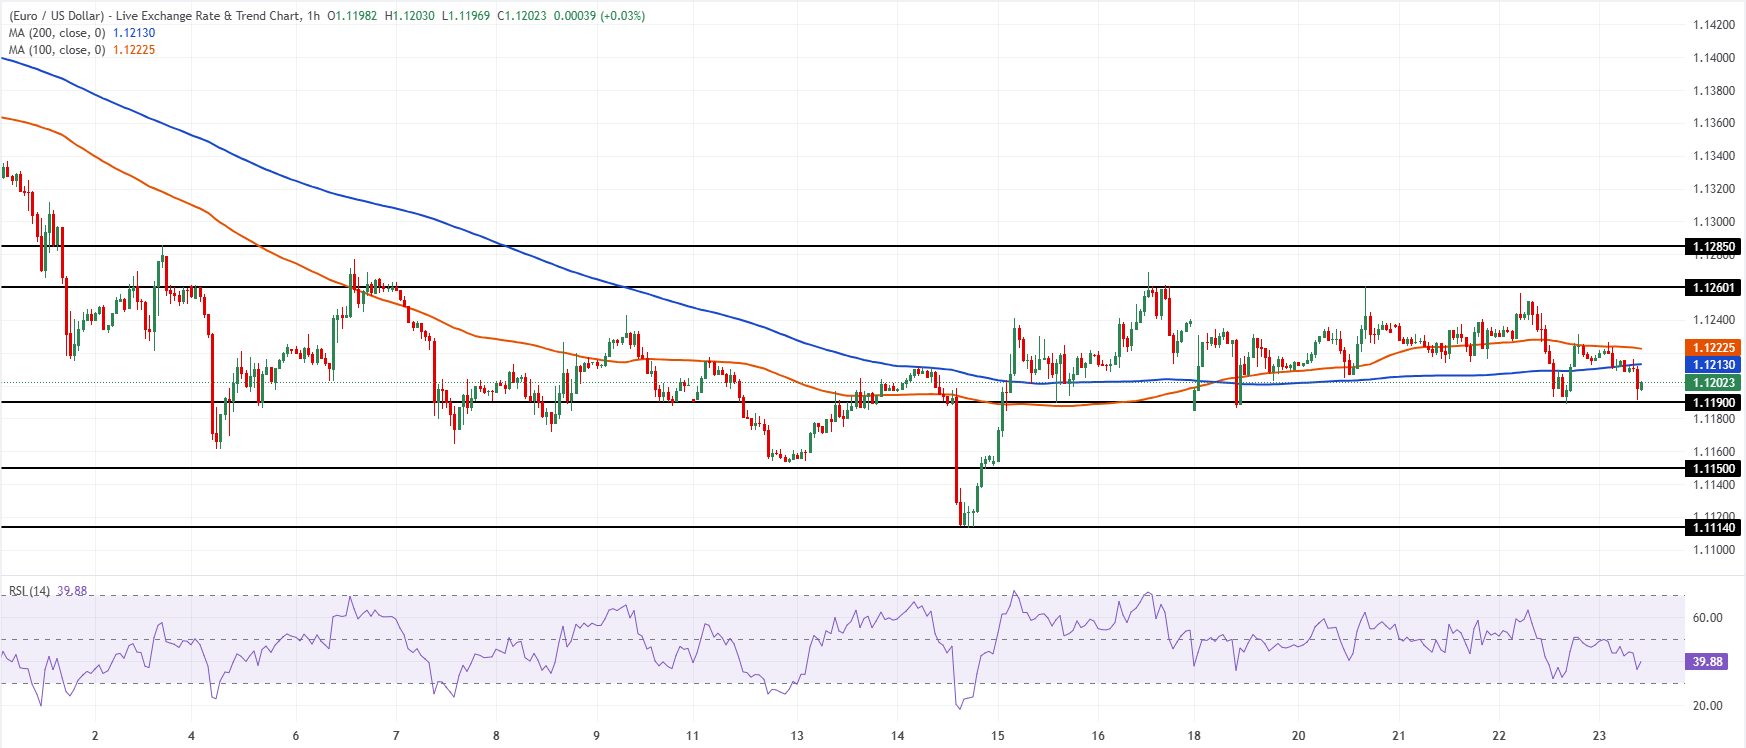
EUR/USD remains modestly bearish on the one-hour chart, holding below the 100-period Simple Moving Average (SMA) at 1.1223 and the 200-period SMA at 1.1213. The pair is drifting just above nearby price support, while the Relative Strength Index (14) around 40 hints at waning bullish momentum rather than outright oversold conditions, suggesting downside risks remain while these averages cap the topside.
On the downside, initial support emerges at the horizontal level near 1.1190, ahead of deeper floors at 1.1150 and 1.1114. On the topside, immediate resistance is seen at the 200-period SMA at 1.1213, followed by the 100-period SMA at 1.1223, with stronger hurdles at 1.1260 and 1.1285 that would need to be reclaimed to ease the current bearish bias.
(The technical analysis of this story was written with the help of an AI tool. Know more.)
Economic Indicator
S&P Global Manufacturing PMI
The S&P Global Manufacturing Purchasing Managers Index (PMI), released on a monthly basis, is a leading indicator gauging business activity in the US manufacturing sector. The data is derived from surveys of senior executives at private-sector companies from the manufacturing sector. Survey responses reflect the change, if any, in the current month compared to the previous month and can anticipate changing trends in official data series such as Gross Domestic Product (GDP), industrial production, employment and inflation. A reading above 50 indicates that the manufacturing economy is generally expanding, a bullish sign for the US Dollar (USD). Meanwhile, a reading below 50 signals that activity in the manufacturing sector is generally declining, which is seen as bearish for USD.
Read more.Next release: Fri Oct 23, 2026 13:45 (Prel)
Frequency: Monthly
Consensus: 55.6
Previous: 55.9
Source: S&P Global
Economic Indicator
S&P Global Services PMI
The S&P Global Services Purchasing Managers Index (PMI), released on a monthly basis, is a leading indicator gauging business activity in the US services sector. As the services sector dominates a large part of the economy, the Services PMI is an important indicator gauging the state of overall economic conditions. The data is derived from surveys of senior executives at private-sector companies from the services sector. Survey responses reflect the change, if any, in the current month compared to the previous month and can anticipate changing trends in official data series such as Gross Domestic Product (GDP), industrial production, employment and inflation. A reading above 50 indicates that the services economy is generally expanding, a bullish sign for the US Dollar (USD). Meanwhile, a reading below 50 signals that activity among service providers is generally declining, which is seen as bearish for USD.
Read more.Next release: Fri Oct 23, 2026 13:45 (Prel)
Frequency: Monthly
Consensus: 57.9
Previous: 58.8
Source: S&P Global
Recommended Articles


