


Bitcoin Weekly Forecast: BTC extends pullback as ETF inflows clash with risk-off sentiment
- Bitcoin extends its correction, posting mild losses so far this week and heading for a third consecutive weekly decline.
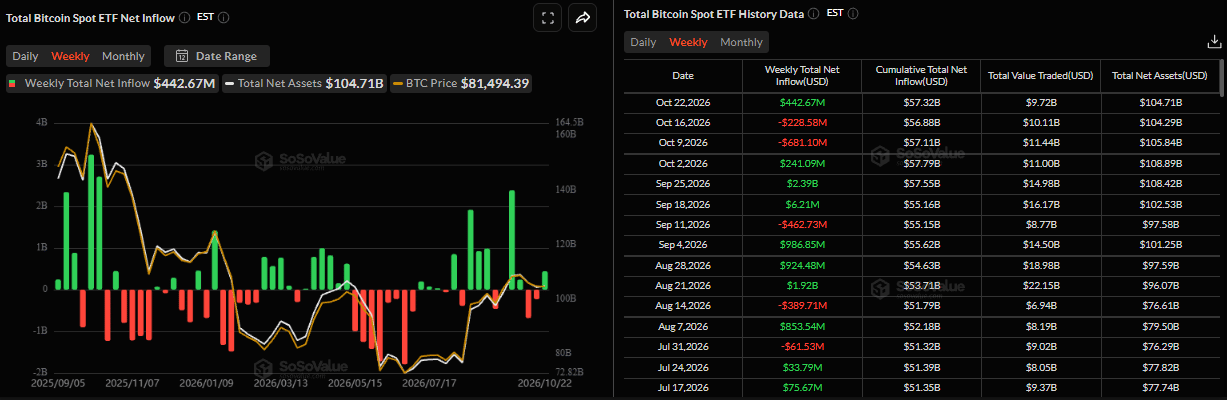
- US-listed spot ETFs are on track to break a two-week streak of outflows, recording $442.67 million in net inflows through Thursday.
- Escalating Middle East tensions, rising oil prices, and concerns over inflation and AI spending weigh on risk appetite, limiting BTC’s upside potential.
Bitcoin (BTC) remains under pressure, trading around $81,800 on Friday, recording modest losses so far this week. Despite a mild pullback, institutional demand showed signs of a comeback with spot Exchange Traded Funds (ETFs) recording $442.67 million in net inflows through Thursday.
Meanwhile, traders should still be cautious as escalating Middle East tensions, rising oil prices, and concerns over inflation and AI spending weigh on risk appetite, limiting the Crypto King’s recovery.
Institutional demand shows signs of a comeback
Institutional demand for Bitcoin has shown some strength so far this week. SoSoValue data show spot ETFs are on track to break a two-week streak of outflows, recording $442.67 million in net inflows through Thursday. If these inflows continue and intensify on Friday, BTC could recover.
In addition, BIT Asset Management AG, BIT’s wholly owned Swiss asset management subsidiary, announced on Thursday that the Swiss Financial Market Supervisory Authority (FINMA) has approved the Bitcoin Fund ETF (BBIT).
As FINMA confirmed, it is the first exchange-traded fund in Switzerland to invest directly in Bitcoin. It is currently Europe’s only spot Bitcoin ETF. The fund is expected to begin trading on the SIX Swiss Exchange in November. The launch could broaden institutional access to BTC, encourage wider adoption and strengthen the Crypto King’s long-term outlook.
Inflation fears cap BTC's recovery
Rising energy prices, driven by persistent tensions in the Middle East, saw West Texas Intermediate (WTI) surge above $100 per barrel this week after rallying over 8% the previous week.
The fighting between Saudi Arabia and Yemen’s Iran-backed Houthi movement has escalated sharply, leading to Houthi drone and missile strikes on the kingdom’s airports and critical energy infrastructure.
In further developments, Iran’s Islamic Revolutionary Guard Corps (IRGC) said that renewed US attacks could prompt Tehran to invade neighboring countries and hit bases used in US military operations as part of its new offensive strategy. This comes on top of a report that the US and Israel have drawn up plans for a short but intense military campaign against Iran after the US midterm elections.
These developments keep the geopolitical risk premium in play, continue to drive higher oil prices and have prompted fears of further acceleration in inflation expectations, dampening risk appetite and capping BTC’s recovery.
How could growing concerns over elevated AI spending impact Bitcoin’s price?
In an exclusive interview with FXStreet, Simon-Peter Massabni, Head of Business Development at XS.com, said that the AI investment boom appears to be draining liquidity from other markets, including fixed income and cryptocurrencies. While the stock market continues to reach record highs, Bitcoin has struggled to keep pace, reflecting capital’s concentration in AI-related investments and technology stocks.
Simon-Peter explained that the concerns over the sustainability of AI spending resurfaced this week after IBM Chief Executive Officer Arvind Krishna warned that corporate clients are increasingly questioning whether massive AI investments will generate tangible returns, despite the company’s better-than-expected results.
According to Massabni, Bitcoin’s implications will depend on how these concerns develop. If Big Tech companies continue reporting strong earnings and sustaining their AI investments, related equities could remain attractive, keeping liquidity away from cryptocurrencies and delaying BTC’s recovery.
This could also mean a continuation of the current on-off pattern, where traders step in to secure short-term gains and then exit again amid concerns about the sustainability of the recovery. This is what we saw in spot Bitcoin funds, which recorded $1 billion in positive inflows earlier this week before more than $600 million flowed out yesterday alone.
On the other hand, if concerns about AI spending intensify and investors begin questioning the returns on massive technology investments, a correction in equities could redirect some capital toward Bitcoin. Provided the correction remains contained and does not trigger broader economic deterioration, Bitcoin, already trading nearly 35% below its all-time high, could attract renewed buying interest and support a wider cryptocurrency market recovery.
In a worse and extreme scenario, a bursting of the AI bubble amid collapses in major indexes beyond bear market territory – due to results that fall drastically short of bright investor expectations, and coinciding with a worsening geopolitical reality in the Middle East where tensions could further escalate and cause even bigger oil market shocks – could trigger deep declines in both the stock and cryptocurrency markets simultaneously. At these lower price levels, the risk may not look attractive compared to the sheer volume of surrounding risks.
“Over the next few days, I expect Bitcoin to remain sideways, with the potential for further downside and a break below the $80,000 level, as the heavy focus on geopolitical factors amid the deteriorating situation in the Middle East may prevent Bitcoin from benefiting from capital rotation,” Massabni concluded.
Bitcoin technical outlook: Mild weakness
The Crypto King posted mild losses so far this week, trading around $81,800 on Friday, after two consecutive weeks of correction.
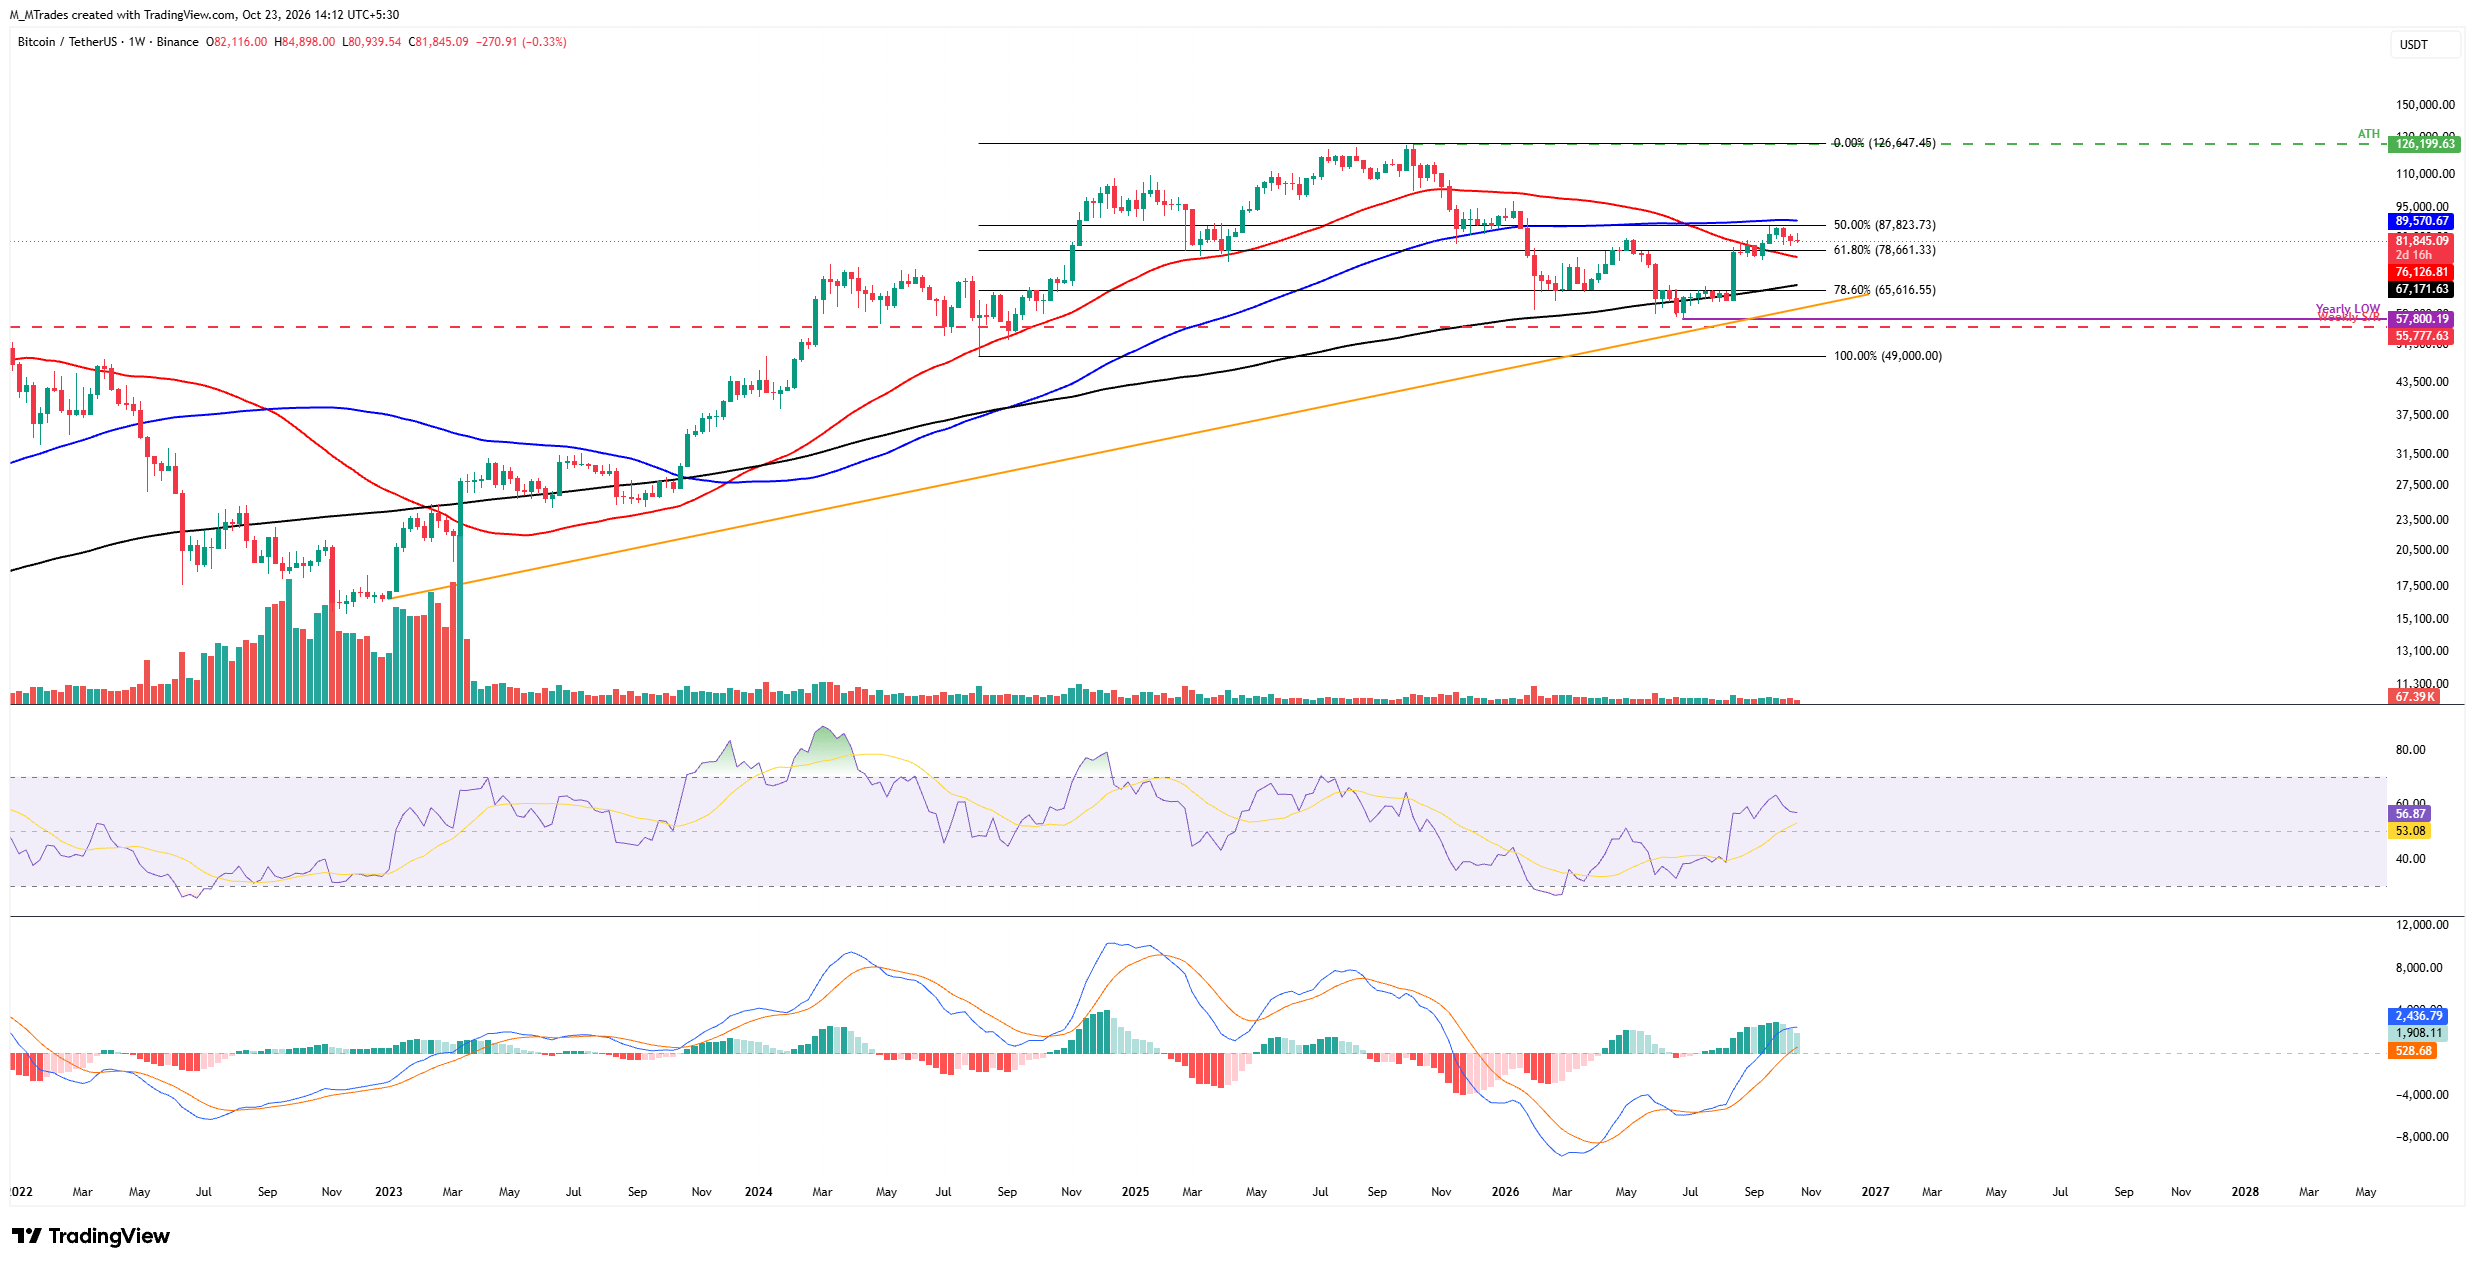
If BTC continues its correction, it could extend losses toward the 61.8% Fibonacci retracement level of $78,661 (drawn from the August 2024 low of $49,000 to the October 2025 record high of $126,199), which roughly coincides with the 50-week Simple Moving Average (SMA) at $76,126.
The Relative Strength Index (RSI) on the weekly chart stands near 56, pointing downward toward the neutral 50 level, indicating that bullish momentum is cooling. Meanwhile, the Moving Average Convergence Divergence (MACD) histogram remains positive, although its bars are weakening. This suggests broader upside momentum remains intact but is losing strength amid nearby resistance and the ongoing pullback.
On the other hand, if BTC recovers, it could extend the advance toward the 50% retracement level of $87,823, then the 100-week SMA at $89,570.
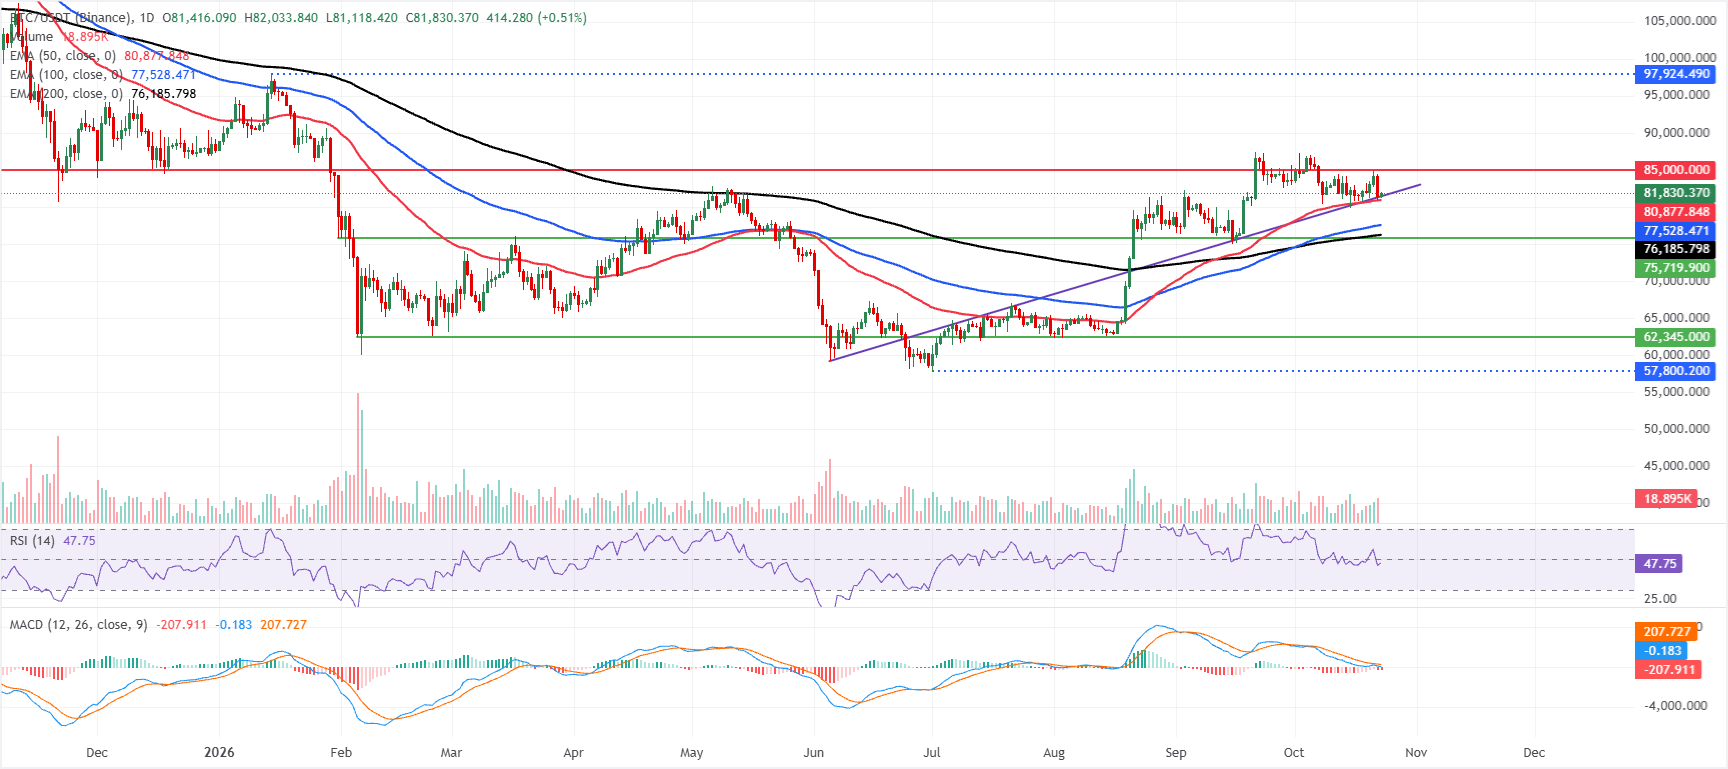
On the daily chart, BTC holds a constructive near-term bullish bias as price remains above the 50-day, 100-day and 200-day Exponential Moving Averages (EMAs) at $80,877, $77,528 and $76,185, respectively. The clustering of these EMAs below spot hints at a well-supported uptrend, although the daily RSI around 47 suggests momentum has cooled toward neutral. At the same time, the MACD remains below zero with a negative histogram, reinforcing a still-fragile bullish tone rather than an impulsive breakout phase.
On the topside, initial resistance is seen at the horizontal barrier around $85,000, where prior supply could cap further advances.
On the downside, immediate support is located near the 50-day EMA at $80,877, followed by deeper structural support at the 100-day EMA at $77,528 and the 200-day EMA at $76,185 if corrective pressures extend.
(The technical analysis of this story was written with the help of an AI tool. Know more.)
Bitcoin, altcoins, stablecoins FAQs
Bitcoin is the largest cryptocurrency by market capitalization, a virtual currency designed to serve as money. This form of payment cannot be controlled by any one person, group, or entity, which eliminates the need for third-party participation during financial transactions.
Altcoins are any cryptocurrency apart from Bitcoin, but some also regard Ethereum as a non-altcoin because it is from these two cryptocurrencies that forking happens. If this is true, then Litecoin is the first altcoin, forked from the Bitcoin protocol and, therefore, an “improved” version of it.
Stablecoins are cryptocurrencies designed to have a stable price, with their value backed by a reserve of the asset it represents. To achieve this, the value of any one stablecoin is pegged to a commodity or financial instrument, such as the US Dollar (USD), with its supply regulated by an algorithm or demand. The main goal of stablecoins is to provide an on/off-ramp for investors willing to trade and invest in cryptocurrencies. Stablecoins also allow investors to store value since cryptocurrencies, in general, are subject to volatility.
Bitcoin dominance is the ratio of Bitcoin's market capitalization to the total market capitalization of all cryptocurrencies combined. It provides a clear picture of Bitcoin’s interest among investors. A high BTC dominance typically happens before and during a bull run, in which investors resort to investing in relatively stable and high market capitalization cryptocurrency like Bitcoin. A drop in BTC dominance usually means that investors are moving their capital and/or profits to altcoins in a quest for higher returns, which usually triggers an explosion of altcoin rallies.
Recommended Articles


