


Bitcoin struggles to capitalize on US Dollar weakness as Democrats advance in US midterms
- Bitcoin edges below $76,000 on Wednesday, testing its 200-day EMA around $76,501 as selling pressure mounts.
- US Dollar Index slips to 101.3 early on Wednesday as US midterm elections create uncertainty.
- Democrats are on track for a sweeping victory in both houses, as per early results.
Bitcoin (BTC) is down nearly 2% on Wednesday, trading below $76,000, and testing the 200-day Exponential Moving Average (EMA) baseline near $76,501. Bitcoin’s pullback aligns with the weakness in the US Dollar (DXY), which typically provides tailwinds for risk-sensitive assets. The selling pressure aligns with the US midterm elections as early results point to Democrats leading gains in both houses.
Democratic sweep in the US midterms
Early US midterm results show Democrats leading gains in the US Senate and the House of Representatives. Democrats will require 218 seats in the House of Representatives and 51 seats in the Senate for an outright majority.
Social sentiment supports a Democratic sweep in these midterm elections, with Kalshi’s forecast projecting a 100% chance that Trump will lose control of both houses.

US Dollar weakness fails to support Bitcoin
US Dollar Index sees some selling pressure on Wednesday, down to 101.3, marking a fresh 30-day low. In addition, the falling US Treasury yields support a weaker US Dollar, with the 2-year bond yield down 5 basis points (bps) to 4.566% and the benchmark 10-year yield down 6 bps to 4.90%, as previously reported by FXStreet. This weakness aligns with the uncertainty around the US midterms as Republicans lose control, putting President Trump's fiscal and economic agenda in gridlock.
Typically, a weakness in the US Dollar supports risk-sensitive assets like Bitcoin. However, BTC also sees some selling pressure, down 2% on Wednesday, and trading below $76,000. This suggests that Bitcoin is failing to capitalize on a weaker dollar, as midterm risks outweigh the dollar's decline.
BTC price risks a close below its 200-day EMA at $76,500, which could further tighten the bearish grip. On the downside, immediate support is seen at the horizontal level around $75,545, where any break would expose the next bearish targets at $70,505 and $67,292.
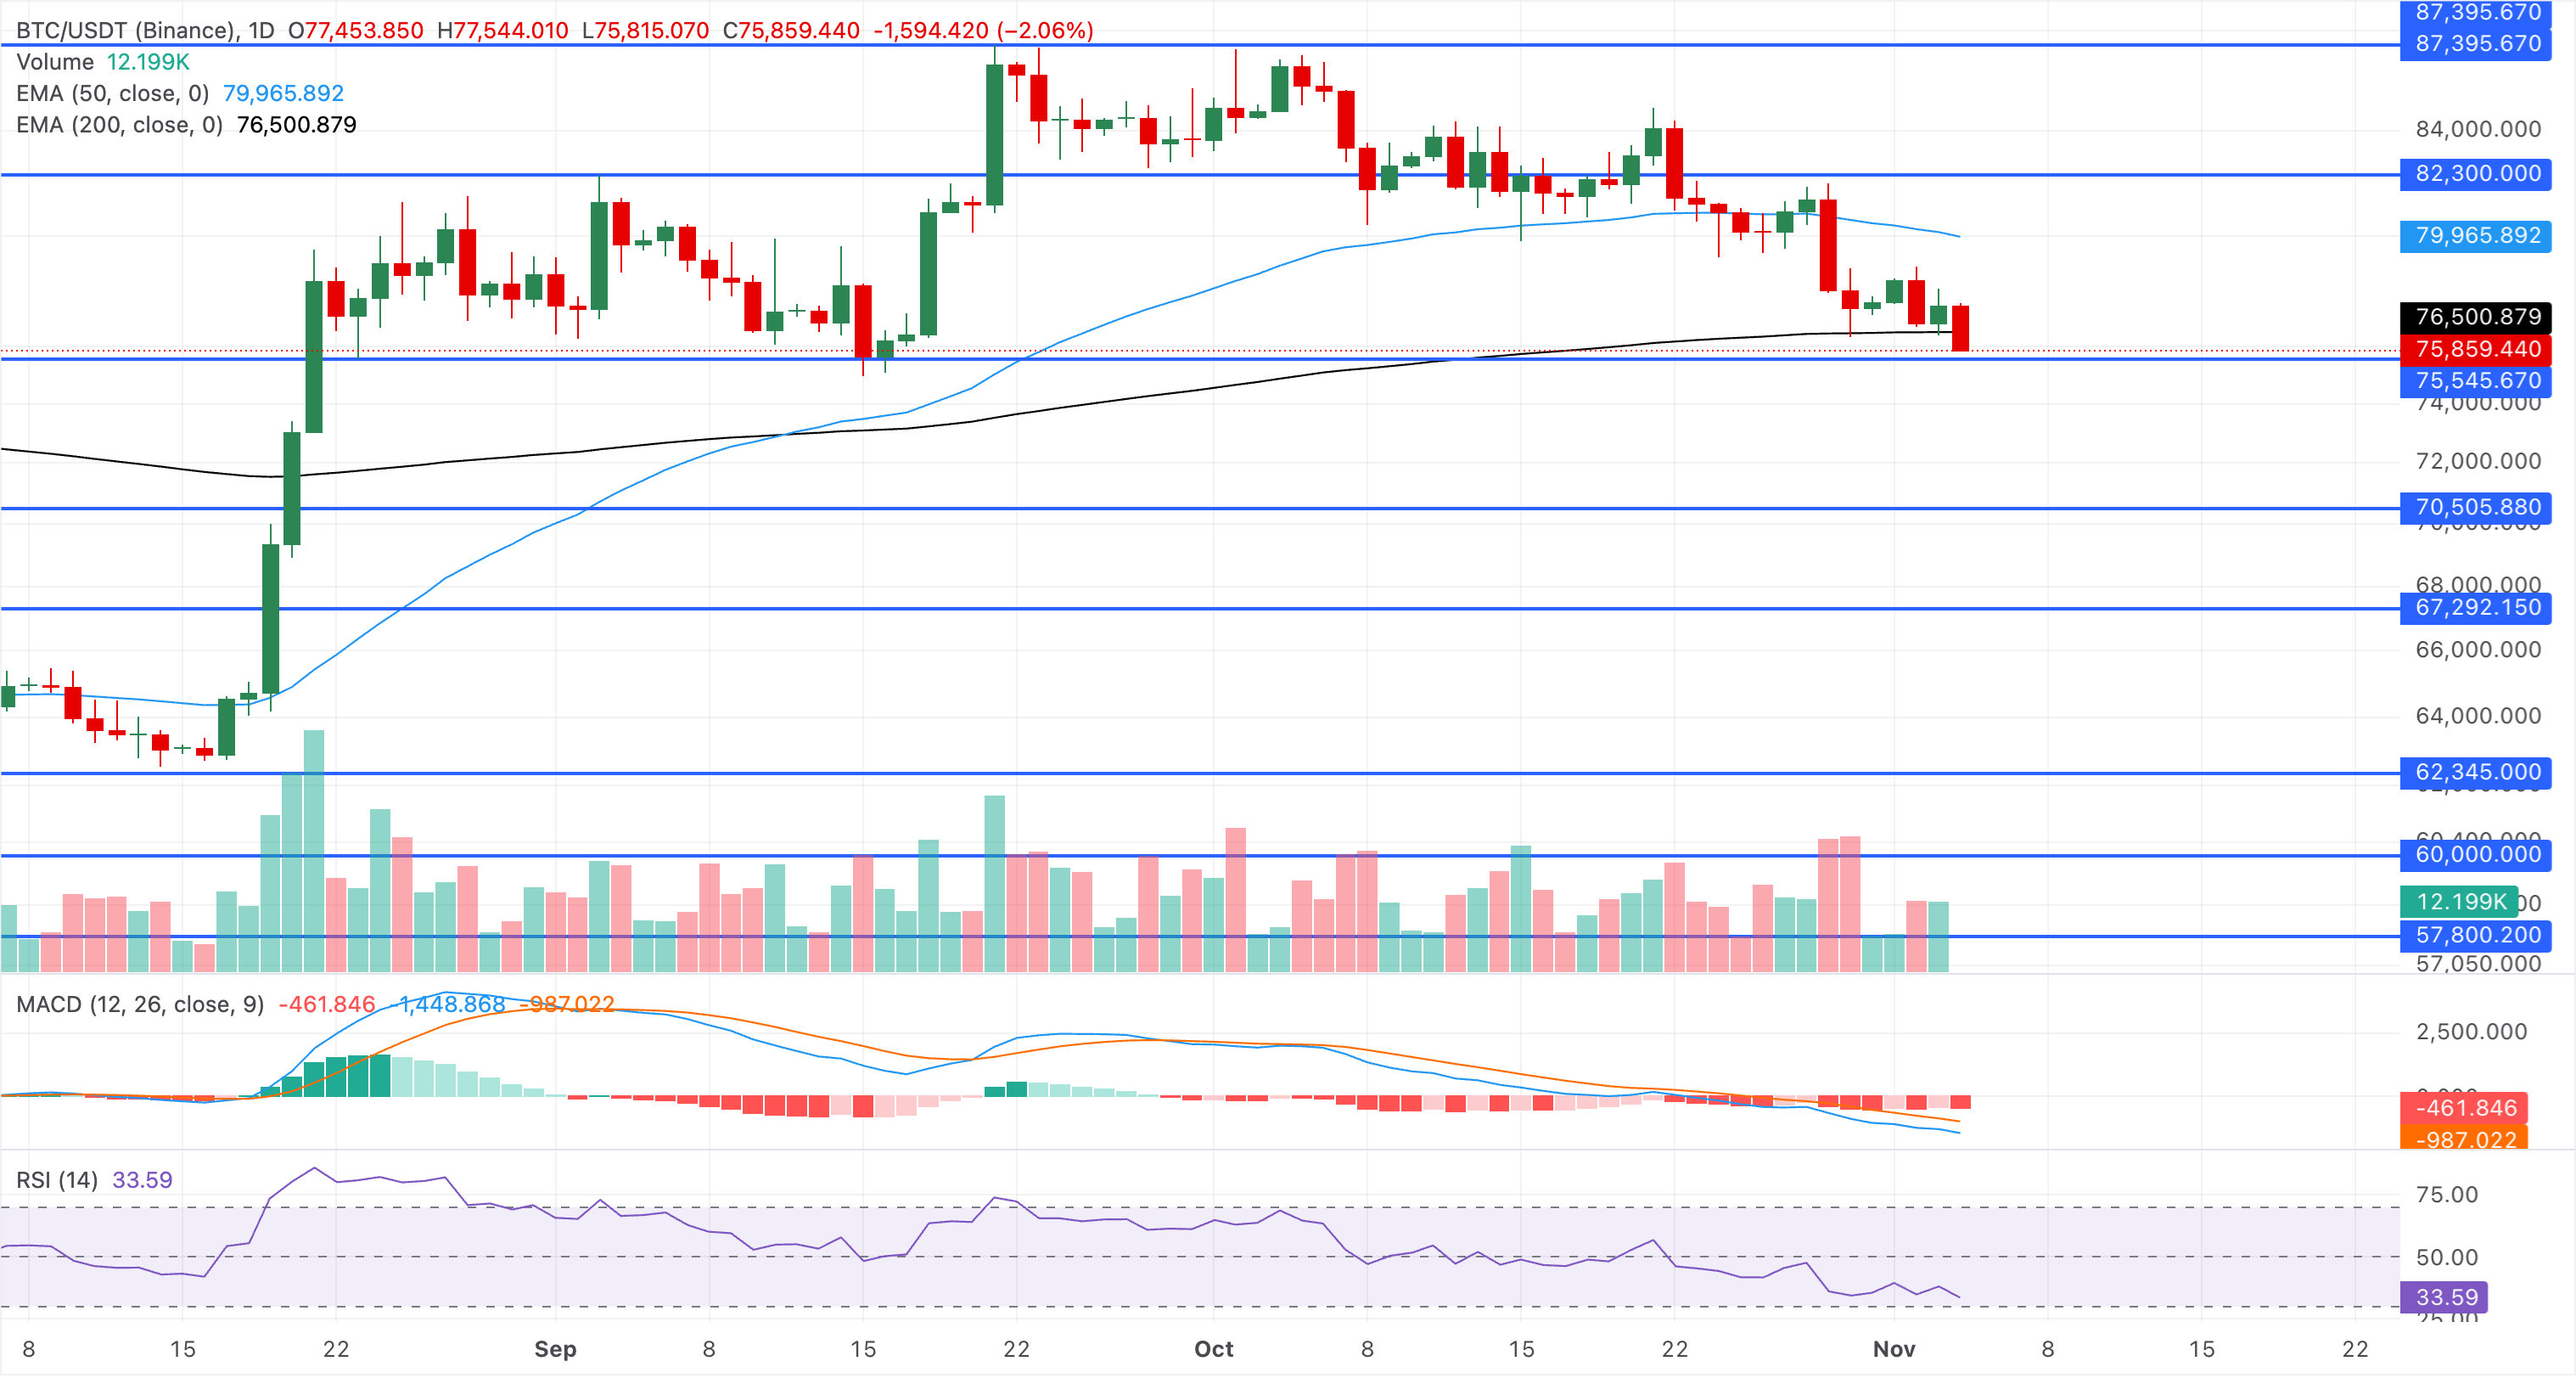
Looking up, a daily close above the 200-day EMA at $76,500 would be the first sign of easing selling pressure, though stronger resistance waits at the 50-day EMA at $79,965.
(The technical analysis of this story was written with the help of an AI tool. Know more.)
US midterm elections FAQs
The US midterm elections are the federal elections held halfway through a president's four-year term. Voters choose all 435 members of the House of Representatives, about one-third of the Senate, and, in many states, governors and other state and local officials.
Election Day is Tuesday, November 3, 2026. Federal law sets it as the Tuesday after the first Monday in November. Early voting and mail voting are already under way in many states.
They decide which party controls each chamber of Congress for the last two years of President Donald Trump's term. The majority party sets the legislative agenda, chooses committee leaders and, in the Senate, controls confirmations of judges and senior officials.
No. The president is elected every four years; the next presidential election is in November 2028. Midterms are often seen as a referendum on the sitting president's party, which historically tends to lose House seats.
Most analysts expect a modest, short-lived reaction in the US Dollar rather than a lasting trend. A divided Congress is widely seen as the base case and is partly priced in. Treasury yields may react more noticeably to the results. Outcomes that raise expectations of fiscal stimulus tend to lift yields and the US Dollar, while gridlock that limits new spending can pull both lower. Political friction, such as funding or debt-ceiling standoffs, can also briefly lift the Dollar as a safe haven. Over six to twelve months, growth and Federal Reserve policy matter more than the vote.
US stocks have historically been weak before midterms and strong after them. Since 1950, the S&P 500 has been higher 12 months after every midterm election, 19 out of 19, with an average gain of about 15%. Analysts link the pattern to uncertainty fading once results are known. Past performance does not guarantee future returns, and some strategists note that high valuations in 2026 could test the streak.
Markets have often welcomed a divided government because gridlock makes sweeping changes to taxes, spending and regulation less likely. Under a Republican president, the S&P 500 has historically done well in years following midterms that split control of Congress. The risks are funding deadlines, debt-ceiling fights and congressional investigations, which can add short-term volatility.
Recommended Articles


