

Cardano Price Forecast: Weak momentum puts ADA recovery at risk

Source Fxstreet
  • Cardano price trades below $0.222 on Thursday after failing to close above the 50-day EMA near $0.228 the previous day.
  • Weakening derivatives metrics continue to cap ADA recovery.
  • The technical outlook suggests fading momentum, with a close below the 100-day EMA support hinting at a deeper correction.

Cardano (ADA) is trading below $0.222 on Thursday after failing to sustain gains above the 50-day Exponential Moving Average (EMA) near $0.228 the previous day. Weakening derivatives metrics and fading bullish momentum continue to weigh on sentiment, while a break below the 100-day EMA could push ADA lower.

Weakening derivatives metrics cap Cardano

Derivatives data shows a cautious outlook for Cardano. CoinGlass’ long-to-short ratios for ADA read 0.79 on Thursday, nearing the lowest level over a month. A ratio below one indicates bearish sentiment, as traders bet that asset prices will fall.
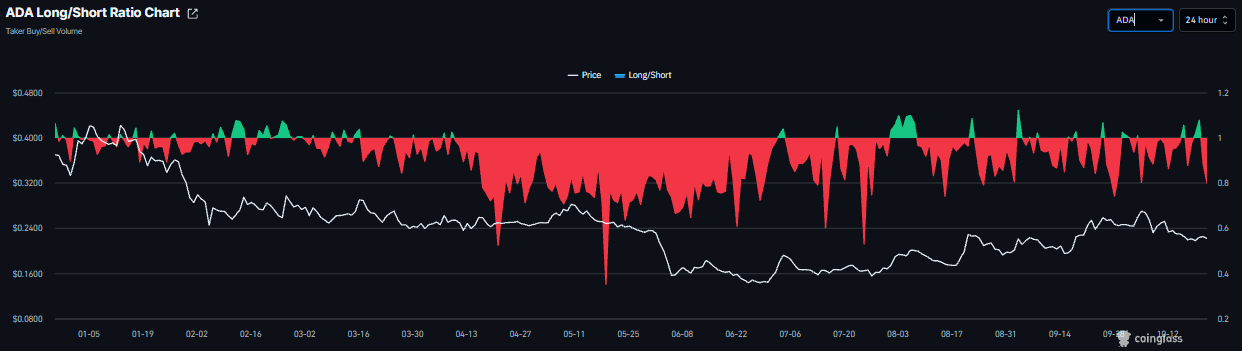
ADA long-to-short ratio chart. Source: Coinglass

In addition, Cardano’s funding rate flipped negative on Wednesday, reading -0.0025% on Thursday, indicating shorts are paying longs and suggesting a bearish outlook.
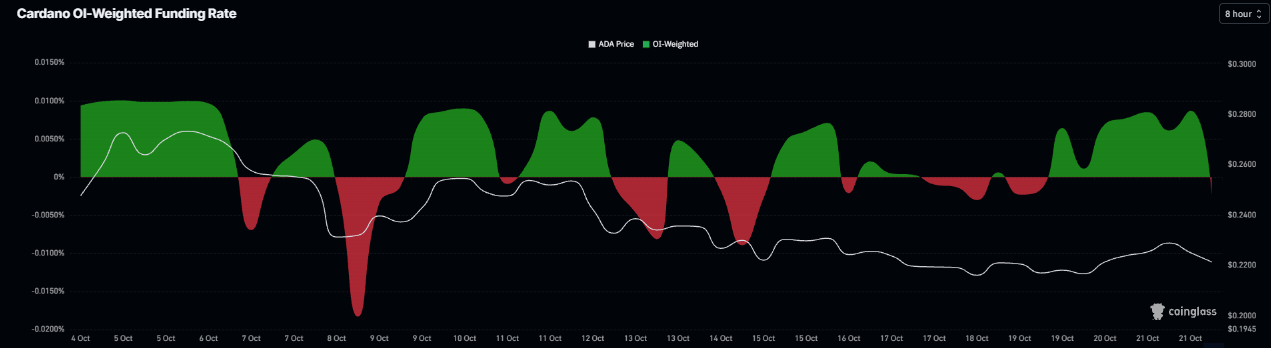
Cardano funding rates chart. Source: Coinglass

On-chain data shows bearish bias

CryptoQuant’s summary data shows a bearish outlook for Cardano. ADA’s futures markets show large whale orders alongside heating conditions. In addition, the spot and futures markets show sell-side dominance. These highlight a bearish, cautious sentiment bias among Cardano traders.
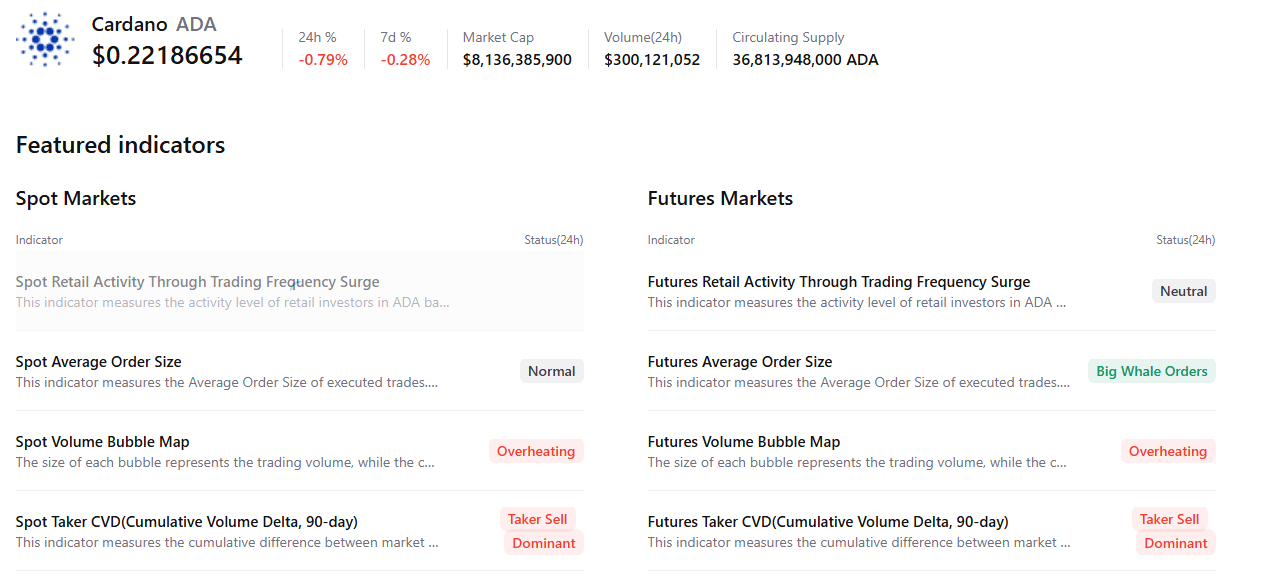
Cardano summary chart. Source: CryptoQuant

Cardano technical outlook: Weakening momentum indicators

Cardano price trades at $0.221 on Thursday, holding below its 50-day and 200-day Exponential Moving Averages (EMAs), which keeps the near-term bias tilted to the downside. ADA is hovering just above the 100-day EMA around $0.220, while the break of the rising support trend line near $0.210 hints that the broader corrective phase remains in play.

Momentum indicators back this cautious tone, with the Relative Strength Index (RSI) lingering in the low-40s and the Moving Average Convergence Divergence (MACD) still negative, suggesting downside pressure is fading but not yet reversed.

On the topside, initial resistance appears at the 50-day EMA near $0.230, followed by a horizontal barrier around $0.236 and the 200-day EMA near $0.240, with a stronger cap toward $0.250 and then $0.300.

On the downside, immediate support is reinforced by the 100-day EMA around $0.220, ahead of the former uptrend line-break region near $0.210; a sustained drop through that area would expose deeper trendline-memory support closer to $0.170.
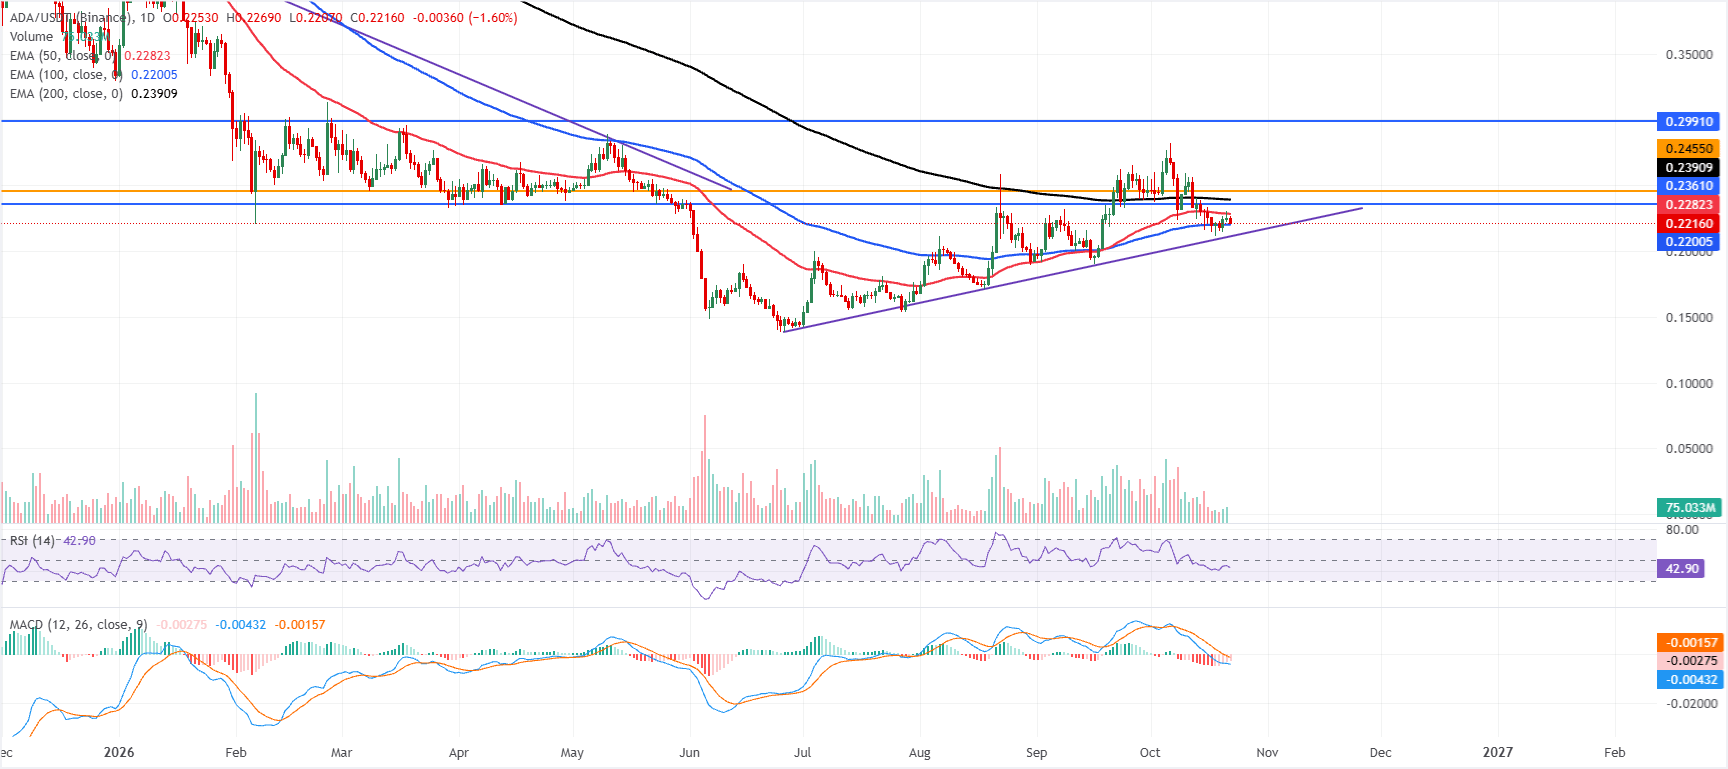
ADA/USDT daily chart

(The technical analysis of this story was written with the help of an AI tool. Know more.)

Disclaimer: For information purposes only. Past performance is not indicative of future results.
placeholder
Dollar presses 102 as the 10-year yield sits at 5.14% — and October hike odds are only 17%The dollar index closed at 101.99 (+0.20%) on Monday after briefly topping 102.07, while the 10-year Treasury yield rose to 5.14% and the 2-year hit 4.774% — yet futures price only about a 17% chance of a hike at the October 27-28 FOMC, versus roughly 90% for December. The driver is a global bond selloff, not a Fed repricing: France's 10-year OAT jumped to 4.84% ~ 4.94% and the OAT-Bund spread widened to 140 ~ 146bp. Here are the levels, the cross-asset read-through and what to watch.
Author  Irene Q.
Oct 20, Tue
The dollar index closed at 101.99 (+0.20%) on Monday after briefly topping 102.07, while the 10-year Treasury yield rose to 5.14% and the 2-year hit 4.774% — yet futures price only about a 17% chance of a hike at the October 27-28 FOMC, versus roughly 90% for December. The driver is a global bond selloff, not a Fed repricing: France's 10-year OAT jumped to 4.84% ~ 4.94% and the OAT-Bund spread widened to 140 ~ 146bp. Here are the levels, the cross-asset read-through and what to watch.
placeholder
Tesla Q3 Earnings Preview: Can Auto Margins Stabilize? Wall Street’s Highest Price Target at $550Tesla (TSLA) will report its third-quarter 2026 financial results after the U.S. stock market close on October 21, Eastern Time, and host an earnings conference call at 17:30 that day. Th
Author  TradingKey
Oct 20, Tue
Tesla (TSLA) will report its third-quarter 2026 financial results after the U.S. stock market close on October 21, Eastern Time, and host an earnings conference call at 17:30 that day. Th
placeholder
The Dow gained 500 points and the two AI names that matter fell after hours — Netflix's guide is the tellThe Dow closed 529.85 points higher at 52,495.88 (+1.02%) and the VIX fell 6.13% to 17.31, but the two stocks that carry the AI trade moved the other way after Tuesday's close: Netflix slipped to $64.74 (-5.8%) after guiding Q4 EPS of $0.67, below the street, while SpaceX jumped about 8% to near $160 on its first profit as a public company and revenue up 161%. Netflix is now below its 52-week low of $65.08. Here are the numbers, the $65 / $70 levels and the two catalysts that matter this week.
Author  Irene Q.
Yesterday 05: 56
The Dow closed 529.85 points higher at 52,495.88 (+1.02%) and the VIX fell 6.13% to 17.31, but the two stocks that carry the AI trade moved the other way after Tuesday's close: Netflix slipped to $64.74 (-5.8%) after guiding Q4 EPS of $0.67, below the street, while SpaceX jumped about 8% to near $160 on its first profit as a public company and revenue up 161%. Netflix is now below its 52-week low of $65.08. Here are the numbers, the $65 / $70 levels and the two catalysts that matter this week.
placeholder
Gold Price Analysis Today | Forex Gold Analysis | XAU/USD Analysis - October 22, 2026Get the latest gold price analysis, forex gold insights, and XAU/USD analysis for October 22, 2026. Read on for the details.
Author  Mitrade
7 hours ago
Get the latest gold price analysis, forex gold insights, and XAU/USD analysis for October 22, 2026. Read on for the details.
placeholder
The Fed will sit still on October 28 — but 100 of 100 economists now expect a December hikeA Reuters poll run October 16-20 found 94 of 100 economists expecting the Fed to hold at 3.75-4.00% on October 28 — and all 100 expecting a hike in December, against less than half a month earlier. The market is close to the same price, with CME FedWatch at roughly 17% for October and 82.8% for December. With the Fed in blackout since October 17, here are the five dates that decide the rest of the year, what each one is priced for, and the two directions each can take.
Author  Irene Q.
3 hours ago
A Reuters poll run October 16-20 found 94 of 100 economists expecting the Fed to hold at 3.75-4.00% on October 28 — and all 100 expecting a hike in December, against less than half a month earlier. The market is close to the same price, with CME FedWatch at roughly 17% for October and 82.8% for December. With the Fed in blackout since October 17, here are the five dates that decide the rest of the year, what each one is priced for, and the two directions each can take.
Related Instrument
goTop
quote