


Top Altcoins Price Forecast: Ripple, Cardano, Dogecoin face renewed selling pressure as inflation concerns mount
- Ripple hovers around $1.30 on Thursday, extending its more than 2% losses from the previous day.
- Cardano is down over 4% below its 50-day EMA at $0.2297, testing the bearish breakout of a support trendline near $0.2284.
- Dogecoin remains in the red below $0.0800 after a 3% decline the previous day amid mounting selling pressure.
Top altcoins, including Ripple (XRP), Cardano (ADA), and Dogecoin (DOGE), are trading in the red on Thursday, extending losses amid elevated US inflation concerns. The technical outlook for the altcoin indicates a downside bias as selling pressure mounts.
Hotter-than-expected US CPI fuels inflation concerns
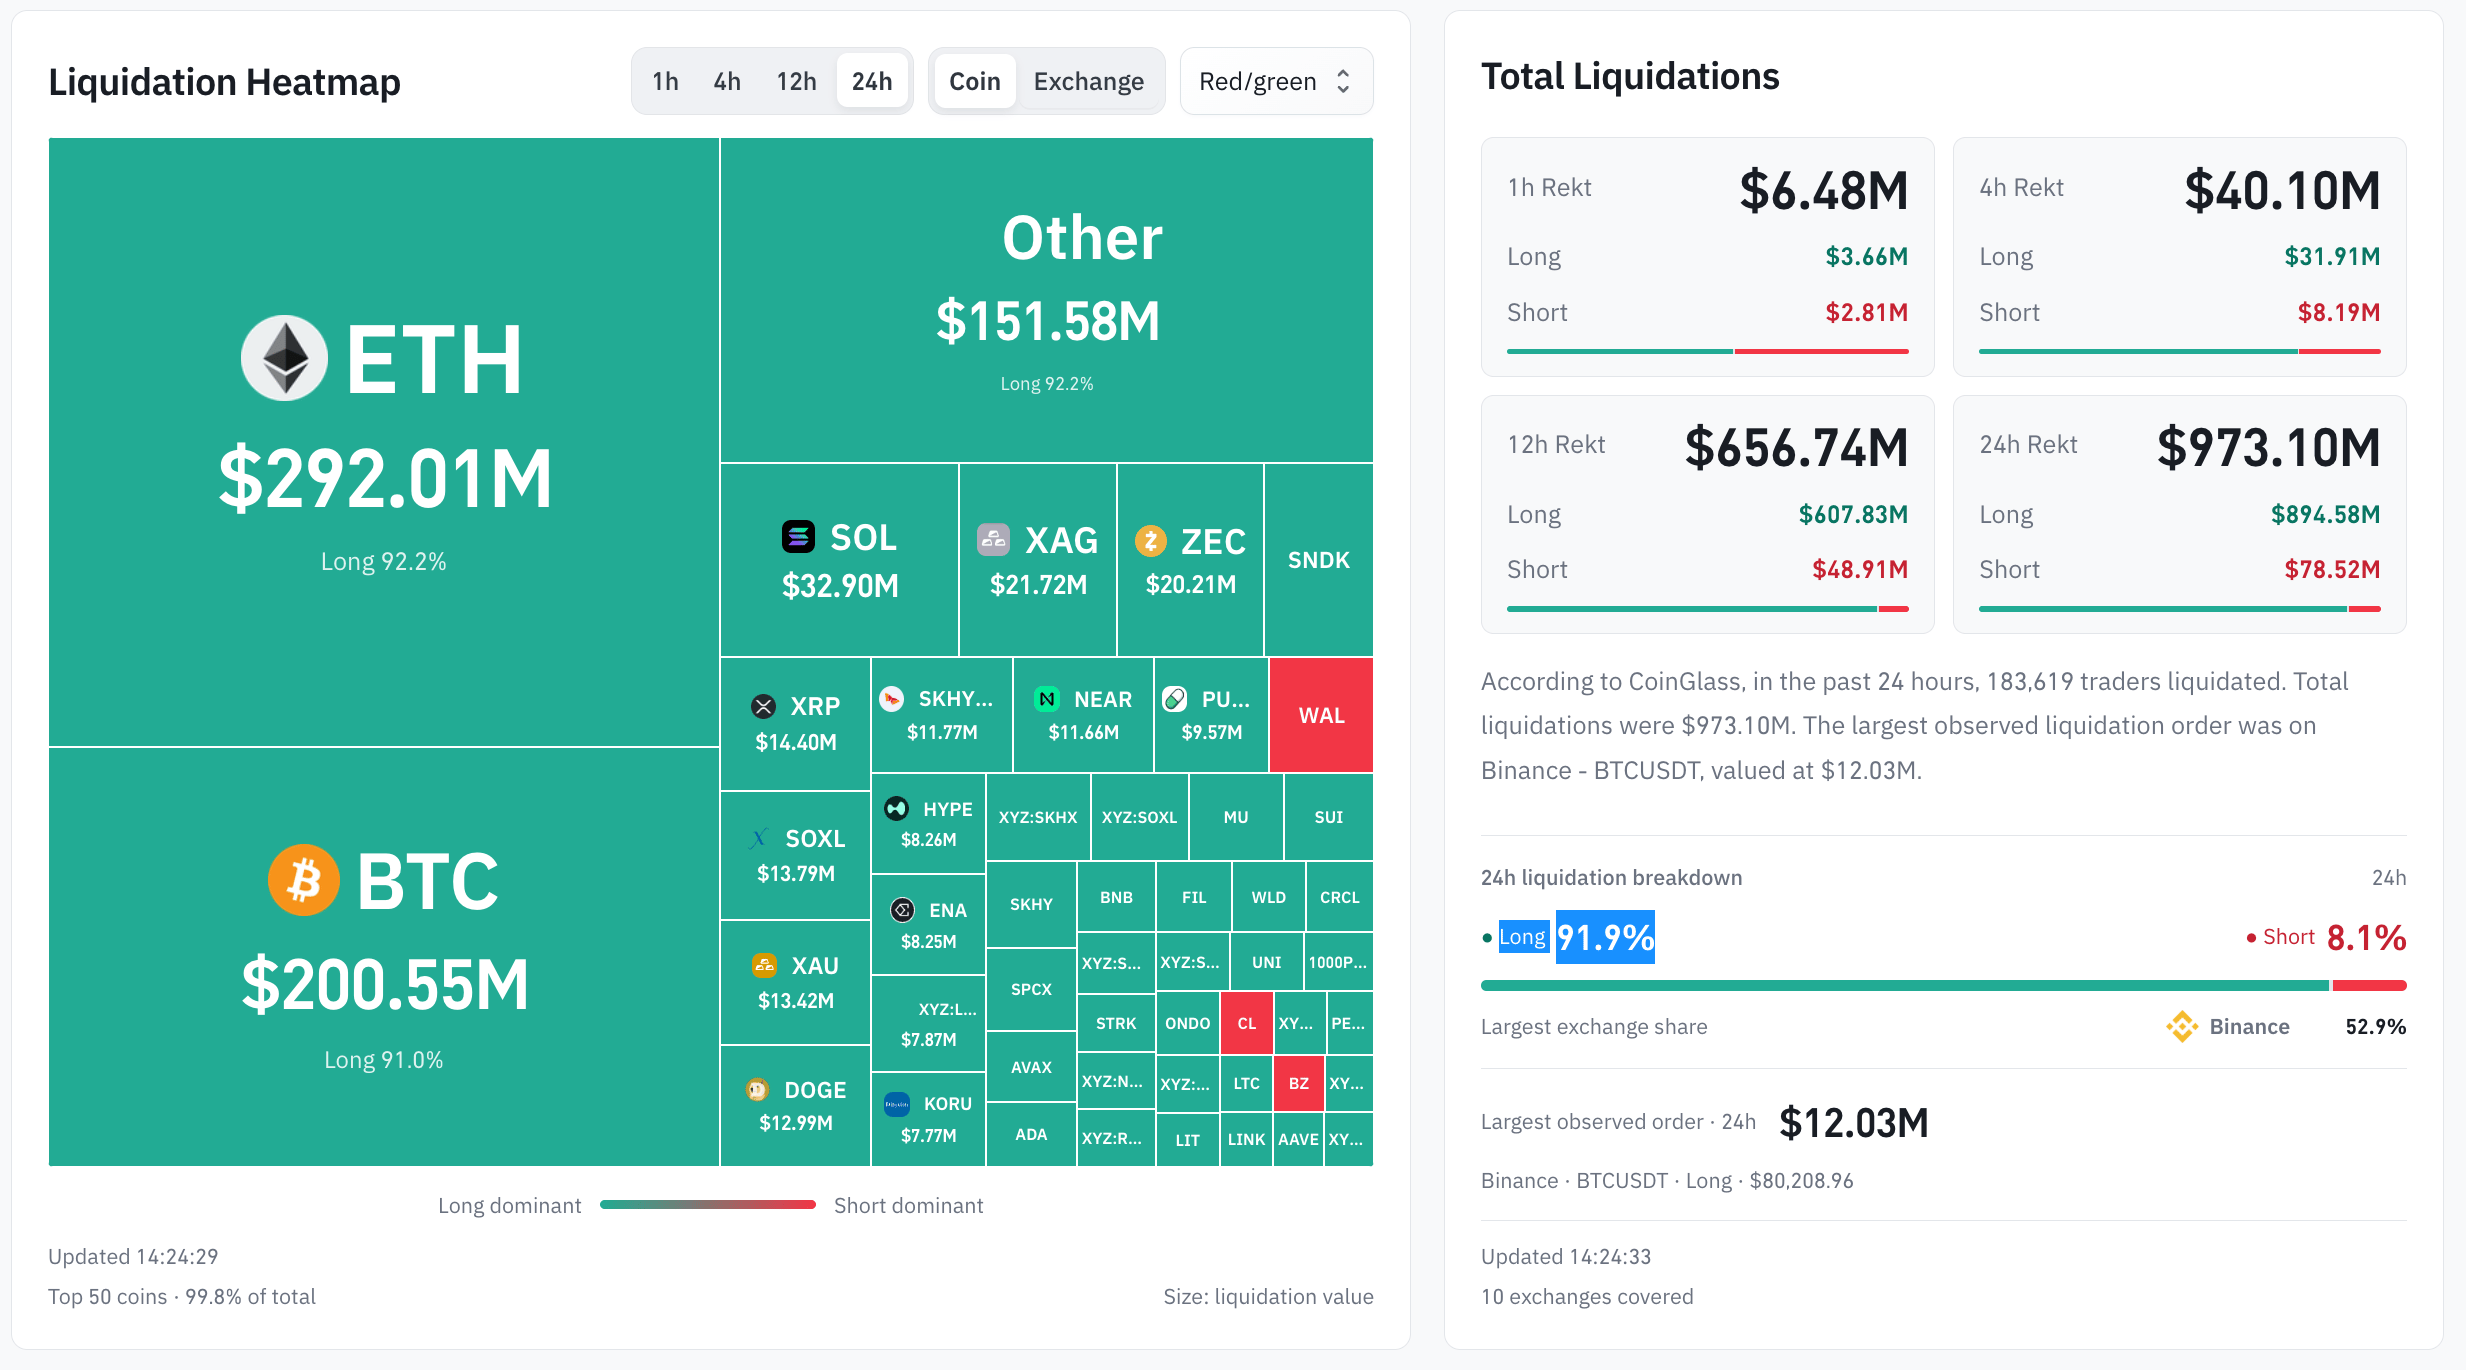
The broader cryptocurrency market has faced a surge in selling pressure over the last 24 hours. CoinGlass data show $973 million in total liquidations over the same period, led by $894 million in long liquidations. This indicates a sell-side dominance in the crypto market, likely driven by renewed inflation concerns with the release of the US Consumer Price Index (CPI) for September on Wednesday.
The US CPI print for September came in at an annual increase of 3.7%, versus the market expectation of 3.6%, raising concerns of elevated inflation and potential rate hikes by the US Federal Reserve in its next meeting on October 28.
Ripple risks a 10% downside breakout move
Ripple trades at $1.3090 at press time on Thursday, extending a bearish near-term tone following the September 23 high at $1.6581. The cross-border remittance token holds below both the 50-day and 200-day Exponential Moving Averages (EMAs) at 1.3900 and $1.3983, respectively.
From a technical perspective, XRP extends the bearish breakout of a symmetrical triangle pattern on the daily chart and tests the immediate horizontal support set by the June 15 high at $1.2941. A confirmed breakout below this level could extend the decline toward the June 8 high at $1.1866, implying a potential 10% risk.
Momentum supports the negative bias, with the Relative Strength Index (RSI) slipping toward 36 and the Moving Average Convergence Divergence (MACD) remaining in negative territory, with its line below the signal line and a subdued negative histogram, suggesting persistent downside pressure.
On the topside, initial resistance is seen at the 50-day EMA at $1.3900, followed by the 200-day EMA at $1.3983, with a stronger barrier at the descending trend resistance near $1.4308.
Cardano’s trendline breakout warns of a decline below $0.20
Cardano is down 4% so far on Thursday, extending a corrective phase below its 50- and 200-day EMAs at $0.2297 and $0.2422. ADA tests bearish breakout of an upward-sloping support line at $0.2284.
Momentum backs this soft tone, with the RSI at 41 drifting below the midline and the MACD line in sharp decline, with histogram bars expanding, suggesting firm bearish pressure.
A sustained breakout below $0.2284 could open the path toward the August 30 low at $0.1889, implying a 15% downside risk.
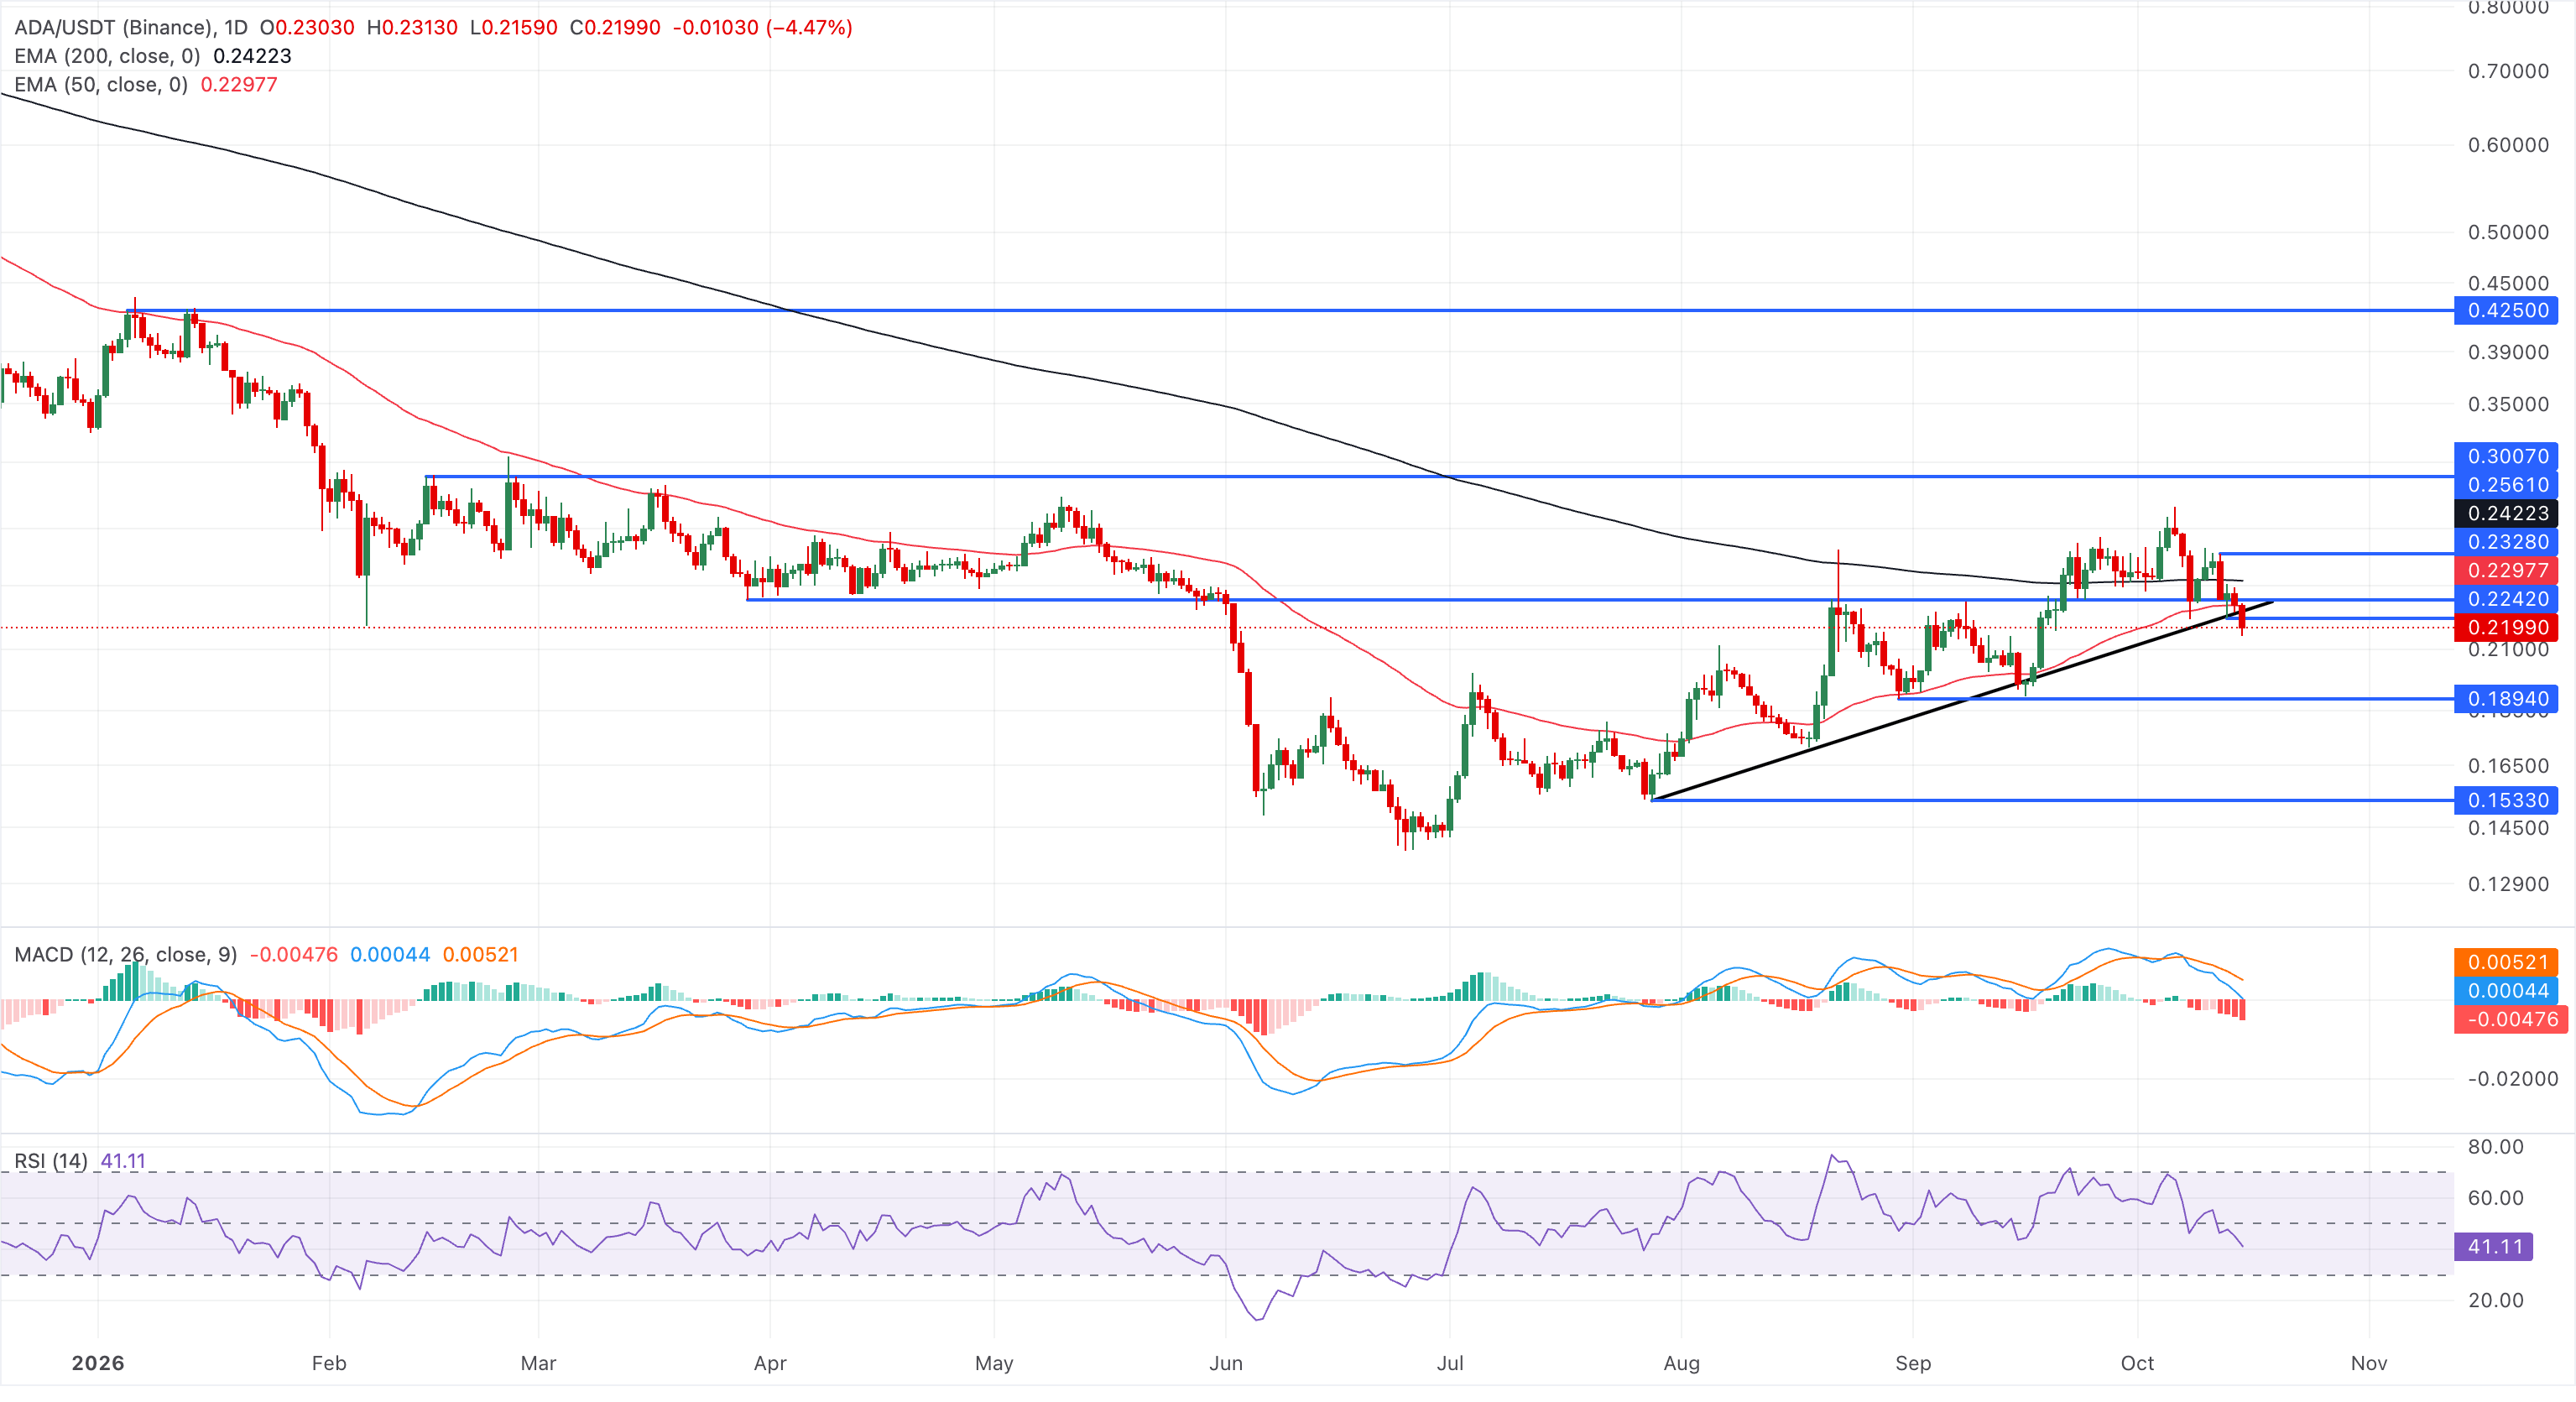
On the topside, initial resistance emerges at the broken 50-day EMA at $0.2297, forming a nearby cap that bulls would need to reclaim to stabilize the outlook. A more significant barrier lies at the 200-period EMA near $0.2422, where a daily close above it would signal a broader recovery attempt.
Dogecoin below $0.0800 eyes another lower leg formation
Dogecoin trades below $0.0800 at press time on Thursday, maintaining a clear downside trend. DOGE holds both the 50-day EMA at $0.0871 and the 200-day EMA below at $0.0927, keeping the broader trend capped.
The MACD stays in negative territory with a negative histogram reading, while the RSI near 35 hints at lingering bearish momentum and proximity to oversold conditions, suggesting sellers still control the near-term direction.
A confirmed breakout below $0.0800 signals downside risk toward the July 23 low at $0.0683, which served as a crucial support level in early August.
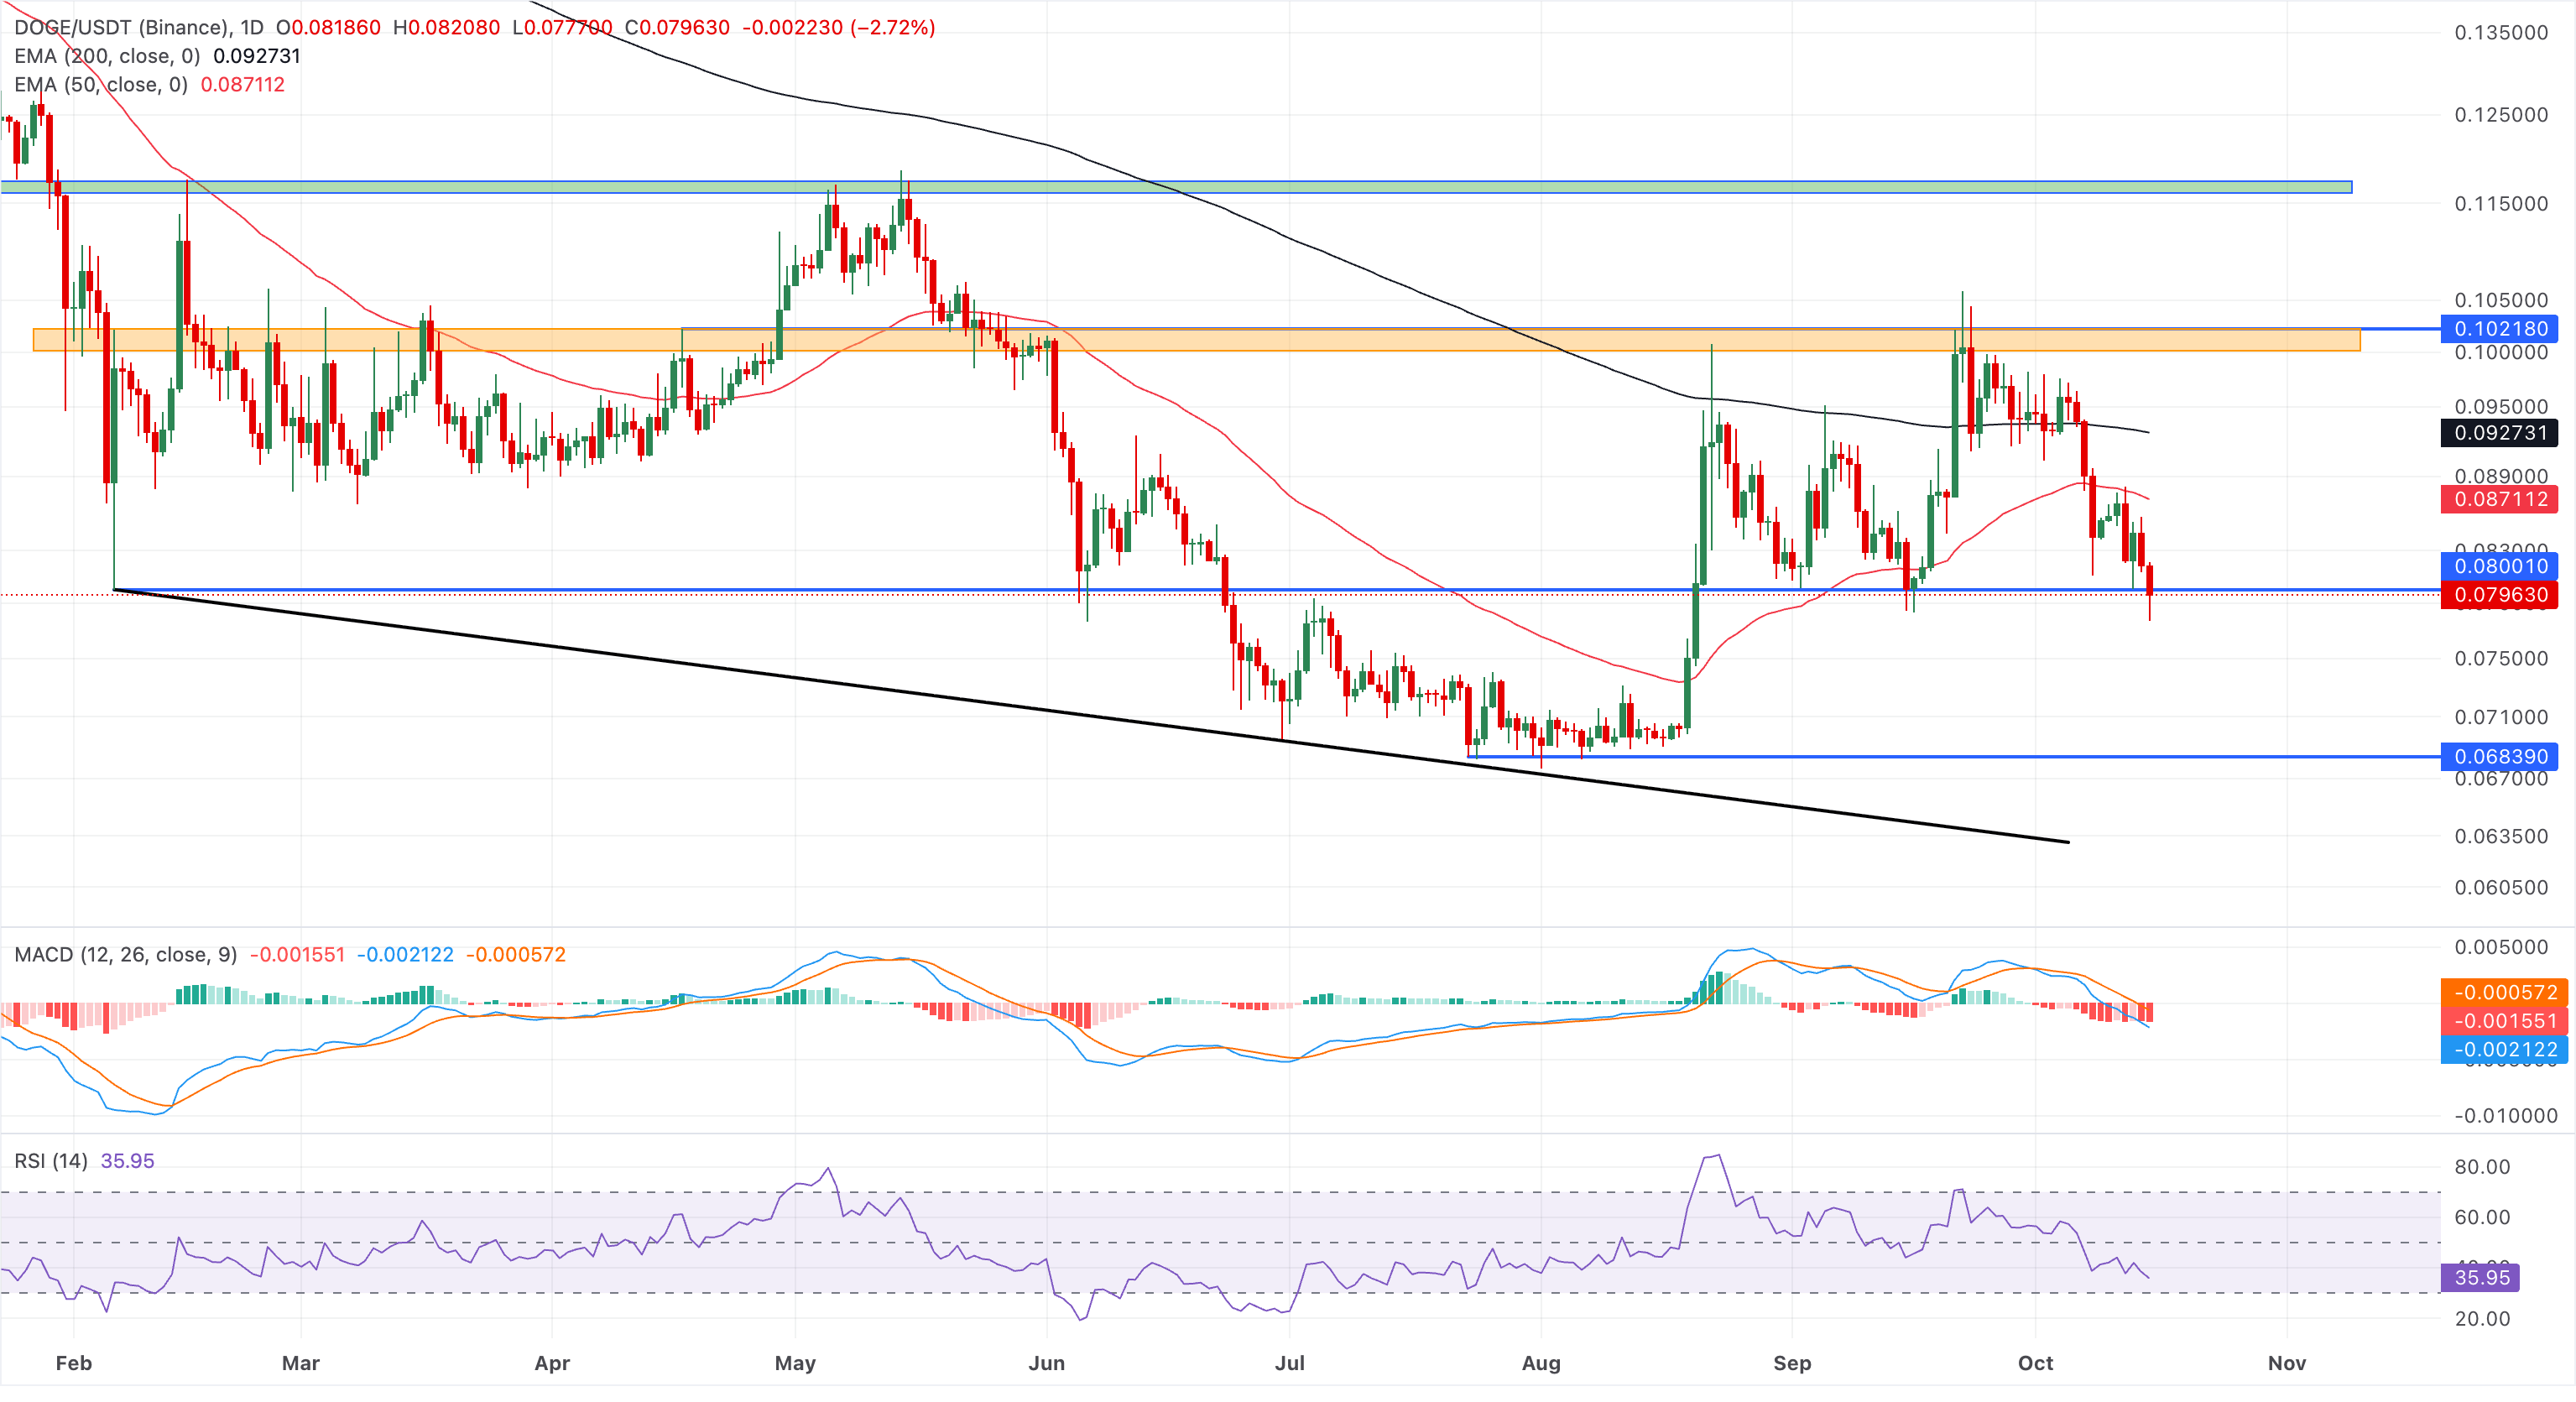
On the topside, initial resistance is seen at the 50-day EMA around $0.0871, with a stronger barrier at the 200-day EMA near $0.0927, where any recovery would likely struggle.
(The technical analysis of this story was written with the help of an AI tool. Know more.)
Recommended Articles


