

Chainlink Price Forecast: LINK trims gains after CCIP 2.0 launch, Swift ledger integration

Source Fxstreet
  • Chainlink is down over 4% on Tuesday, trading below $15.00 after a 10% jump the previous day.
  • Chainlink released its new interoperability protocol amid an integration with the Swift ledger. 
  • Institutional demand for LINK holds firm with over $2 million in inflows on Monday.

Chainlink (LINK) edges below $15.00 on Tuesday, trimming its 10% gains from the previous day, driven by the launch of its new Cross-Chain Interoperability Protocol (CCIP) 2.0 and Swift ledger integration for tokenized deposits and 24/7 cross-border payments. LINK-focused Exchange Traded Funds (ETFs) recorded over $2 million in inflows on Monday, following three consecutive weeks of inflows, suggesting strong institutional demand. 

Chainlink must reclaim the $16.60 resistance set by the October 11 low to sustain an uptrend. 

Chainlink connects banks to the SWIFT ledger and releases new CCIP 2.0

Chainlink released two major announcements at the Sibos 2026 event held by Swift on Monday. These announcements include the launch of CCIP 2.0 and its integration with Swift Ledger, enabling financial institutions to read and write access for tokenized deposits and to make 24/7 cross-border payments. The integration positions Chainlink as a bridge between traditional banks and on-chain payment services at a global scale. 

This positioning helps Chainlink gain institutional demand as the broader crypto market shifts its attention toward tokenized assets. LINK-focused ETFs recorded $2.41 million in inflows, extending last week's $6.27 million. In addition, the net inflow over the last three weeks remains positive, reaffirming firm institutional interest in LINK.
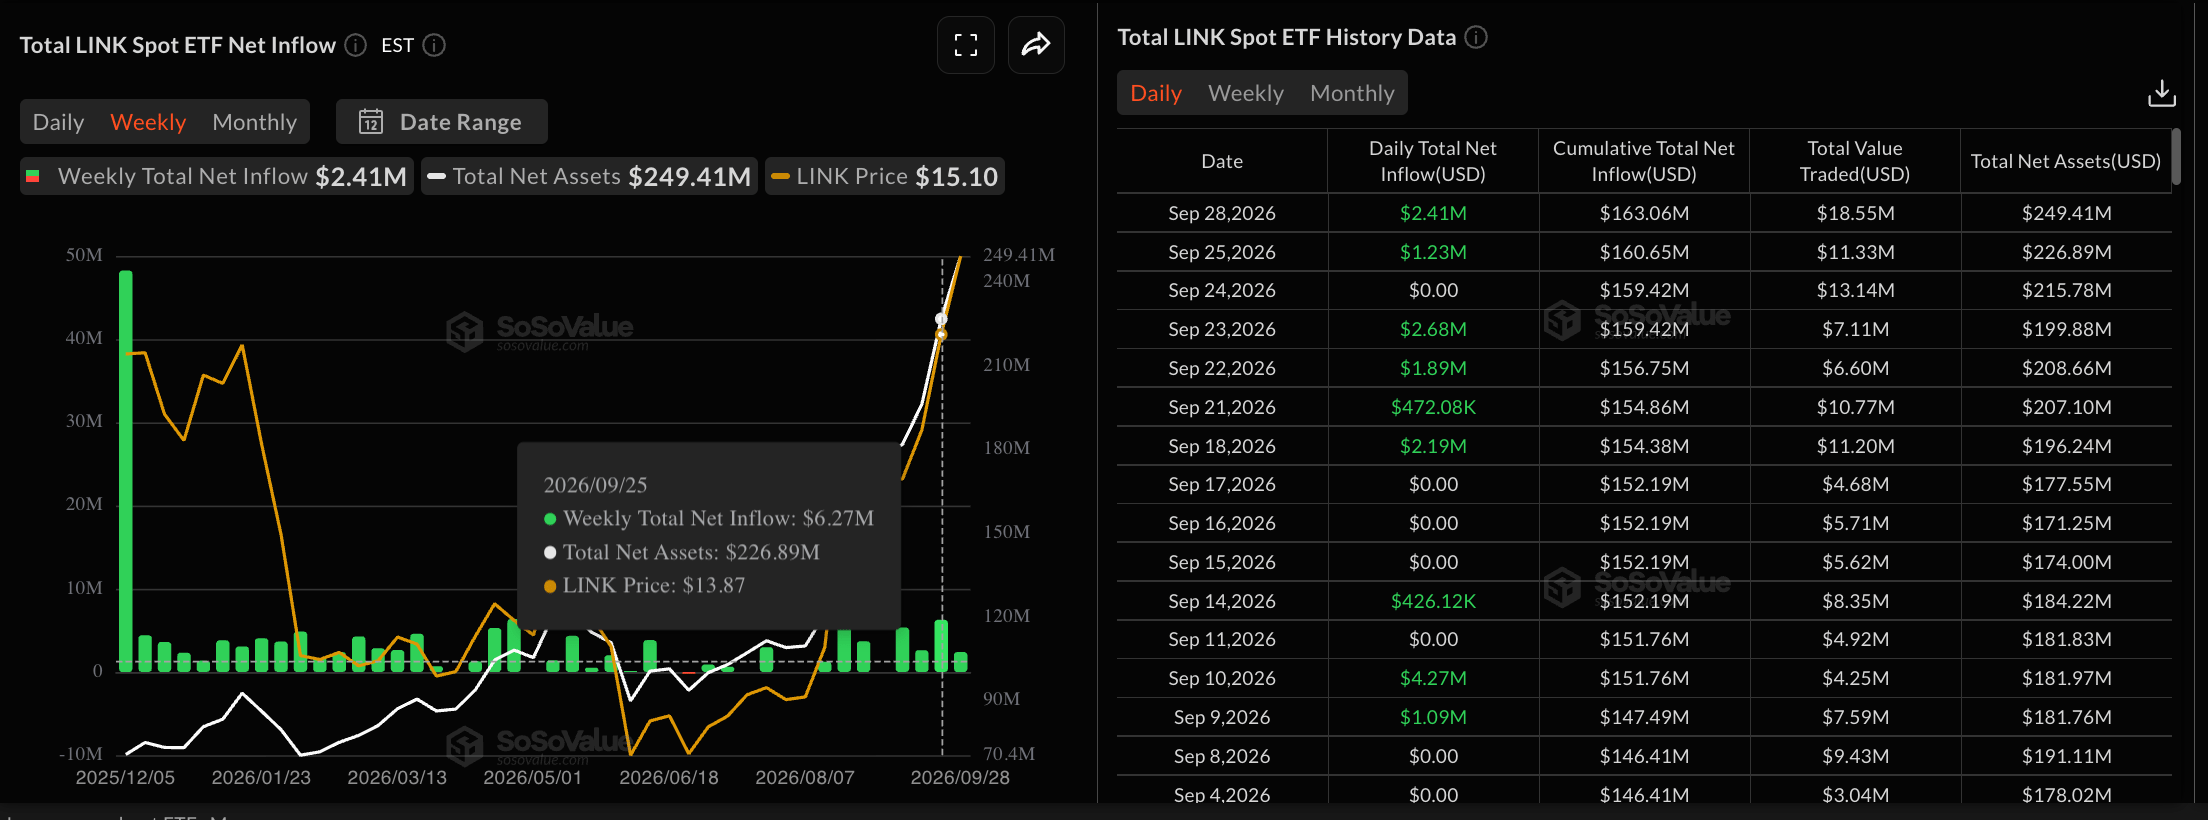
LINK ETFs data. Source: Sosovalue

Technical outlook: Chainlink trims gains as momentum stretches thin

Chainlink trades around $14.75 at press time on Tuesday, extending losses below $15.00 after earlier reaching a high of $15.77. LINK maintains a medium-term bullish bias, holding well above the 50-, 100-, and 200-day Exponential Moving Averages (EMAs) at $11.76, $10.70, and $10.44, respectively.

The rising EMAs suggest a firmly supportive broader trend, with the asset trading at fresh Year-To-Date (YTD) highs. The immediate resistance for LINK aligns with the October 11 low of $16.60, followed by the October 13 high of $20.19.

Momentum conditions reinforce this constructive bias, with the Relative Strength Index (RSI) at 66 hovering near the overbought threshold on the daily chart, while the Moving Average Convergence Divergence (MACD) remains positive, suggesting that buyers still control the near-term tone.

Chart Analysis LINK/USDT (Binance)
HYPE/USD daily price chart.

On the downside, initial technical support appears near the former November 3 low at $14.52, followed by the November 22 low at $11.74, with the 50-day EMA at $11.76 providing additional support.

(The technical analysis of this story was written with the help of an AI tool. Know more.)

Disclaimer: For information purposes only. Past performance is not indicative of future results.
placeholder
Gold ends three-week slide at the $4,400 line — eight straight days of ETF inflows vs a 5% 10-year and a 100 dollarSpot gold closed Friday at $4,378.39, up 0.84% on the day and about 0.8% for the week — its first weekly gain in four weeks — with the intraday high of $4,399.67 leaving it 33 cents shy of the $4,400 line. Gold ETFs have now logged eight straight sessions of inflows, but with the 10-year back above 5% and the dollar index near 100, here is what decides whether this is a reversal or a bounce.
Author  Suzie
Sep 20, Sun
Spot gold closed Friday at $4,378.39, up 0.84% on the day and about 0.8% for the week — its first weekly gain in four weeks — with the intraday high of $4,399.67 leaving it 33 cents shy of the $4,400 line. Gold ETFs have now logged eight straight sessions of inflows, but with the 10-year back above 5% and the dollar index near 100, here is what decides whether this is a reversal or a bounce.
placeholder
October hike odds climb toward 60% as Goldman and BofA both flip — what Warsh's "dose of accommodation" really changedRate futures now price roughly 55% to 62% for a 25bp hike at the October 27-28 FOMC, up from about 30% before Chair Warsh's post-meeting framing that the Fed is merely "removing some accommodation." Goldman Sachs has added an October hike to its forecast and Bank of America now sees moves in both October and December. Here is the repricing, the language behind it, and the two data points that decide it.
Author  Irene Q.
Sep 23, Wed
Rate futures now price roughly 55% to 62% for a 25bp hike at the October 27-28 FOMC, up from about 30% before Chair Warsh's post-meeting framing that the Fed is merely "removing some accommodation." Goldman Sachs has added an October hike to its forecast and Bank of America now sees moves in both October and December. Here is the repricing, the language behind it, and the two data points that decide it.
placeholder
Four jobs reports in five days: what JOLTS, ADP, claims and the September payrolls mean for the October Fed decisionThe US labour market faces its densest data week of the month. JOLTS job openings land Tuesday (7.2 million expected), ADP on Wednesday (70,000 expected), initial claims on Thursday and the September non-farm payrolls on Friday (100,000 expected, down from 162,000). Markets price a 64%-70% chance of another quarter-point Fed hike on October 28. The dollar index sits at 100.77 and the S&P 500 at 7,729.8.
Author  Mitrade
Yesterday 06: 33
The US labour market faces its densest data week of the month. JOLTS job openings land Tuesday (7.2 million expected), ADP on Wednesday (70,000 expected), initial claims on Thursday and the September non-farm payrolls on Friday (100,000 expected, down from 162,000). Markets price a 64%-70% chance of another quarter-point Fed hike on October 28. The dollar index sits at 100.77 and the S&P 500 at 7,729.8.
placeholder
Nvidia's $150 billion buyback landed — and the AI sector fell anyway. That's the signal worth tradingNvidia closed up 1.68% at $228.86 on 28 September after announcing a $150 billion share repurchase authorisation, the largest single corporate buyback on record, while the rest of the AI complex sold off: AMD -3.6%, Micron -2.6%, Meta -4.8% and the Philadelphia Semiconductor Index -1.61%. The divergence is not noise. Capital is rotating toward cash-flow certainty, not abandoning the AI theme. With Micron reporting after the close on 30 September, here is what the split means.
Author  Irene Q.
8 hours ago
Nvidia closed up 1.68% at $228.86 on 28 September after announcing a $150 billion share repurchase authorisation, the largest single corporate buyback on record, while the rest of the AI complex sold off: AMD -3.6%, Micron -2.6%, Meta -4.8% and the Philadelphia Semiconductor Index -1.61%. The divergence is not noise. Capital is rotating toward cash-flow certainty, not abandoning the AI theme. With Micron reporting after the close on 30 September, here is what the split means.
placeholder
The 30-year Treasury just hit a 22-year high — and the bond market is not pricing the Fed, it is pricing the deficitThe 30-year Treasury yield closed at 5.56% on 28 September, the highest since June 2004, while the 10-year reached 5.24% and the 20-year 5.60%. The curve has steepened roughly 30bp in eight sessions even as October hike odds sit at 70.3%. That gap is the story: the long end is repricing fiscal and inflation risk, not policy. With PCE on Wednesday and payrolls on Friday, here is what the long end is really saying.
Author  Irene Q.
7 hours ago
The 30-year Treasury yield closed at 5.56% on 28 September, the highest since June 2004, while the 10-year reached 5.24% and the 20-year 5.60%. The curve has steepened roughly 30bp in eight sessions even as October hike odds sit at 70.3%. That gap is the story: the long end is repricing fiscal and inflation risk, not policy. With PCE on Wednesday and payrolls on Friday, here is what the long end is really saying.
Related Instrument
goTop
quote