


AUD/USD Price Forecast: Key trigger is RBA’s policy on Tuesday
- The Australian Dollar attracts slight bids near 0.7000 against the US Dollar.
- The RBA is almost certain to hike interest rates on Tuesday.
- Traders price in two more Fed interest rate hikes this year.
The Australian Dollar (AUD) gains ground against the US Dollar (USD) on Friday after a vertical sell-off in the last two trading days. In the European trade, the Aussie pair is slightly higher to near 0.7020 after finding cushion at around 0.7000.
AUD/USD has underperformed in past few weeks as traders have become increasingly confident that the Federal Reserve (Fed) will deliver more interest rate hikes this year.
US Dollar Price This week
The table below shows the percentage change of US Dollar (USD) against listed major currencies this week. US Dollar was the strongest against the Australian Dollar.
| USD | EUR | GBP | JPY | CAD | AUD | NZD | CHF | |
|---|---|---|---|---|---|---|---|---|
| USD | 0.88% | 1.23% | 0.77% | 1.14% | 1.30% | 1.00% | 0.75% | |
| EUR | -0.88% | 0.36% | -0.07% | 0.26% | 0.42% | 0.12% | -0.13% | |
| GBP | -1.23% | -0.36% | -0.54% | -0.10% | 0.06% | -0.21% | -0.49% | |
| JPY | -0.77% | 0.07% | 0.54% | 0.40% | 0.51% | 0.24% | -0.01% | |
| CAD | -1.14% | -0.26% | 0.10% | -0.40% | 0.22% | -0.16% | -0.38% | |
| AUD | -1.30% | -0.42% | -0.06% | -0.51% | -0.22% | -0.30% | -0.61% | |
| NZD | -1.00% | -0.12% | 0.21% | -0.24% | 0.16% | 0.30% | -0.25% | |
| CHF | -0.75% | 0.13% | 0.49% | 0.01% | 0.38% | 0.61% | 0.25% |
The heat map shows percentage changes of major currencies against each other. The base currency is picked from the left column, while the quote currency is picked from the top row. For example, if you pick the US Dollar from the left column and move along the horizontal line to the Japanese Yen, the percentage change displayed in the box will represent USD (base)/JPY (quote).
The CME FedWatch tool shows an almost 58% chance that the Fed will hike interest rates in both remaining policy meetings this year.
Going forward, the next major trigger for the Aussie pair is the Reserve Bank of Australia’s (RBA) monetary policy announcement on Tuesday.
Market experts believe that the odds of the RBA hiking interest rates at the policy meeting next week have increased due to upbeat Australian job data for August released on Thursday.
Strategists at Brown Brothers Harriman note that with the latest domestic data firming expectations for further policy tightening. According to BBH, “Australia’s August labor force report reinforced the case for a 25bps RBA hike to 4.60% next week (90% priced-in),” after the economy “added more jobs than expected (actual: +39.5k, consensus: +20k, prior: -15.9k) driven by part-time employment (+45.8k vs. -30.8k in July).”
AUD/USD Technical Analysis
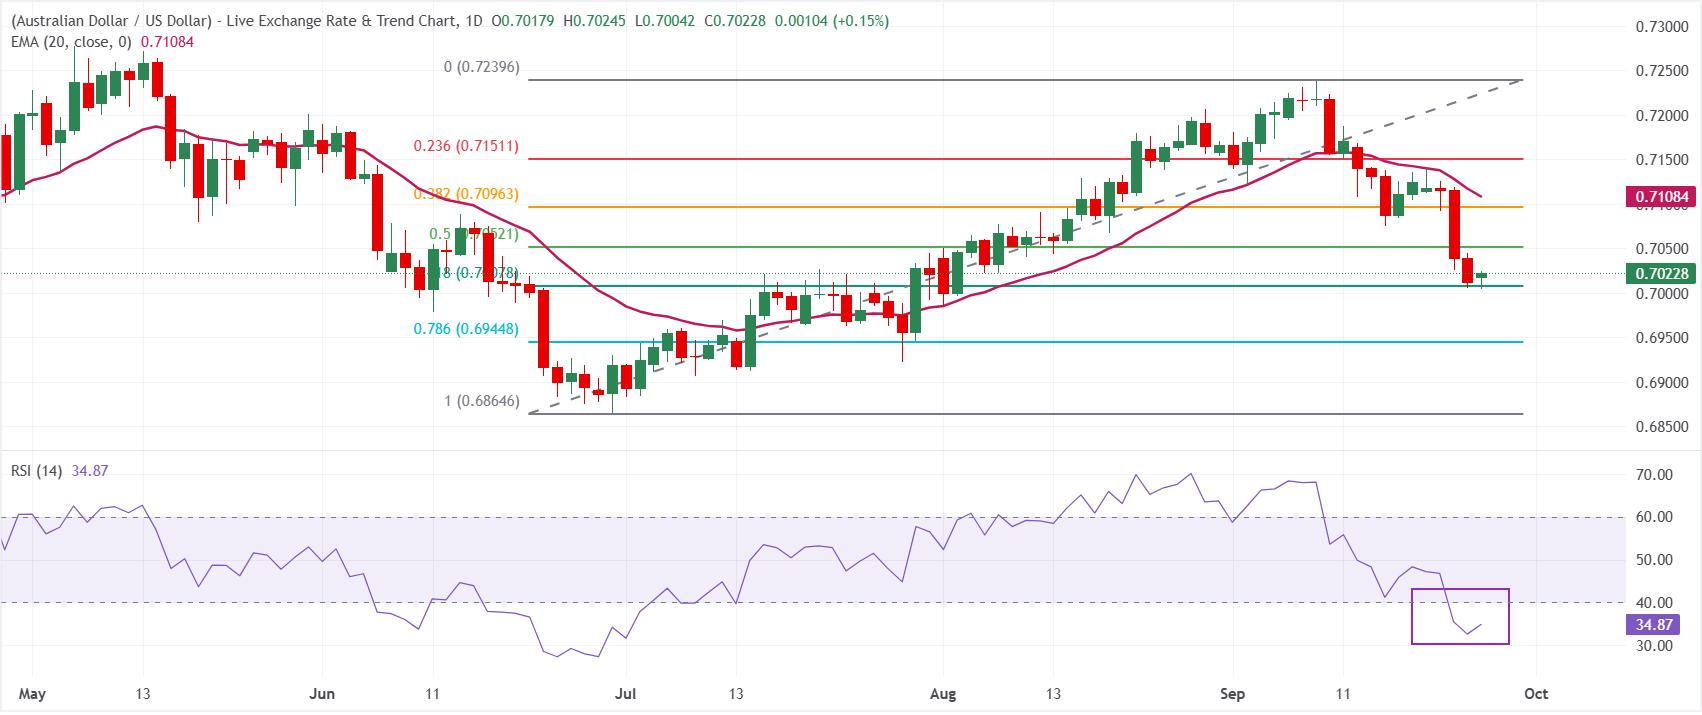
In the daily chart, AUD/USD trades at 0.7023, maintaining a bearish near-term tone as spot holds beneath the 20-period exponential moving average (EMA) at 0.7108 and a series of Fibonacci retracements acting as overhead supply. The pair has slipped back below the 50.0% retracement at 0.7052 and the 38.2% level at 0.7096, while the Relative Strength Index (14) near 34.9 hints at building downside momentum rather than outright oversold exhaustion.
On the downside, immediate support is located at the 61.8% Fibonacci retracement at 0.7008, ahead of the 78.6% level at 0.6945 and the 100% retracement base at 0.6865. On the topside, initial resistance is seen at the 50.0% retracement at 0.7052, followed by the 38.2% level at 0.7096, the 20-period EMA at 0.7108, and the 23.6% retracement at 0.7151, with the 0.7240 Fibonacci anchor marking a more distant barrier for any sustained recovery attempt.
(The technical analysis of this story was written with the help of an AI tool. Know more.)
Economic Indicator
RBA Interest Rate Decision
The Reserve Bank of Australia (RBA) announces its interest rate decision at the end of its eight scheduled meetings per year. If the RBA is hawkish about the inflationary outlook of the economy and raises interest rates it is usually bullish for the Australian Dollar (AUD). Likewise, if the RBA has a dovish view on the Australian economy and keeps interest rates unchanged, or cuts them, it is seen as bearish for AUD.
Read more.Next release: Tue Sep 29, 2026 04:30
Frequency: Irregular
Consensus: -
Previous: 4.35%
Source: Reserve Bank of Australia
Recommended Articles


