

US Cocoa Futures (COCOA-F) Is down 2.00% on Oct 21: Key Drivers to Watch

Source Tradingkey

US Cocoa Futures (COCOA-F) is down 2.00% at Oct 21 05:35(ET), now at $5679.5, with a 7-day down of 0.77%.
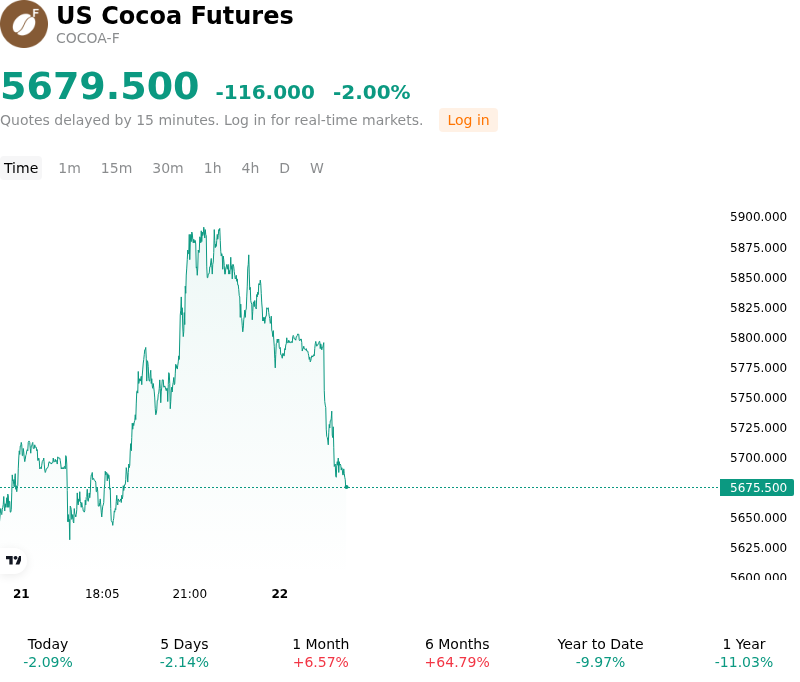
SummaryOverview

What is driving US Cocoa Futures (COCOA-F)’s stock price down today?

The pullback in cocoa futures was primarily driven by profit-taking and long liquidation following a brief upside move, as traders reassessed near-term supply availability against an uneven global demand backdrop. Institutional market participants locked in gains after recent price strength, responding to the ongoing progression of the West African main-crop harvest, which is gradually increasing bean deliveries to export terminals and easing immediate spot availability concerns.

On the supply side, the seasonal acceleration of harvesting activities in top-producing regions, including Côte d'Ivoire and Ghana, brought additional physical volume into the supply chain. Although structural challenges such as crop disease, aging cocoa trees, and long-term weather uncertainty continue to cast a shadow over total output for the crop year, the immediate flow of main-crop arrivals provided sufficient near-term liquidity to weigh on prompt futures contracts.

Demand expectations also contributed to the downside momentum due to contrasting regional processing indicators. While third-quarter grindings data reflected localized rebounds in Europe and Asia, weak processing figures in North America signaled persistent consumer price sensitivity and cautious buying among chocolate manufacturers. This divergence capped bullish sentiment, preventing buyers from defending higher price levels.

From a macroeconomic and technical perspective, a firmer US dollar and key technical resistance near recent multi-week highs catalyzed technical selling and systematic fund repositioning. The intraday move represents a tactical repricing driven by short-term supply inflows and demand uncertainty rather than a structural reversal. Institutional investors remain focused on weekly port arrival rates, West African weather patterns, and the net global market deficit trajectory.

Technical Analysis of US Cocoa Futures (COCOA-F)

Technically, US Cocoa Futures (COCOA-F) shows a MACD (12,26,9) value of 40.711, indicating a neutral signal. The RSI at 49.657 suggests neutral condition and the Williams %R at 52.707 suggests neutral condition. Please monitor closely.
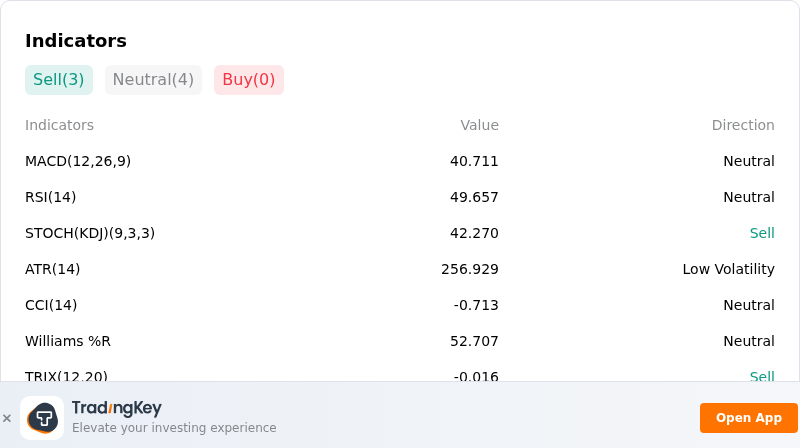
IndicatorAnalysis

More details about US Cocoa Futures (COCOA-F)

Recent Events and Risks:

  • Rising Exchange Inventories and Spot Cushion: ICE exchange warehouse cocoa stocks have climbed to multi-year highs following strong regional harvest deliveries, expanding near-term available inventory and weighing on prompt futures contract pricing.
  • Downstream Demand Destruction and Sluggish Grindings: Recent processing and grinding data across European and North American markets highlight ongoing demand rationing, with major confectionery producers trimming sales guidance and pricing to offset falling consumer volume.
  • Surging Port Deliveries and Producer Unloading: Heavy cumulative shipments arriving at West African ports, coupled with reduced government-set farmgate prices, have spurred rapid spot bean deliveries into physical export channels, dampening immediate market deficit concerns.
  • Long Liquidation and Volatility Stress: Profit-taking, speculative position unwinds, and macro headwind pressures—including US dollar fluctuations and trading house mark-to-market adjustments—have caused sharp intraday sell-offs in futures contracts.
Disclaimer: For information purposes only. Past performance is not indicative of future results.
placeholder
Gold Faces Pressure Ahead of Fed Decision as Prices Extend Drop Below $4,000 As of the Asian session on October 23, gold prices (XAUUSD) continued Thursday's decline, dipping below the $4,000 mark during intraday trading to hit a low of $3,986.54. On Thursday, gol
Author  TradingKey
10 hours ago
As of the Asian session on October 23, gold prices (XAUUSD) continued Thursday's decline, dipping below the $4,000 mark during intraday trading to hit a low of $3,986.54. On Thursday, gol
placeholder
Nasdaq closes at 26,008.86 — 8.9 points above 26,000, and the credit market never blinkedThe Nasdaq Composite fell 2.60% to 26,008.86 on October 22, its worst session since June, as Meta sank 6.98% on 2026 capex guidance of $135–145 billion. But the equal-weight S&P 500 rose 0.73%, high-yield credit was flat and 10-year yields fell 20 basis points. This was an AI de-rating, not a risk-off event — here is the transmission chain, the 29,000 / 28,200 levels and what would prove it wrong.
Author  Irene Q.
12 hours ago
The Nasdaq Composite fell 2.60% to 26,008.86 on October 22, its worst session since June, as Meta sank 6.98% on 2026 capex guidance of $135–145 billion. But the equal-weight S&P 500 rose 0.73%, high-yield credit was flat and 10-year yields fell 20 basis points. This was an AI de-rating, not a risk-off event — here is the transmission chain, the 29,000 / 28,200 levels and what would prove it wrong.
placeholder
Brent tops $113 on Saudi supply risk — but the diesel line in the EIA report is the tellBrent's December contract settled at $113.17 on October 22, up 4.00% and the highest close since May 4, after Saudi Arabia restricted refined-product shipments. The same session's EIA report showed crude stocks down 3.06 million barrels and gasoline down 2.95 million — but distillates built 1.68 million. That single line decides whether $113 holds: here are the data, the 108.8 / 114.0 / 119.3 levels and the two scenarios.
Author  Irene Q.
12 hours ago
Brent's December contract settled at $113.17 on October 22, up 4.00% and the highest close since May 4, after Saudi Arabia restricted refined-product shipments. The same session's EIA report showed crude stocks down 3.06 million barrels and gasoline down 2.95 million — but distillates built 1.68 million. That single line decides whether $113 holds: here are the data, the 108.8 / 114.0 / 119.3 levels and the two scenarios.
placeholder
Gold Price Analysis Today | Forex Gold Analysis | XAU/USD Analysis - October 23, 2026Get the latest gold price analysis, forex gold insights, and XAU/USD analysis for October 23, 2026. Read on for the details.
Author  Mitrade
15 hours ago
Get the latest gold price analysis, forex gold insights, and XAU/USD analysis for October 23, 2026. Read on for the details.
placeholder
Gold falls to two‑month low below $4,050 as oil spikesGold price (XAU/USD) falls to the lowest in more than two months near $4,025 during the early Asian session on Friday. The precious metal faces some selling pressure as escalating tensions in the Middle East send oil surging ahead of a Federal Reserve (Fed) policy meeting.
Author  FXStreet
17 hours ago
Gold price (XAU/USD) falls to the lowest in more than two months near $4,025 during the early Asian session on Friday. The precious metal faces some selling pressure as escalating tensions in the Middle East send oil surging ahead of a Federal Reserve (Fed) policy meeting.
goTop
quote