


Natural Gas - Futures (NATGAS-F) Is down 3.40% on Oct 16: What You Need to Watch
Natural Gas - Futures (NATGAS-F) is down 3.40% at Oct 16 08:25(ET), now at $3.093, with a 7-day down of 3.19%.
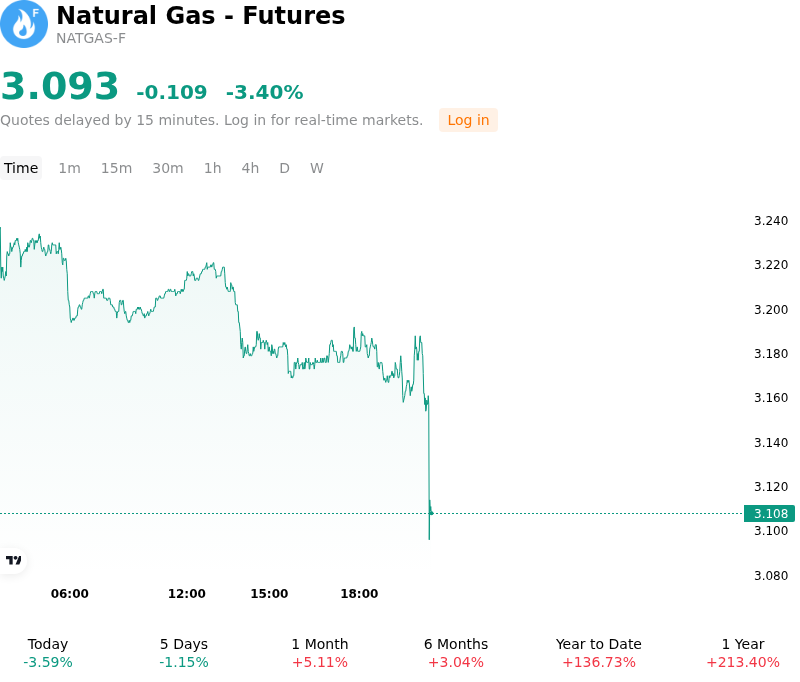
What is driving Natural Gas - Futures (NATGAS-F)’s stock price down today?
U.S. natural gas futures fell under pressure as updated weather models signaled unseasonably mild temperatures across major population centers into late October. Entering the traditional autumn shoulder season, moderate atmospheric conditions significantly reduced heating degree days while eliminating residual electricity demand for air conditioning. This drop in utility demand delayed the anticipated seasonal transition toward winter space heating, weakening prompt-month physical market demand and prompting market participants to discount the near-term risk premium.
The downside momentum was reinforced by strong supply-side fundamentals across domestic production regions. Domestic dry natural gas production remained robust, keeping physical spot hubs well supplied. At the same time, high underground storage levels entering the final weeks of the injection season reinforced expectations of comfortable inventories ahead of the winter withdrawal period. Storage levels remaining above five-year historical averages provided a substantial cushion against potential supply shocks, dampening bullish sentiment and limiting upward repricing across the forward curve.
Capacities and seasonal maintenance at key liquefied natural gas export terminals further restricted international demand from siphoning excess domestic supply. With export bottlenecks temporarily insulating domestic benchmark pricing from global natural gas movements, prompt-month contracts remained largely governed by domestic weather outlooks and inventory trajectory. Institutional investors continue to monitor winter weather model shifts, weekly storage injection trends, and LNG feedgas recovery as key indicators for subsequent market direction.
Technical Analysis of Natural Gas - Futures (NATGAS-F)
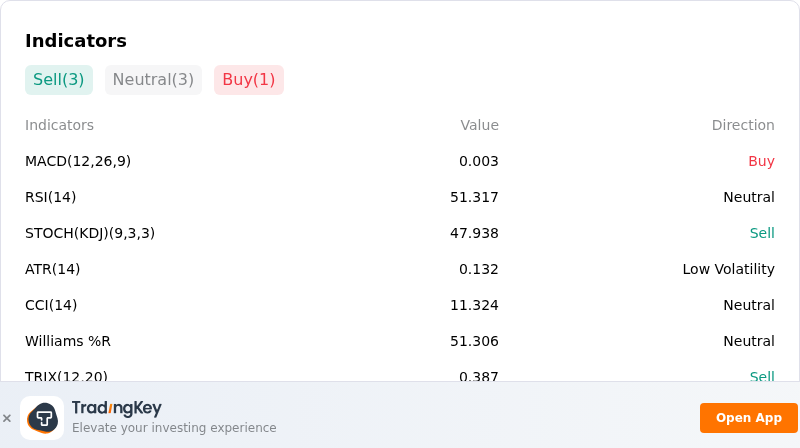
Technically, Natural Gas - Futures (NATGAS-F) shows a MACD (12,26,9) value of 0.003, indicating a buy signal. The RSI at 51.317 suggests neutral condition and the Williams %R at 51.306 suggests neutral condition. Please monitor closely.
More details about Natural Gas - Futures (NATGAS-F)
Recent Events and Risks:
- Bearish Extended Weather Outlook: Recent 6–10 and 8–14 day forecasts from NOAA and Commodity Weather Group point to above-normal temperatures across the central and eastern U.S., significantly curbing early heating degree days and suppressing residential heating demand at the start of the seasonal transition.
- Rebounding Lower-48 Natural Gas Production: U.S. dry gas production has begun recovering toward 106–108+ Bcf/d following the resolution of recent storm-related offshore shut-ins, reintroducing strong daily supply volumes into the domestic market and capping upside price momentum.
- Elevated Seasonal Storage Buffer: Energy Information Administration reports show overall working gas inventories remaining comfortably above the five-year historical average heading into late October, providing a substantial cushion against near-term supply disruptions and limiting upside price pressure.
- Technical Reversal and Positioning Unwind: November NYMEX natural gas futures triggered a sharp intraday closing price reversal top after failing to hold multi-week highs near $3.33/MMBtu, driving long liquidation and exposing support levels down toward $3.14 and $3.08.
Recommended Articles


