


Solana (SOLUSD) Volatility Intensified on Oct 16: What You Should Know
Solana (SOLUSD) is up 1.02% at Oct 16 04:40(ET), now at $105.73, with a 7-day down of 2.14%.
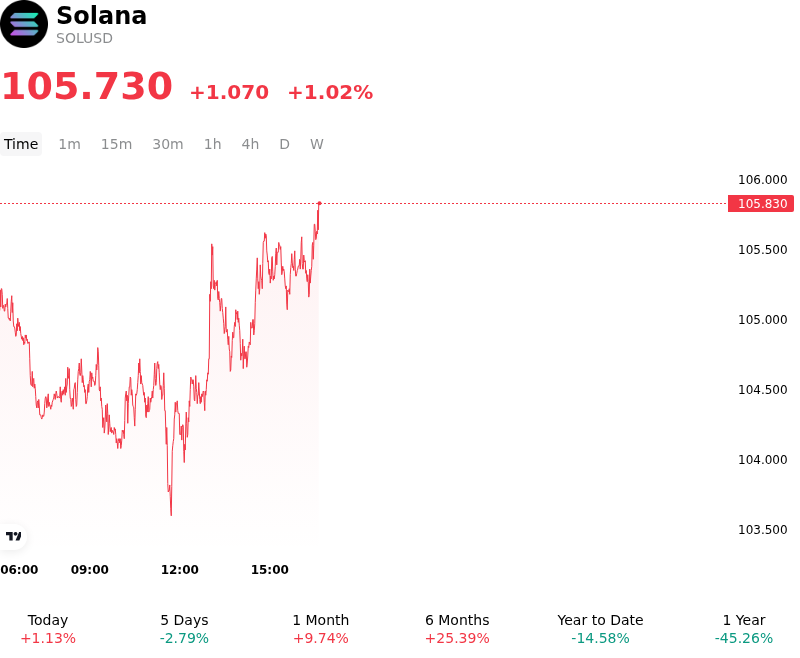
What is driving Solana (SOLUSD)’s stock price up today?
Capital inflows into Solana reflected a combination of expanding fundamental network usage and building momentum ahead of major technical upgrades. Investor sentiment was bolstered by rapidly growing adoption in tokenized real-world assets on the network, where institutional issuers have increasingly deployed tokenized Treasury products and private credit. The anticipation of the upcoming Alpenglow protocol upgrade, designed to substantially reduce transaction finality times through an optimized consensus model, further anchored long-term execution expectations. Additionally, strong on-chain metrics, characterized by steady address growth and sustained transaction volume outperforming rival Layer-1 platforms, provided underlying support for capital allocation into the asset.
Intraday volatility remained prominent as market participants absorbed mixed headlines and shifting positioning across derivatives markets. Headline developments surrounding international ecosystem expansion efforts in Asian markets introduced localized speculative swings, prompting temporary risk-off reactions and margin adjustments. Furthermore, recent net outflows from spot Solana investment products and localized liquidations across major derivatives venues created short-term selling pressure. However, strong spot demand near technical support levels helped absorb leverage-driven pullbacks, triggering short covering and stabilizing token prices above key moving averages.
From an institutional perspective, Solana continues to solidify its role as a leading smart contract platform for high-throughput financial applications and real-world asset tokenization. While broader macroeconomic liquidity and global monetary policy expectations continue to influence crypto risk appetite, network-specific fundamentals remain a key differentiator. Market participants continue to monitor execution risks surrounding upcoming network upgrades, spot ETF flow trends, and regulatory developments across key global jurisdictions as primary determinants of medium-term price stability and institutional capital retention.
Technical Analysis of Solana (SOLUSD)
Technically, Solana (SOLUSD) shows a MACD (12,26,9) value of -3.615, indicating a neutral signal. The RSI at 42.480 suggests neutral condition and the Williams %R at 71.897 suggests sell condition. Please monitor closely.
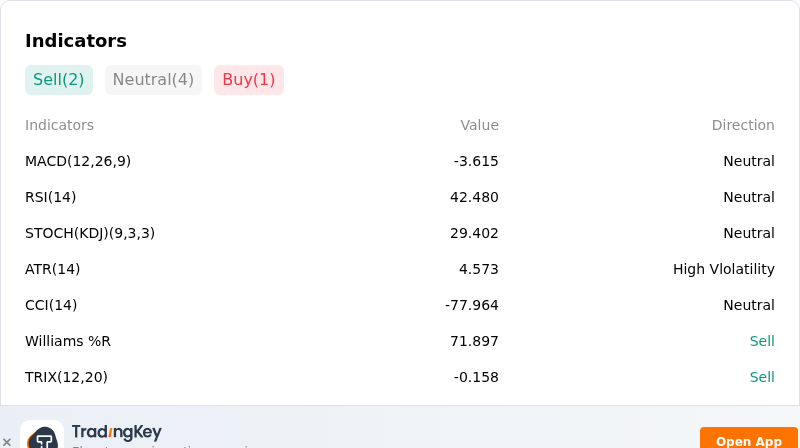
More details about Solana (SOLUSD)
Recent Events and Risks:
- Sustained Spot ETF Outflows: Solana-focused exchange-traded funds recorded their eighth consecutive session of net redemptions, dampening institutional buying pressure and weighing heavily on SOL price recovery attempts.
- Macroeconomic Headwinds and CPI Disappointment: Hotter-than-expected U.S. Consumer Price Index (CPI) data—rising 3.7% year-over-year—spurred a market-wide risk-off selloff, driving up U.S. Treasury yields and strengthening the dollar to the detriment of high-beta digital assets like Solana.
- Treasury Asset Liquidation Pressure: Significant spot sell volume hit the market after major holder SkyAI dumped approximately 1 million SOL (valued at ~$107 million) to fund corporate tender offers and buybacks, aggravating localized downside volatility.
- Derivatives Leverage Flush and Technical Support Vulnerability: A wave of long liquidations across major exchanges pushed SOL below critical support levels around $107–$111, elevating near-term cascade risks toward the psychological $100 price floor.
Recommended Articles


