

Silver/AUD (XAGAUD) Is up 2.10% on Oct 15: Why It Happened

Source Tradingkey

Silver/AUD (XAGAUD) is up 2.10% at Oct 15 03:55(ET), now at $81.447, with a 7-day down of 4.17%.
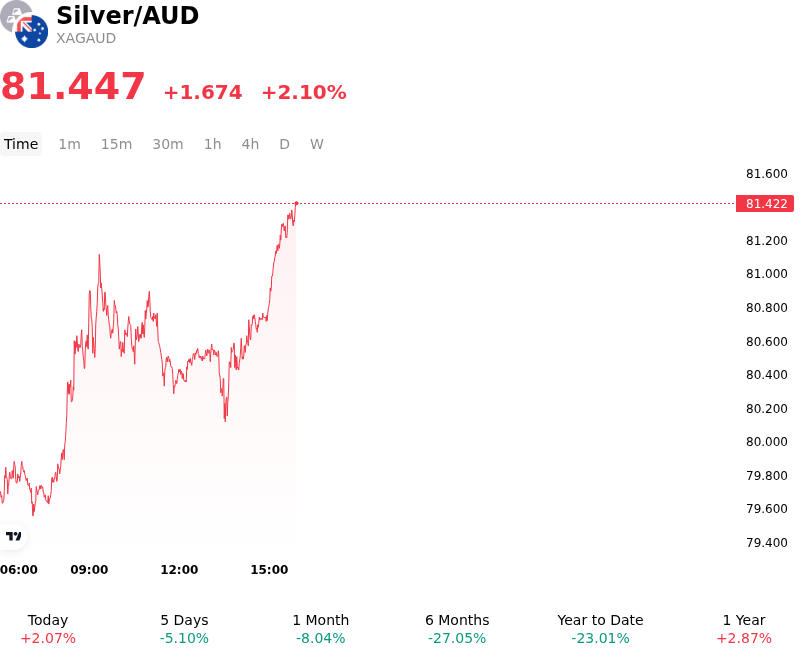
SummaryOverview

What is driving Silver/AUD (XAGAUD)’s stock price up today?

The upward movement in silver priced in Australian dollars was primarily driven by a sharp technical rebound in precious metals following recent sell-offs, alongside favorable cross-currency dynamics. As global real yields stabilized after a period of intense monetary policy repricing, institutional demand for precious metals re-emerged, encouraging opportunistic dip-buying across major trading hubs. This spot price recovery in international markets was amplified when denominated in Australian dollars, as regional foreign exchange flows reflected shifting interest rate expectations and broader growth sensitivities across commodity-exporting currencies, allowing silver to outpace the Australian dollar during the session.

Underpinning this price momentum is a persistent structural tightness in global physical silver fundamentals. Industrial demand continues to expand rapidly, driven by photovoltaic solar manufacturing, power electronics, and electrical grid infrastructure. Mine production, conversely, remains constrained by limited capital expenditure, extended project development timelines, and declining ore grades at primary extraction facilities, maintaining a multi-year structural deficit in the physical market balance. With exchange inventories remaining tightly drawn and industrial end-users actively securing long-term supply commitments, these supply constraints continue to set a firm fundamental floor under prices.

While the immediate session advance reflects a temporary event-driven reaction to oversold technical conditions, the broader medium-term outlook remains underpinned by these structural supply deficits and secular demand tailwinds. Institutional capital flows into physical bullion and exchange-traded products highlight growing investor appetite for silver as both a key industrial metal and a macroeconomic hedge. Investors continue to monitor central bank policy signals, global manufacturing purchasing managers data, and treasury yield fluctuations as primary risks that could trigger near-term volatility in non-yielding asset valuations.

Technical Analysis of Silver/AUD (XAGAUD)

Technically, Silver/AUD (XAGAUD) shows a MACD (12,26,9) value of -1.389, indicating a sell signal. The RSI at 35.992 suggests neutral condition and the Williams %R at 84.333 suggests oversold condition. Please monitor closely.
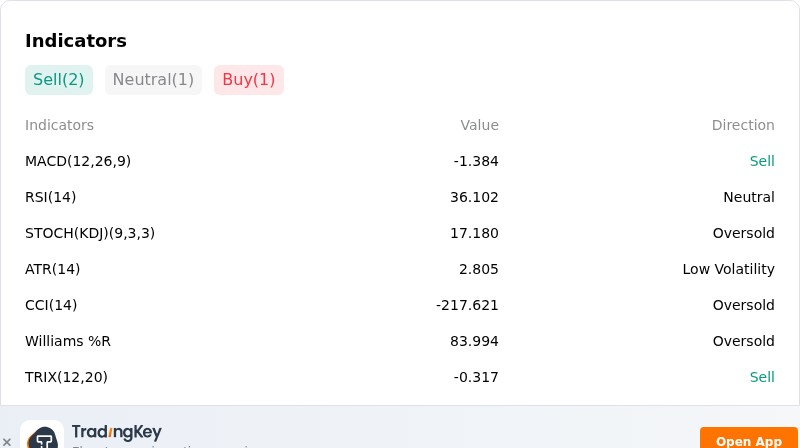
IndicatorAnalysis

More details about Silver/AUD (XAGAUD)

Recent Events and Risks:

  • Hawkish Rate Expectations and Yield Spikes: Hotter-than-expected consumer inflation data has reignited market expectations of restrictive Federal Reserve policy and potential interest rate hikes, lifting bond yields and increasing the opportunity cost of holding non-yielding precious metals.
  • Industrial Demand Weakness and Solar Thrifting: Slowing installation rates across China's solar photovoltaic sector, paired with aggressive panel manufacturing thrifting and material substitution, are undercutting physical consumption from silver's largest industrial end-user base.
  • Australian Dollar Resilience Creating Cross-Rate Drag: Firming AUD dynamics supported by resilient local economic data and hawkish Reserve Bank of Australia expectations exert foreign exchange pressure on XAG/AUD spot valuation, compounding losses seen in U.S. dollar terms.
  • Technical Support Breakdown and Managed Liquidation: Recent price action breaching key technical support levels between $58.00 and $56.50 per ounce has triggered momentum-driven speculative unwinds, increasing downside exposure toward major multi-month support targets.
Disclaimer: For information purposes only. Past performance is not indicative of future results.
placeholder
October hike odds climb toward 60% as Goldman and BofA both flip — what Warsh's "dose of accommodation" really changedRate futures now price roughly 55% to 62% for a 25bp hike at the October 27-28 FOMC, up from about 30% before Chair Warsh's post-meeting framing that the Fed is merely "removing some accommodation." Goldman Sachs has added an October hike to its forecast and Bank of America now sees moves in both October and December. Here is the repricing, the language behind it, and the two data points that decide it.
Author  Irene Q.
Sep 23, Wed
Rate futures now price roughly 55% to 62% for a 25bp hike at the October 27-28 FOMC, up from about 30% before Chair Warsh's post-meeting framing that the Fed is merely "removing some accommodation." Goldman Sachs has added an October hike to its forecast and Bank of America now sees moves in both October and December. Here is the repricing, the language behind it, and the two data points that decide it.
placeholder
Strong profits, falling shares: bank earnings day one meets a memory-chip rout — with CPI and ASML aheadGoldman Sachs blew past estimates (EPS $17.01 vs $13.09 expected, profit +33%) while JPMorgan missed ($5.75 vs $5.93) and Wells Fargo fell 3% — yet the S&P 500 finished flat at 7,805.45, pinned below its record close as a memory-chip rout (SOX −2.67%, Micron under $1,000) kept the pressure on. Tonight brings the week's decider: US September CPI at 8:30 ET, then Bank of America, Morgan Stanley, BlackRock and ASML before the open. Here are the levels, both cases, and the watch list.
Author  Irene Q.
Oct 14, Wed
Goldman Sachs blew past estimates (EPS $17.01 vs $13.09 expected, profit +33%) while JPMorgan missed ($5.75 vs $5.93) and Wells Fargo fell 3% — yet the S&P 500 finished flat at 7,805.45, pinned below its record close as a memory-chip rout (SOX −2.67%, Micron under $1,000) kept the pressure on. Tonight brings the week's decider: US September CPI at 8:30 ET, then Bank of America, Morgan Stanley, BlackRock and ASML before the open. Here are the levels, both cases, and the watch list.
placeholder
US September CPI recap: inflation hits 3.7% as core runs hot — is an October Fed hike back on the table?September CPI landed hot: headline 3.7% y/y, core 2.6% y/y and 0.3% m/m. October hike odds jumped from ~22% to ~37% — yet the dollar faded to 101.74, gold closed higher and the S&P 500 fell 1.11%. Here is the full repricing, the levels and what to watch next.
Author  Irene Q.
Yesterday 05: 52
September CPI landed hot: headline 3.7% y/y, core 2.6% y/y and 0.3% m/m. October hike odds jumped from ~22% to ~37% — yet the dollar faded to 101.74, gold closed higher and the S&P 500 fell 1.11%. Here is the full repricing, the levels and what to watch next.
placeholder
Gold defends $4,100 as BofA targets a break below $4,000 — why the Middle East bid is missingSpot gold flushed to $4,099.89, a whisker above October's $4,090 low, then rebounded to close at $4,138.25 (+0.82%) — even as US CPI ran hot. Bank of America sees gold below $4,000 within three months, citing shrinking demand and official-sector selling. Here are the levels, the drivers and what would flip the script.
Author  Irene Q.
Yesterday 06: 57
Spot gold flushed to $4,099.89, a whisker above October's $4,090 low, then rebounded to close at $4,138.25 (+0.82%) — even as US CPI ran hot. Bank of America sees gold below $4,000 within three months, citing shrinking demand and official-sector selling. Here are the levels, the drivers and what would flip the script.
placeholder
Gold Price Analysis Today | Forex Gold Analysis | XAU/USD Analysis - October 15, 2026Get the latest gold price analysis, forex gold insights, and XAU/USD analysis for October 15, 2026. Read on for the details.
Author  Mitrade
Yesterday 07: 01
Get the latest gold price analysis, forex gold insights, and XAU/USD analysis for October 15, 2026. Read on for the details.
goTop
quote