

XRP (XRPUSD) Suddenly Goes up 1.12% on Sep 25: What You Need to Watch

Source Tradingkey

XRP (XRPUSD) is up 1.12% at Sep 25 20:10(ET), now at $1.5476, with a 7-day up of 10.32%.
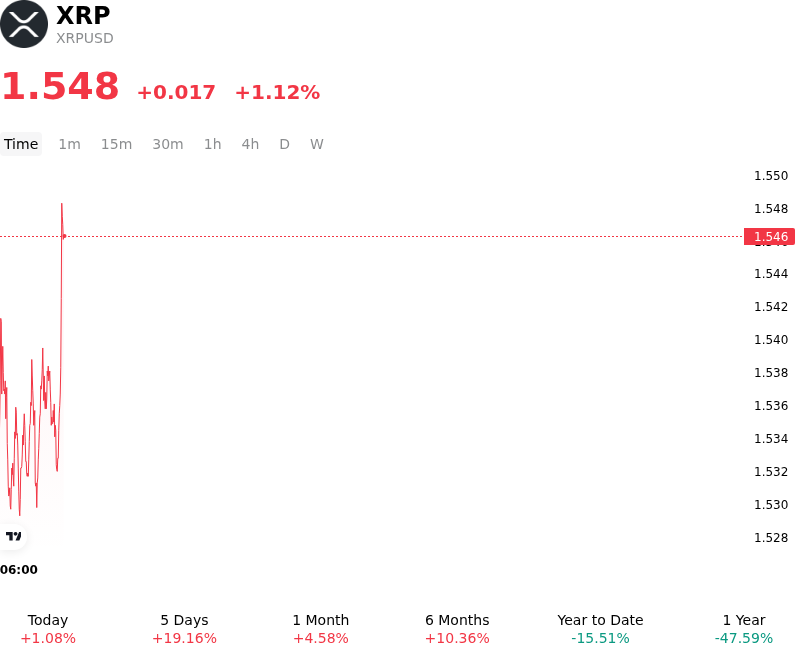
SummaryOverview

What is driving XRP (XRPUSD)’s stock price up today?

Capital inflows into XRP reflected a combination of sustained institutional demand through regulated investment products and positive sentiment surrounding network infrastructure upgrades. Investor interest gathered momentum ahead of the anticipated mainnet activation of the XRP Ledger Batch V1.1 amendment. The protocol update, which enhances network throughput by permitting multi-transaction packaging into single operations, improved adoption expectations among commercial partners and institutional liquidity providers seeking higher execution efficiency for cross-border settlement.

Market liquidity conditions were further supported by a broader stabilization across digital asset derivatives markets during a major quarterly settlement window. Following earlier leverage adjustments and short position liquidations, derivative funding rates normalized, alleviating immediate downside pressure and encouraging spot market accumulation. Capital flows into spot XRP products provided a steady bid, while whale activity showed evidence of net accumulation, effectively absorbing overhead supply at key technical support zones.

While the near-term structure benefits from network enhancements and institutional fund participation, market participants continue to monitor regulatory developments and legislative dynamics surrounding asset classification. Sustained upward momentum remains contingent on consistent spot ETF inflows, derivative market stability, and successful protocol execution. Over the longer horizon, institutional investors remain focused on real-world utility growth, enterprise liquidity adoption, and transaction volume expansion across the XRP Ledger ecosystem.

Technical Analysis of XRP (XRPUSD)

Technically, XRP (XRPUSD) shows a MACD (12,26,9) value of 0.023, indicating a buy signal. The RSI at 60.723 suggests neutral condition and the Williams %R at 29.817 suggests buy condition. Please monitor closely.
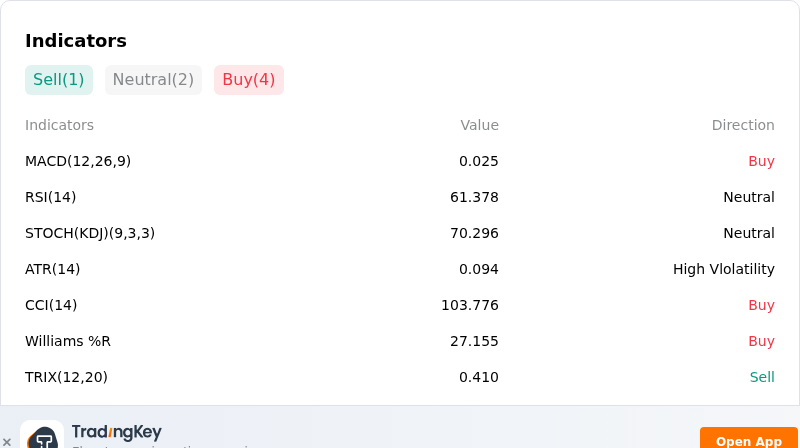
IndicatorAnalysis

More details about XRP (XRPUSD)

Recent Events and Risks:

  • Legislative Stalemate and Regulatory Overhang: The failure of the U.S. Senate to advance the Digital Asset Market Clarity Act has renewed legal uncertainty surrounding token classifications, leaving XRP vulnerable to ongoing regulatory ambiguity and curbing institutional risk appetite.
  • Leverage Liquidation Cascades: A sharp price reversal from highs near $1.65 down to $1.45 triggered over $29 million in forced long liquidations, revealing severe leverage imbalance after futures open interest reached multi-month highs on major exchanges.
  • Whale Concentration and Distribution Exposure: On-chain analytics recorded a massive surge in whale transactions exceeding $100,000 as prices hit resistance, creating heightened risk that concentrated large-wallet holders will take profits and dump holdings into weakening spot order books.
  • Macro Headwinds and Substantial Liquidity Clusters: Rising U.S. Treasury yields and broader crypto market selloffs are pressuring price action, while derivative heatmaps highlight a heavy $2.7 billion liquidation cluster concentrated near lower support around $1.00.
Disclaimer: For information purposes only. Past performance is not indicative of future results.
placeholder
WTI (USOIL) Is down 2.03% on Sep 25: Here Is WhyWTI (USOIL) is down 2.03% at Sep 24 22:20(UTC+0), now at $92.517, with a 7-day down of 3.63%.What is driving WTI (USOIL)’s stock price down today?The drop in WTI crude oil prices was primarily driven by
Author  TradingKey
17 hours ago
WTI (USOIL) is down 2.03% at Sep 24 22:20(UTC+0), now at $92.517, with a 7-day down of 3.63%.What is driving WTI (USOIL)’s stock price down today?The drop in WTI crude oil prices was primarily driven by
placeholder
Silver Price Forecast: XAG/USD remains steady near $64.00 as oil prices easeSilver price (XAG/USD) inches higher after two days of losses, trading around $63.90 per troy ounce during Asian hours on Friday. Non-yielding Silver is finding underlying support as inflation concerns ease following a pullback in crude oil prices.
Author  FXStreet
19 hours ago
Silver price (XAG/USD) inches higher after two days of losses, trading around $63.90 per troy ounce during Asian hours on Friday. Non-yielding Silver is finding underlying support as inflation concerns ease following a pullback in crude oil prices.
placeholder
Gold Price Forecast: Gold Drops Below $4,300, Will It Continue to Fall? As of the European session on September 24, gold prices (XAUUSD) extended their correction, dipping below $4,300 intraday to hit a low of $4,262.45. After previously rebounding close to $
Author  TradingKey
Yesterday 09: 57
As of the European session on September 24, gold prices (XAUUSD) extended their correction, dipping below $4,300 intraday to hit a low of $4,262.45. After previously rebounding close to $
placeholder
Yen touches 158.37 as Tokyo reopens, then slips back — ¥15.4 trillion of intervention and the 200-day line stand between here and 160USD/JPY reached 158.37 overnight, its highest since early September, then eased to 157.88 as Japanese markets reopened after a three-day holiday. The Ministry of Finance has spent ¥15.4 trillion defending the yen since late July and the BOJ ran a rate check on September 18. The 200-day average sits at 158.43.
Author  Irene Q.
Yesterday 06: 59
USD/JPY reached 158.37 overnight, its highest since early September, then eased to 157.88 as Japanese markets reopened after a three-day holiday. The Ministry of Finance has spent ¥15.4 trillion defending the yen since late July and the BOJ ran a rate check on September 18. The 200-day average sits at 158.43.
placeholder
US input costs rose at the fastest pace in four years — the September flash PMI beat is an inflation story, not a growth storyUS September flash PMIs came in far above expectations, with the composite at 58.4, a five-year high. But the detail that moved markets was input cost inflation at its fastest since October 2022, driven by fuel, transport and supply shortages. Brent is back above $100 and the 10-year Treasury yield has hit its highest since 2007.
Author  Suzie
Yesterday 06: 46
US September flash PMIs came in far above expectations, with the composite at 58.4, a five-year high. But the detail that moved markets was input cost inflation at its fastest since October 2022, driven by fuel, transport and supply shortages. Brent is back above $100 and the 10-year Treasury yield has hit its highest since 2007.
goTop
quote