


ASE Technology Holding Co Ltd Stock (ASX) Moved Down by 3.30% on Sep 23: What Signal Does It Send?
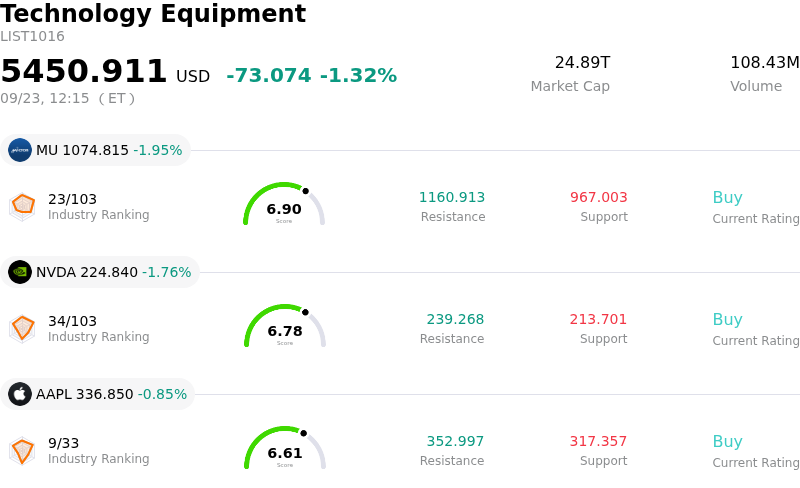
ASE Technology Holding Co Ltd (ASX) moved down by 3.30%. The Technology Equipment sector is down by 1.32%. The company underperformed the industry. Top 3 stocks by turnover in the sector: Micron Technology Inc (MU) down 1.95%; NVIDIA Corp (NVDA) down 1.76%; Apple Inc (AAPL) down 0.84%.
What is driving ASE Technology Holding Co Ltd (ASX)’s stock price down today?
ASE Technology Holding experienced a downward trading session driven primarily by profit-taking and technical consolidation following an extended multi-month rally. As the world's largest outsourced semiconductor assembly and test provider, the company has benefited immensely from robust demand across artificial intelligence hardware, advanced packaging, and testing services. Having recently reached multi-year highs after management raised revenue expectations for its leading-edge advanced packaging segment, short-term traders and institutional investors engaged in tactical profit-taking to lock in substantial gains.
Beyond short-term profit realization, market sentiment was influenced by growing scrutiny over the company's heightened capital intensity. Management has committed to an expanded capital expenditure program, allocating significant capital toward greenfield and brownfield expansion projects to scale advanced packaging and wafer testing capacity. While these substantial investments position the firm to capture long-term structural demand in high-performance computing and heterogeneous integration, they introduce near-term return-on-investment risks. Investors are carefully weighing potential capacity utilization rates, ensuring that heavy capital deployment does not pressure gross margins if legacy end-market demand experiences temporary lulls.
Broader semiconductor sector dynamics and valuation considerations further amplified intraday selling pressure. Following a sustained industry-wide surge in AI-linked equities, market participants have adopted a more cautious tone, rebalancing portfolio exposures amid broader market volatility. Given that the stock's valuation multiples have expanded relative to historical norms during the recent advance, the market showed reduced tolerance for near-term momentum stagnation. Moving forward, while ASE Technology's long-term competitive position remains solid within the advanced packaging ecosystem, stock movements in the near term will likely depend on broad sector momentum, operational execution on capacity expansion, and high utilization rates across core manufacturing facilities.
Technical Analysis of ASE Technology Holding Co Ltd (ASX)
Technically, ASE Technology Holding Co Ltd (ASX) shows a MACD (12,26,9) value of 1.351, indicating a buy signal. The RSI at 63.024 suggests neutral condition and the Williams %R at 17.222 suggests overbought condition. Please monitor closely.
Fundamental Analysis of ASE Technology Holding Co Ltd (ASX)
ASE Technology Holding Co Ltd (ASX) is in the Technology Equipment industry. Its latest annual revenue is $20.71B, ranking 13 in the industry. The net profit is $1.30B, ranking 17 in the industry. Company Profile
Over the past month, multiple analysts have rated the company as Strong Buy, with an average price target of $46.52, a high of $51.00, and a low of $42.04.
More details about ASE Technology Holding Co Ltd (ASX)
Company Specific Risks:
- Aggressive CapEx Strain on Cash Flow: Recent management guidance elevating 2026 capital expenditure to $10.5 billion across 21 greenfield and brownfield projects substantially increases capital intensity, threatening near-term free cash flow generation if facility builds outpace equipment deployment.
- Elevated Valuation and Pullback Vulnerability: Following a massive rally over the past year driven by AI packaging sentiment, financial assessments indicate significant overvaluation relative to intrinsic historical multiples, leaving the equity highly exposed to intraday profit-taking.
- Sustained Insider Share Distribution: Recent market tracking underscores significant executive insider selling exceeding $300 million over recent quarters with zero open-market insider purchases, signaling internal hesitation regarding current price levels.
- Capacity Utilization and Customer Concentration Risks: Profitability in the advanced packaging segment depends on maintaining high factory utilization for a concentrated group of top-tier AI semiconductor clients, making margins vulnerable to swift compression if customer rollout timelines stall.
Recommended Articles


