




Netflix Stock Price Forecast: Downgraded to 'Sell' by Wells Fargo, Is the Sharp Lower Open a Buying Opportunity?
TradingKey - On September 18 Eastern Time, Netflix (NFLX) fell over 6% in early trading before narrowing its decline to about 4% as of press time. The stock hit a low of $70.11, its lowest level since late July.
Wells Fargo reportedly downgraded Netflix from "Hold" to "Underweight" and sharply slashed its price target from $80 to $57, a 28% cut, citing weakening user engagement trends and content strategy challenges.
Notably, Wells Fargo's view differs significantly from current Wall Street consensus. It is currently the only bearish rating among institutions covering Netflix. According to TipRanks data, among approximately 32 institutions covering the stock, 25 give a Buy or Strong Buy rating, and 6 give a Hold; the average institutional price target is about $95, implying about 25% upside from current levels. Earlier this week, Evercore ISI also raised its price target to $110 based on household penetration in the U.S. and Japan reaching multi-year highs.
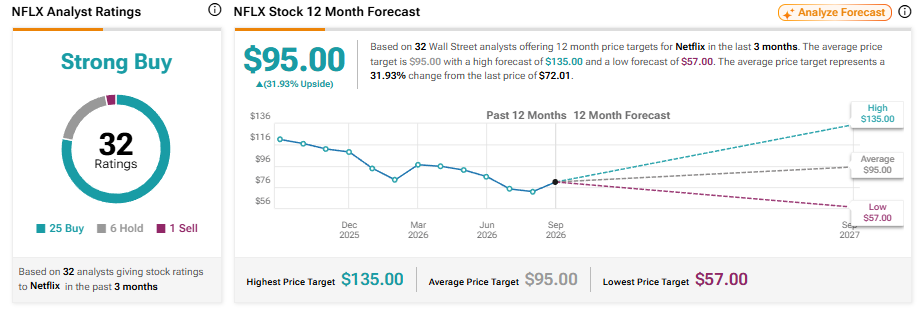
Source: TipRanks
The firm stated that Netflix's viewership in the first half of 2026 dropped 8% year-over-year, while viewing hours for the top 100 original series fell 3%. The bank's base case expects viewing hours for the top 100 original series to fall by over 20% year-over-year in the second half of this year. The report also noted that about 20% of viewing hours come from the top 100 content titles, which serve as the core driver of buzz and subscriber value.
Regarding content strategy, Wells Fargo believes Netflix is expanding content distribution to YouTube while increasing investments in gaming, documentaries, and live sports. The bank noted that while this helps broaden user reach, it also signifies a shift in content mix, risking 'missing out on viral original hits that spark nationwide discussion.'
On margins, Wells Fargo expects Netflix's content schedule in the second half of 2026 to weigh on margin performance, lowering its operating margin forecasts for 2027 and 2028 to 32.6% and 34.2%, respectively, below previous expectations. The bank also noted that Netflix faces tougher decisions on future content spending, including whether a 'reset in content spending' is required. As predictability around the company's story declines, its earnings forecasts remain slightly below Wall Street consensus.
As of September 18, Netflix's stock has fallen about 23% year-to-date, declining for several consecutive trading sessions and breaking below its 60-day moving average, with the 14-day Relative Strength Index (RSI) approaching oversold territory. The company's second-quarter revenue reached $12.56 billion, up 13.4% year-over-year, with an operating margin of 33.4%, indicating no obvious deterioration in actual financial performance.
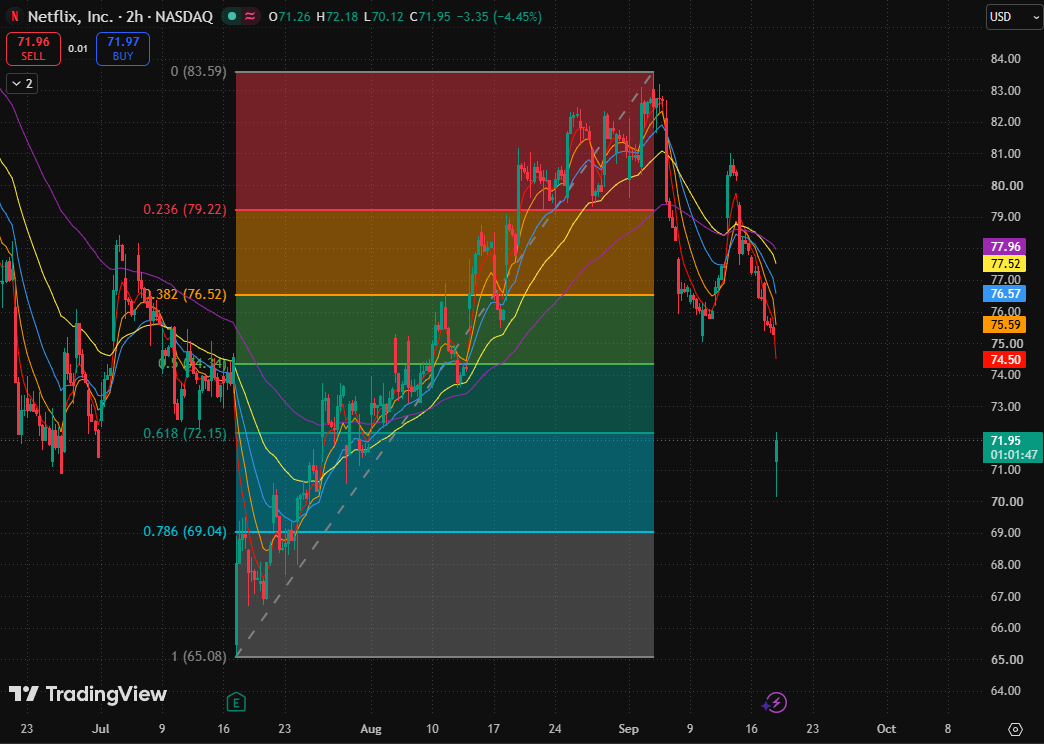
Netflix stock chart, Source: TradingView
Netflix's moving averages have now turned into a complete bearish alignment: 5-day MA < 10-day MA < 20-day MA < 80-day MA < 160-day MA, with all sitting above the current price. The 5-day moving average ($74.50) falls inside the gap, and the 10-day moving average ($75.59) sits close to the upper boundary of the gap, meaning that even if a technical bounce occurs, the primary resistance will be filling the gap rather than returning to an upward channel.
Currently, the primary support is the 0.618 Fibonacci retracement level ($72.15). If the stock price stabilizes above this level going forward, today's gap down leans more toward panic venting, with the intraday low of $70.12 below serving as a reference for a retest.
If the 0.618 Fibonacci retracement level ($72.15) is confirmed broken and cannot be reclaimed, bearish targets will quickly point to the 0.786 Fibonacci retracement level ($69.04), and in a worse scenario, the interim low ($65.08). The range from the 5-day moving average ($74.50) to the 10-day moving average ($75.59) will turn shallow rebounds into a new selling pressure zone.
To reverse the bearish sentiment to the upside, the stock must at least reclaim the 5-day moving average ($74.50) first; to truly regain strength, it needs to climb back above the overlap zone of the 0.382 Fibonacci retracement level ($76.52) and the 20-day moving average ($76.57), and reclaim the 80-day moving average ($77.52) and the 160-day moving average ($77.96). Until then, any bounce should be treated as a technical test of resistance.
Recommended Articles


