




Where Will the S&P 500 Be in 20 Years? History Has a Reassuring Answer for Investors.
Key Points
The S&P 500 has averaged an annual price return of about 8.7% over the past 70 years.
Over the past 20 years, it has had an average annualized return of about 9.3%.
At that rate, the S&P 500 would be over 43,000 in 20 years.
- 10 stocks we like better than S&P 500 Index ›
It's wild to think how rapidly the S&P 500 (SNPINDEX: ^GSPC) has progressed in recent years. Since July 2022, the S&P 500 has nearly doubled, reaching 7,681 as of Aug. 26.
From its launch in 1923, it took 45 years to reach 100 on June 4, 1968. Then it took almost 30 years to close above 1,000 on Feb. 2, 1998. It took another 16 years for the S&P 500 to reach 2,000, which it did on Oct. 31, 2014.
Missed Nvidia in 2009? This Rare Signal Is Flashing Again. In 2009, a "Double Down" signal flashed for a little-known chipmaker called Nvidia. For the first time in years, that same "Total Conviction" signal is flashing for a company 1/100th the size of Nvidia. Continue »
After that, the 2010s bull market pushed the S&P 500 to its next milestone in just five years, closing above 3,000 on Oct. 21, 2019. Then, the S&P 500 rode the post-COVID-19 pandemic rally to hit 4,000 on April 21, 2021 -- taking just 18 months to gain 1,000 points. Its road to 5,000 was slowed a bit by the 2022 bear market, so it didn't close above 5,000 until Feb. 9, 2024.

Image source: Getty Images.
In less than a year, the S&P 500 scaled the 6,000 peak on Nov. 11, 2024. And then it closed above 7,000 for the first time on April 15, 2026. As of Aug. 26, the S&P 500 is bearing down on 8,000, sitting at 7,681.
The S&P 500 at 43,000
The higher the benchmark moves, the more points it takes to achieve a certain percentage increase, so the pace at which it hits these milestones lately can be a bit deceptive. For example, a 100% increase on a benchmark at 100 brings it to 200. A 100% increase from 3,800 brings it to 7,600.
What's more important is the return that it has generated over the years. In the almost 70 years since the modern-day S&P 500 launched as a 500-company index on March 4, 1957, it has had an average annualized return of 8.7%. With the dividends reinvested, the total average annualized return is 11%.
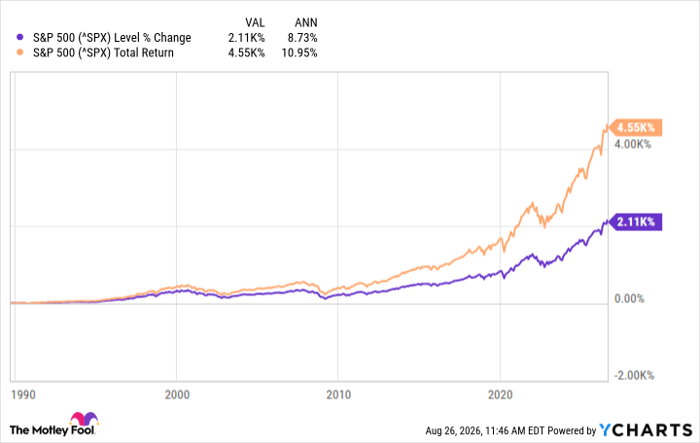
^SPX data by YCharts
While past performance is no guarantee of future results, an 11% per year return is a number that most of us would take in a heartbeat.
Now, many experts and strategists expect a slower decade for the S&P 500, mainly due to its current high valuation, among other factors. Vanguard anticipates a 5% average annual return for the S&P 500 over the next decade, while Goldman Sachs and J.P. Morgan forecast 10-year average returns of 6.5% to 6.7%.
That might be on par with the 1970s, a period marred by war and inflation, which had an average annual return of about 6%. But the index bounced back in the 1980s with a 17.5% average annual return. Also, the 2000s were basically flat, but the 2010s saw an average annual return of almost 14%.
So history tells us that even if the next 10 years are rocky, the 10 years after that could be significantly better.
Let's say the S&P 500 averaged about 9% return over the next 20 years, which would be in line with its average over the past 20 years. Where would the S&P 500 be in 20 years? Based on historical trends, it would be at just over 43,000.
Should you buy stock in S&P 500 Index right now?
Before you buy stock in S&P 500 Index, consider this:
The Motley Fool Stock Advisor analyst team just identified what they believe are the 10 best stocks for investors to buy now… and S&P 500 Index wasn’t one of them. The 10 stocks that made the cut could produce monster returns in the coming years.
Consider when Netflix made this list on December 17, 2004... if you invested $1,000 at the time of our recommendation, you’d have $439,308!* Or when Nvidia made this list on April 15, 2005... if you invested $1,000 at the time of our recommendation, you’d have $1,286,826!*
Now, it’s worth noting Stock Advisor’s total average return is 964% — a market-crushing outperformance compared to 212% for the S&P 500. Don't miss the latest top 10 list, available with Stock Advisor, and join an investing community built by individual investors for individual investors.
See the 10 stocks »
*Stock Advisor returns as of August 28, 2026.
JPMorgan Chase is an advertising partner of Motley Fool Money. Dave Kovaleski has no position in any of the stocks mentioned. The Motley Fool has positions in and recommends Goldman Sachs Group and JPMorgan Chase. The Motley Fool has a disclosure policy.
Recommended Articles


