




If a Stock Market Crash Is Coming, History Says This Investing Strategy Has Never Once Failed
Key Points
The S&P 500 and the Dow are reaching new heights, but volatility could be looming.
Some market metrics suggest that stocks could be overvalued right now.
The right strategy is key to surviving a crash, recession, or bear market.
- 10 stocks we like better than S&P 500 Index ›
Major market indexes are surging yet again, with both the S&P 500 (SNPINDEX: ^GSPC) and the Dow Jones Industrial Average (DJINDICES: ^DJI) hitting new record highs earlier this week.
However, continued volatility within the tech industry has left investors with mixed feelings about the market. While 37% of investors feel optimistic about the next six months, according to the latest weekly survey from the American Association of Individual Investors, 38% feel pessimistic and 25% are neutral.
Missed Nvidia in 2009? This Rare Signal Is Flashing Again. In 2009, a "Double Down" signal flashed for a little-known chipmaker called Nvidia. For the first time in years, that same "Total Conviction" signal is flashing for a company 1/100th the size of Nvidia. Continue »
While history suggests the market may be in risky territory, it can also offer investors a clear road map for how to prepare.
Image source: Getty Images.
Will the stock market crash in 2026?
First, it's important to note that nobody can predict the market's short-term moves, and no stock market indicator is 100% accurate. That said, sometimes these metrics can provide context for the market's recent performance and guide investors' strategies.
The Buffett indicator and the S&P 500 Shiller CAPE (cyclically adjusted price-to-earnings) ratio are popular market metrics that both offered warning signals ahead of major market downturns -- specifically, the dot-com bubble burst of the early 2000s.
The Buffett indicator was popularized by Warren Buffett in the early 2000s, who famously noted that investors are "playing with fire" when the metric nears 200%. As of this writing, the Buffett indicator is at its highest level on record, at just over 232%.
The S&P 500 Shiller CAPE ratio measures the S&P 500's long-term inflation-adjusted earnings, and it currently sits at just over 41 -- the second-highest point in history, behind its peak of 44 just before the dot-com bubble burst.
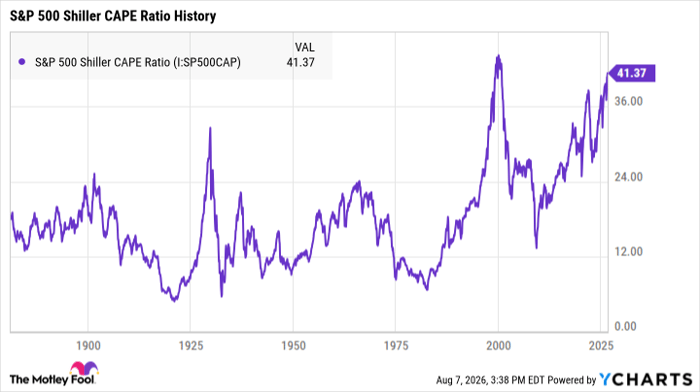
S&P 500 Shiller CAPE Ratio data by YCharts.
Again, this doesn't necessarily mean that a market crash is imminent. It does, however, suggest that the broader market may be overvalued. Over time, valuations tend to correct themselves, meaning stock prices will likely face a pullback eventually.
History says this is the best move investors can make
Regardless of when the next bear market begins, right now is the ideal time to start preparing your portfolio. And if history proves one thing, it's that keeping a long-term outlook is key to surviving volatility.
Since 1919, every single one of the S&P 500's 20-year periods has ended in positive total returns, according to analysis from Crestmont Research. This means that if you'd invested in an S&P 500 ETF or index fund at any point in history and held it for 20 years, you'd have made money.
In the last 20 years alone, the S&P 500 has earned total returns of close to 800%. In other words, if you'd invested $10,000 in an S&P 500 ETF in August 2006, you'd have around $88,000 by today with zero additional contributions.
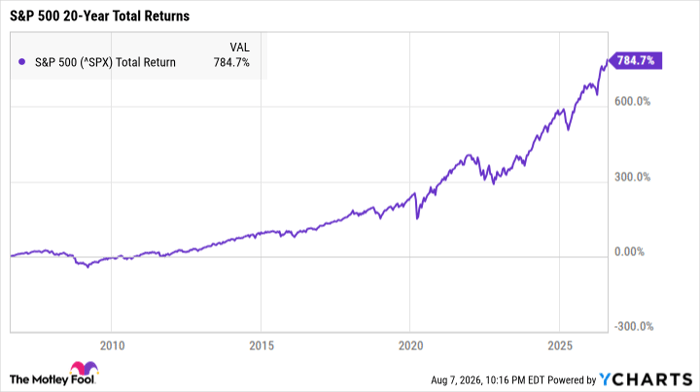
^SPX data by YCharts.
Now, not all stocks will pull through severe economic downturns. During the dot-com bubble burst, for example, hundreds of stocks crashed hard when the businesses behind them crumbled under the weight of a bear market.
The key is to invest in quality companies with robust competitive advantages -- such as a sustainable business model, a competent leadership team, and well-managed finances. While even the strongest stocks are vulnerable to volatility, history proves that with healthy stocks and a long-term outlook, your portfolio is incredibly likely to thrive over time.
Should you buy stock in S&P 500 Index right now?
Before you buy stock in S&P 500 Index, consider this:
The Motley Fool Stock Advisor analyst team just identified what they believe are the 10 best stocks for investors to buy now… and S&P 500 Index wasn’t one of them. The 10 stocks that made the cut could produce monster returns in the coming years.
Consider when Netflix made this list on December 17, 2004... if you invested $1,000 at the time of our recommendation, you’d have $399,832!* Or when Nvidia made this list on April 15, 2005... if you invested $1,000 at the time of our recommendation, you’d have $1,374,595!*
Now, it’s worth noting Stock Advisor’s total average return is 968% — a market-crushing outperformance compared to 215% for the S&P 500. Don't miss the latest top 10 list, available with Stock Advisor, and join an investing community built by individual investors for individual investors.
See the 10 stocks »
*Stock Advisor returns as of August 9, 2026.
Katie Brockman has no position in any of the stocks mentioned. The Motley Fool has no position in any of the stocks mentioned. The Motley Fool has a disclosure policy.
Recommended Articles


