


Dow Jones Industrial Average falls further as consumer sentiment crumbles
- The Dow Jones fell another 200 points on Friday as equities retreat on multiple fronts.
- The AI-centric tech segment is facing further declines in the face of high AI spend and low revenues.
- US consumer sentiment took a worrying turn, dragging market sentiment even lower.
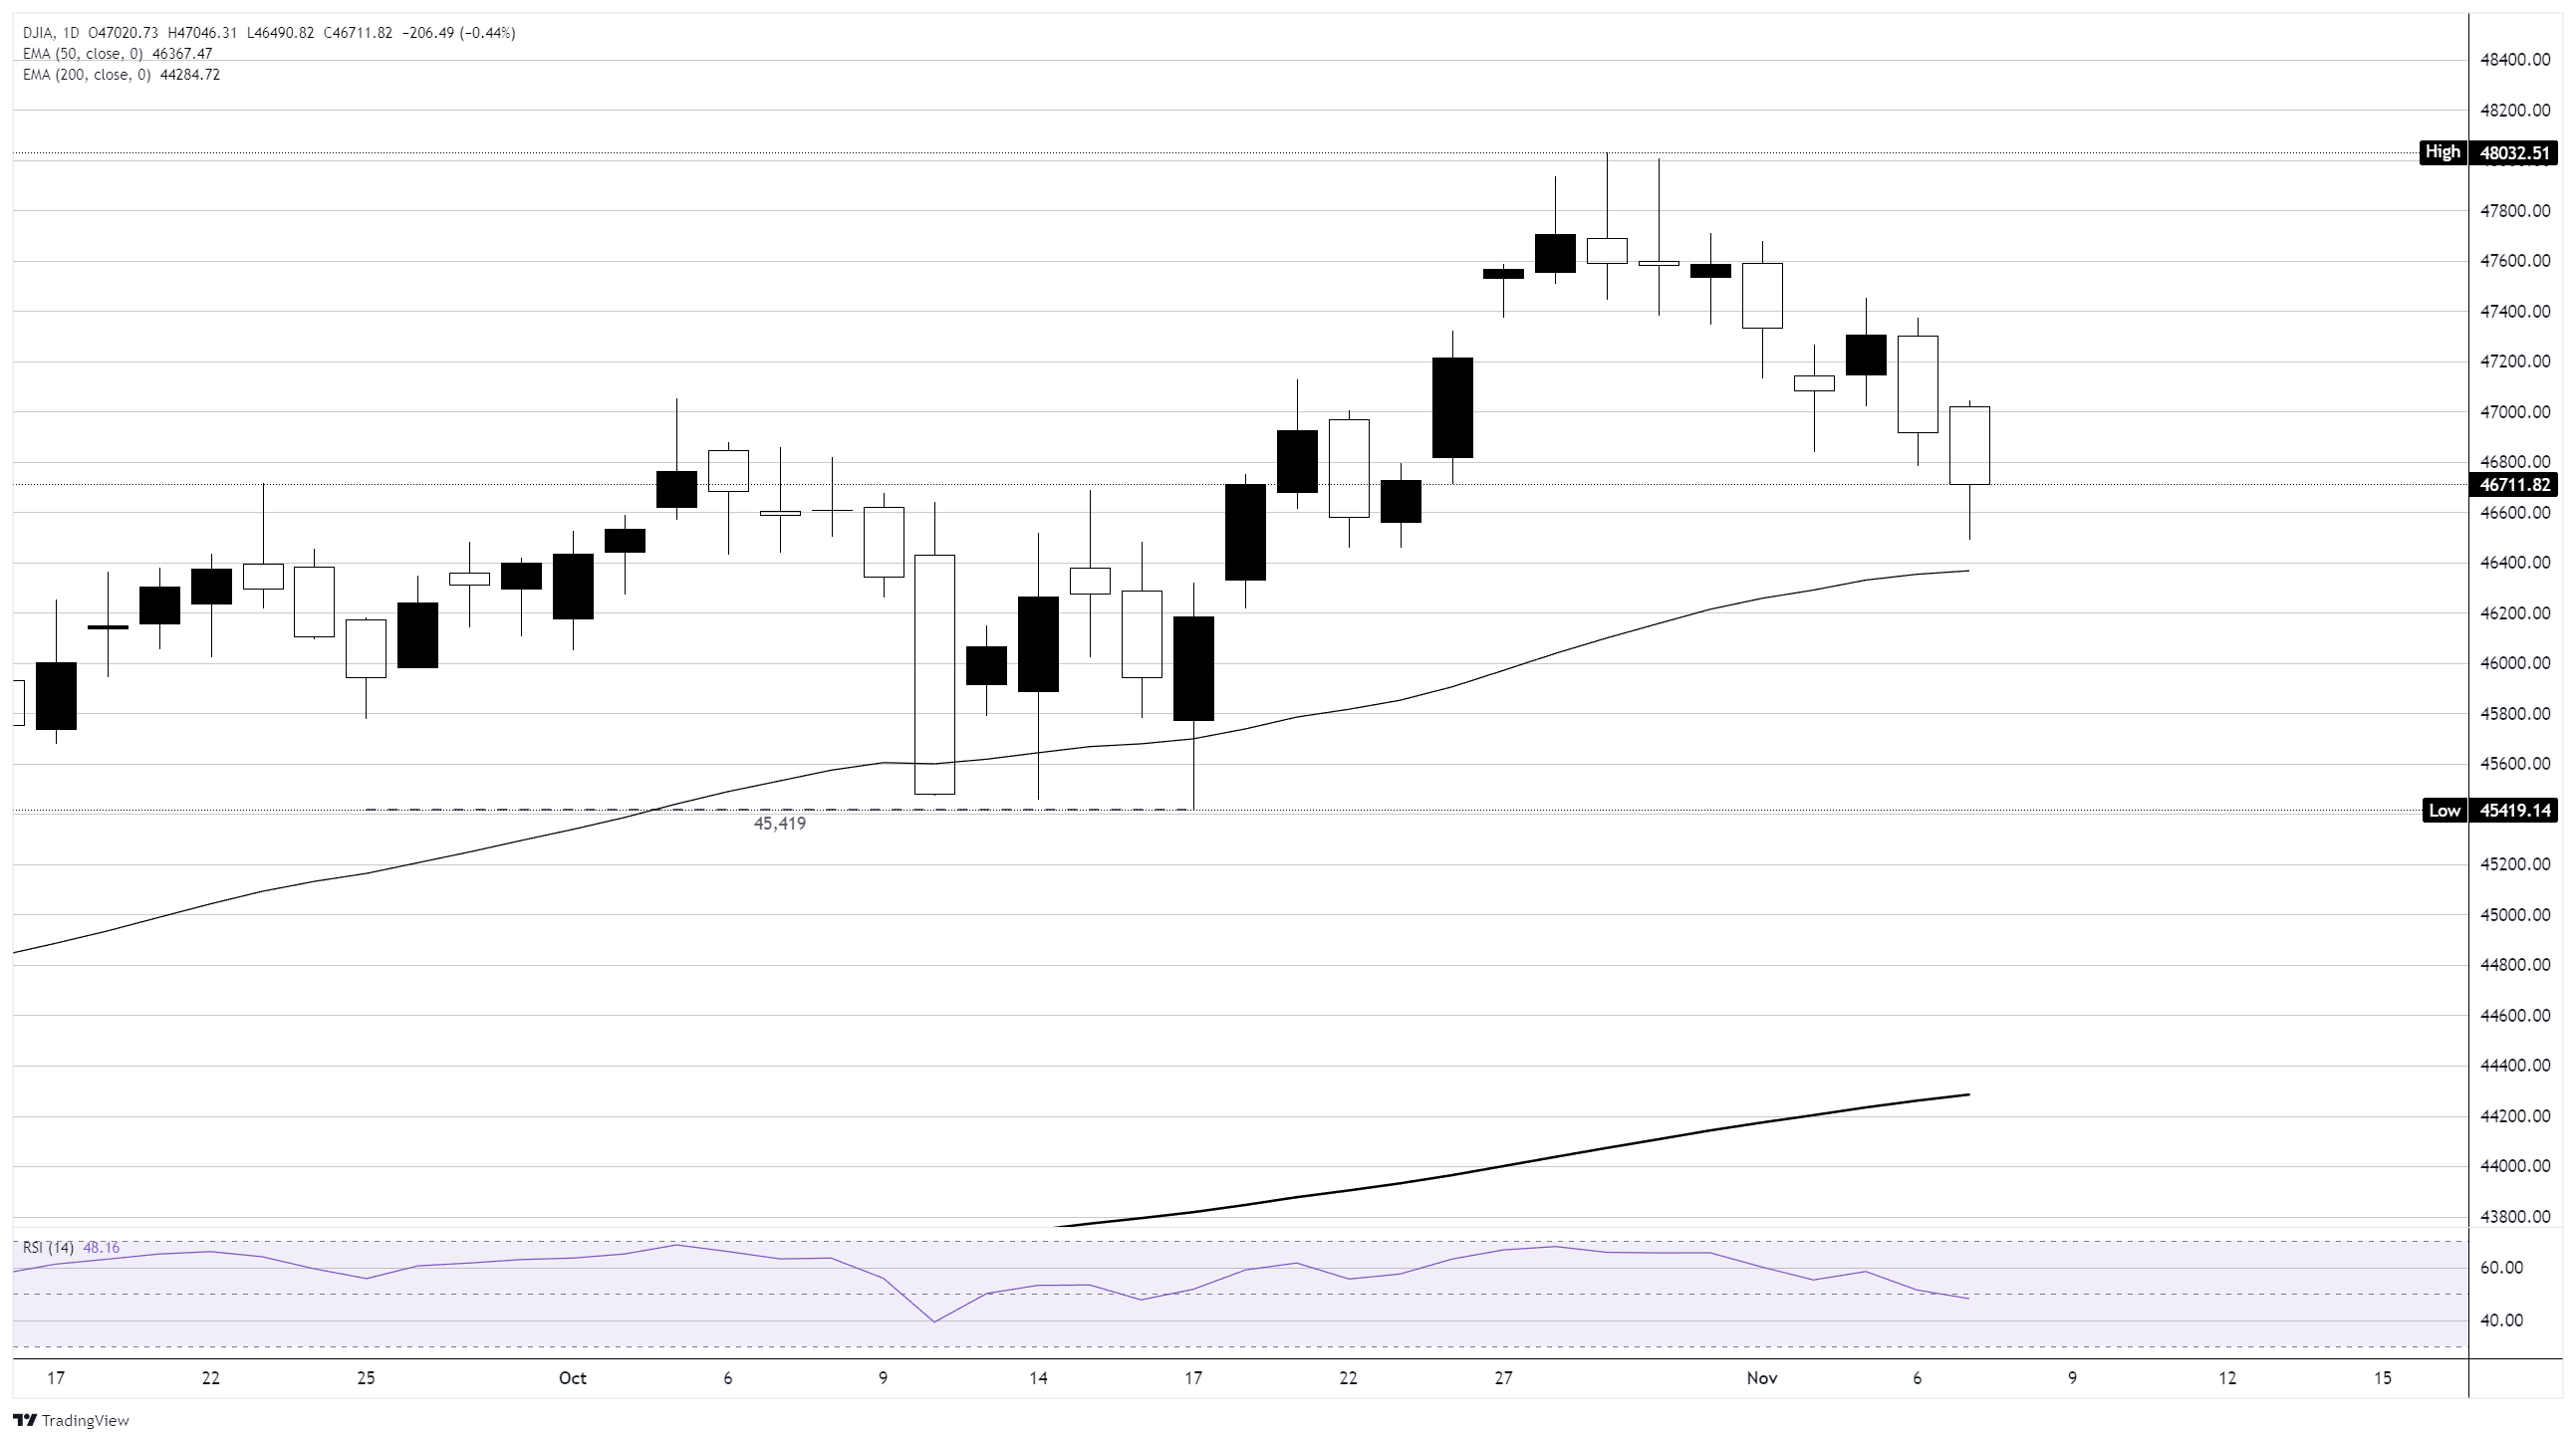
The Dow Jones Industrial Average (DJIA) took another leg lower on Friday, testing below the 46,800 level for the first time in almost three weeks as an AI stock pullback and withering consumer survey results drag down both sides of the investment-consumption equation. Friday would have seen the release of the latest US Nonfarm Payrolls (NFP) jobs report, but the ongoing US government shutdown, which is officially the longest shutdown in US history, is crimping the flow of official data, leaving investors to grapple with volatile private data, and putting deep question marks where key inflation and employment numbers should be.
Consumer sentiment takes a knee
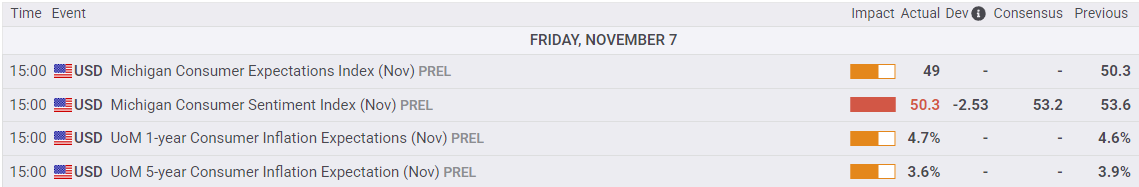
University of Michigan (UoM) Consumer Sentiment survey results showed that US spenders and earners are far more bitter about worsening economic conditions than previously expected by investors. The UoM’s Consumer Sentiment Index and Consumer Expectations Index both declined to some of their lowest levels on record, with the Sentiment Index falling to 50.3 from 53.6, and the Expectations Index slumping to 49 from 50.3. The steep declines highlight the deteriorating economic outlook for consumers, who have been facing worse employment, income, and hiring conditions through the second half of the year. Markets struggled to grasp deteriorating conditions at the surface level of consumer data, with the upper ranks of income earners covering inflation and job cut holes with outsized consumption spending power in the post-COVID economic era.
The UoM’s 1-year and 5-year Consumer Inflation Expectations survey results also showed a steepening of the consumer expectations curve, with 1-year inflation expectations rising to 4.7% from 4.6% and the 5-year outlook falling to 3.6% from 3.9%. A tightening inflation expectations curve implies that consumer-level economic concerns are shifting from general malaise to growing fears of a near-term deterioration.
Fed consumer sentiment results differ, but overall message remains the same
Fears of a 'K-shaped' economy, where a few high-income earners are outspending the lower portions of the income ladder just enough to paper over threats of steep economic downturns, have been growing through the year among academic circles, and now K-shaped data sources have been appearing to further complicate the issue. According to the New York Bank of the Federal Reserve (Fed), consumer inflation expectations were relatively unchanged in October, with the New York Fed reporting a slight decline in 1-year inflation expectations to 3.2% from 3.4% and an unchanged 5-year inflation outlook at 3.0%. Despite the comparatively cooler data, even the New York Fed had to begrudgingly acknowledge that October’s household labor market outlook was “mostly negative”, while consumer perceptions of both current and future financial conditions worsened appreciably.
The US government shutdown continues to roll on into record territory, and US President Donald Trump has the dubious honor of helming the federal government during the two longest shutdowns in US history, and also stands tall as the US President in office for the most federal closures. With official datasets frozen due to defunding, investors have been forced to pivot into sniffing out private datasets to try and estimate where inflation and labor market shifts are hitting, and the figures are not looking good. According to figures from DataWeave, major retailers Target (TGT) and Walmart (WLMT) have seen their average prices rise 5.5% and 5.3%, respectively, a stark reminder that inflation figures tend to be a collection of assumptions, estimates, and averages, and can frequently mask steep, unbalanced price hikes that pummel a large number of lower-income consumers’ wallets.
Shutdowns are the president's fault, except when they're not
Donald Trump’s personal solution to growing concerns about an affordability crisis was to take to social media and make a post demanding that everyone “STOP LYIN”, and instead claiming that his administration has actually “whipped” inflation. In 2013, Donald Trump was an aspiring political candidate who claimed via a social media post that “a shutdown means the president is weak.” However, that was before Donald Trump was personally at the helm of the two longest government shutdowns ever.
Dow Jones daily chart
Dow Jones FAQs
The Dow Jones Industrial Average, one of the oldest stock market indices in the world, is compiled of the 30 most traded stocks in the US. The index is price-weighted rather than weighted by capitalization. It is calculated by summing the prices of the constituent stocks and dividing them by a factor, currently 0.152. The index was founded by Charles Dow, who also founded the Wall Street Journal. In later years it has been criticized for not being broadly representative enough because it only tracks 30 conglomerates, unlike broader indices such as the S&P 500.
Many different factors drive the Dow Jones Industrial Average (DJIA). The aggregate performance of the component companies revealed in quarterly company earnings reports is the main one. US and global macroeconomic data also contributes as it impacts on investor sentiment. The level of interest rates, set by the Federal Reserve (Fed), also influences the DJIA as it affects the cost of credit, on which many corporations are heavily reliant. Therefore, inflation can be a major driver as well as other metrics which impact the Fed decisions.
Dow Theory is a method for identifying the primary trend of the stock market developed by Charles Dow. A key step is to compare the direction of the Dow Jones Industrial Average (DJIA) and the Dow Jones Transportation Average (DJTA) and only follow trends where both are moving in the same direction. Volume is a confirmatory criteria. The theory uses elements of peak and trough analysis. Dow’s theory posits three trend phases: accumulation, when smart money starts buying or selling; public participation, when the wider public joins in; and distribution, when the smart money exits.
There are a number of ways to trade the DJIA. One is to use ETFs which allow investors to trade the DJIA as a single security, rather than having to buy shares in all 30 constituent companies. A leading example is the SPDR Dow Jones Industrial Average ETF (DIA). DJIA futures contracts enable traders to speculate on the future value of the index and Options provide the right, but not the obligation, to buy or sell the index at a predetermined price in the future. Mutual funds enable investors to buy a share of a diversified portfolio of DJIA stocks thus providing exposure to the overall index.
Recommended Articles


