


3 Altcoins To Watch In The Second Week Of April 2026
The second week of April brings a rare concentration of protocol-level catalysts that could move select altcoins sharply. A consensus upgrade, a full blockchain migration, and a token unlock are all landing between April 7 and April 12. BeInCrypto analysts have identified three altcoins to watch where the catalyst directly intersects with the current technical structure.
This creates setups that demand attention regardless of direction.
Toncoin (TON)
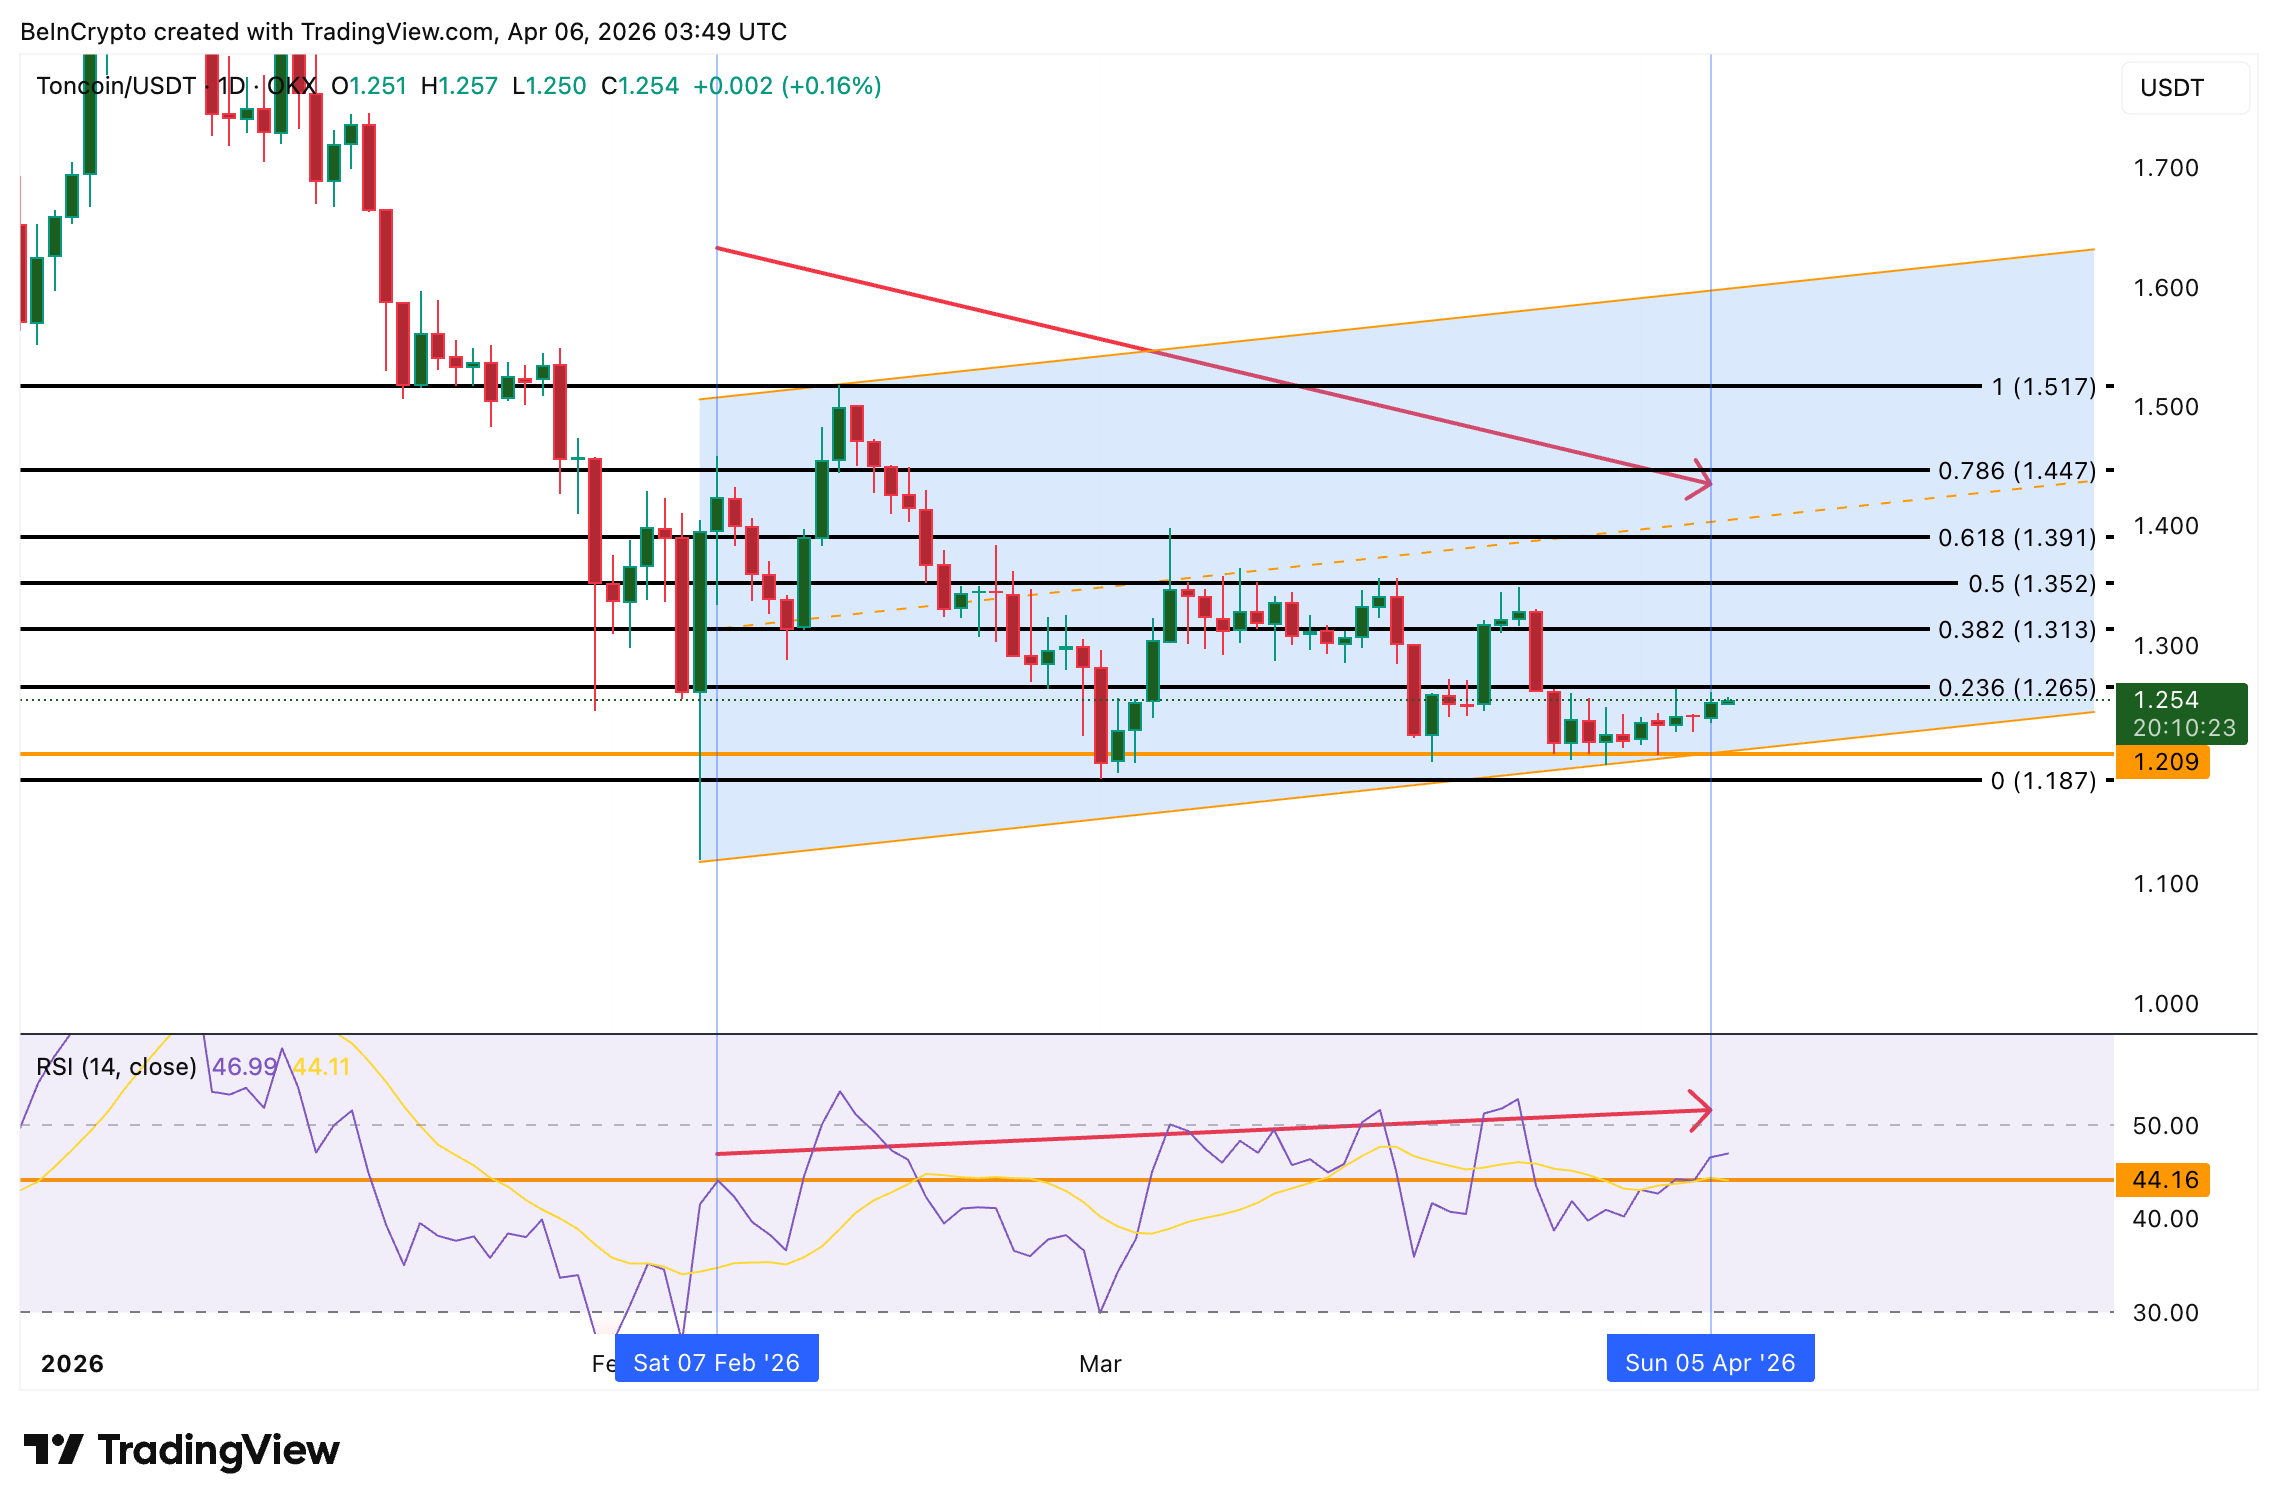
Toncoin (TON) sits at $1.254, sitting inside a descending channel that has contained price action since early February. The sub-second finality upgrade reaches full activation on April 7 when validators vote to enable fast consensus across both basechain and masterchain.
The upgrade reduces confirmation times to under one second, directly improving usability for Telegram mini-apps, payments, and high-frequency on-chain activity. The fundamental trigger makes it one of the critical altcoins to watch as we head into the second week of April.
Want more token insights like this? Sign up for Editor Harsh Notariya’s Daily Crypto Newsletter here.
The daily chart, however, shows a complication. Between February 7 and April 5, price made a lower high while the Relative Strength Index (RSI), a momentum oscillator, made a higher high. That is a hidden bearish divergence, a pattern that typically signals continuation of the existing downtrend. Do note that TON is down over 20% year-to-date, highlighting the downtrend.
The fundamental trigger could blunt the divergence if it generates enough buying pressure. A reclaim of $1.265 would be the first step toward invalidating the bearish setup. Above that, $1.391 and $1.517 become the next targets. However, if the upgrade fails to spark demand and price breaks below $1.209, the lower trendline of the descending channel faces a direct test.
 TON Price Analysis: TradingView
A daily close above $1.265 invalidates the hidden bearish divergence and opens upside toward $1.391, while a break below $1.209 confirms the downtrend continuation.
Aptos (APT)
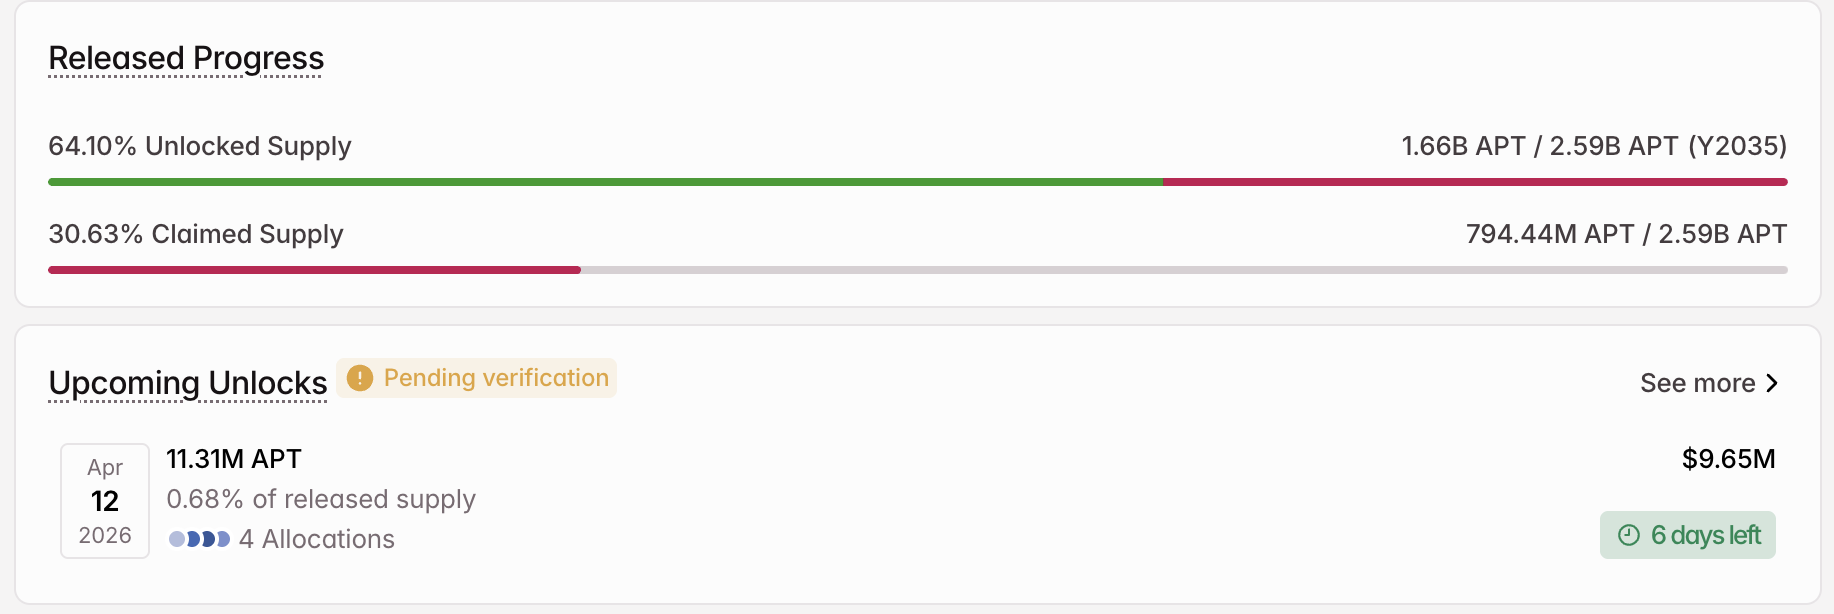
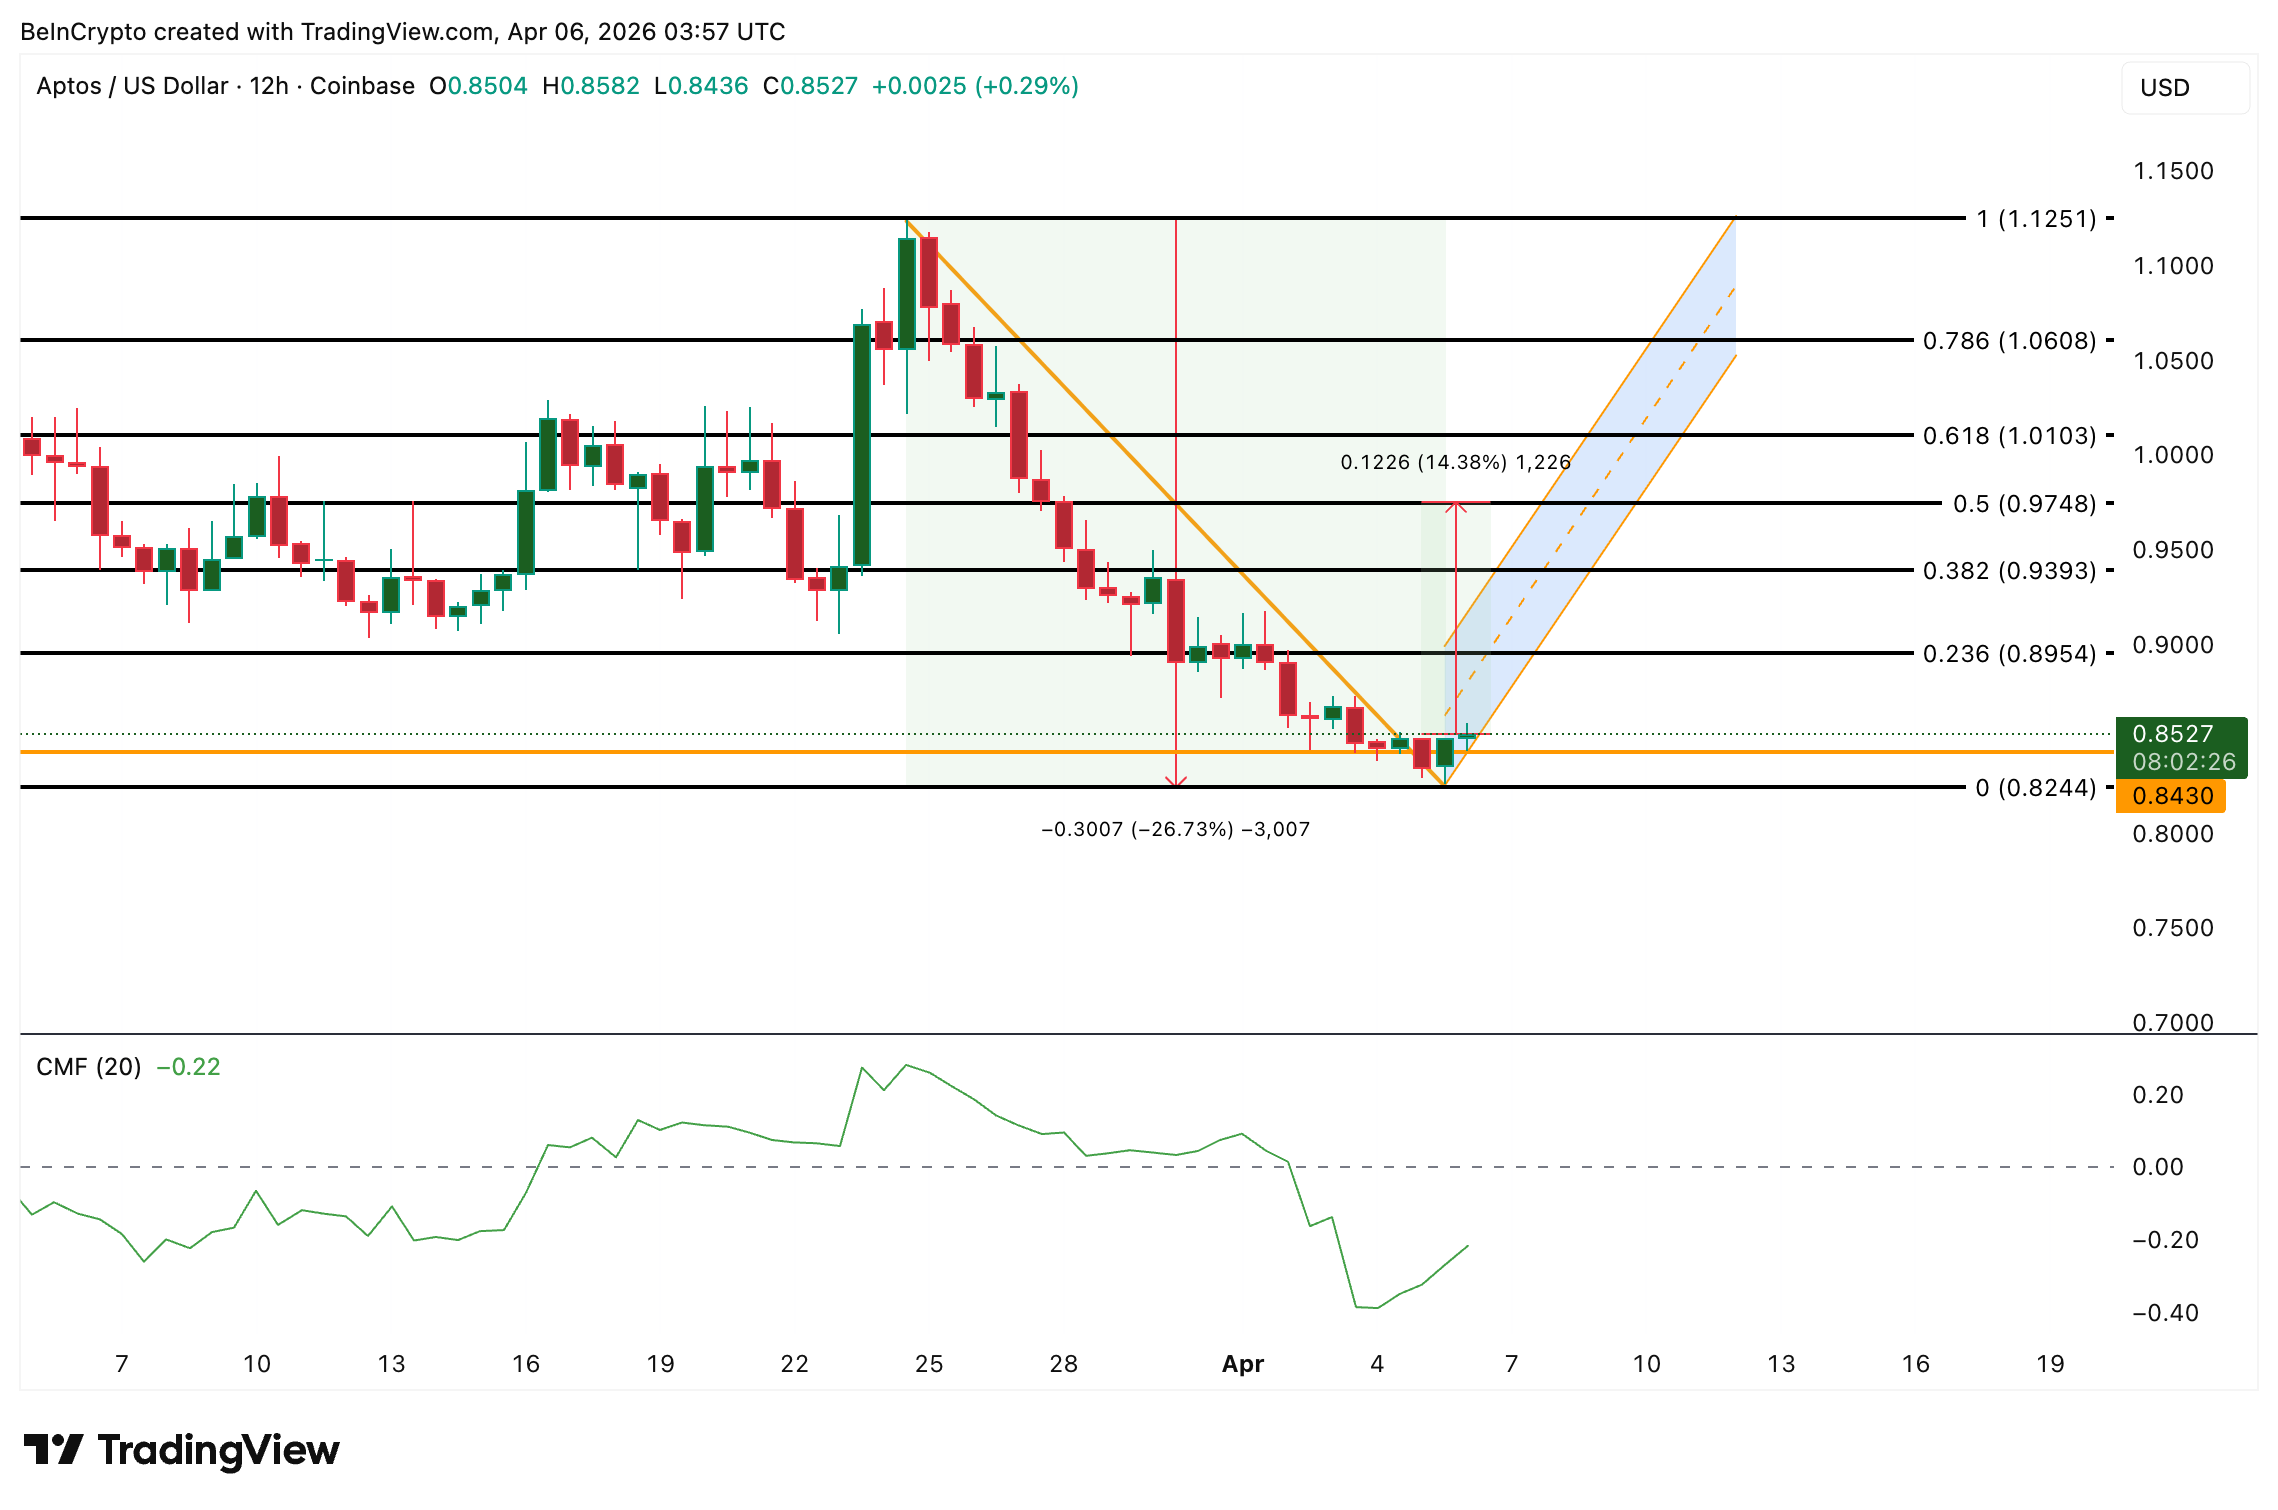
Aptos (APT) trades at $0.85 on the 12-hour chart, down 48% year-to-date and 10% over the past seven days. This altcoin faces an 11.31 million APT unlock on April 12, worth approximately $9.65 million, adding 0.68% to the released supply across four allocation categories.
 Token Unlock Schedule: Tokenomist
The 12-hour chart shows a bearish flag and pole pattern forming since late March. The pole represents the sharp decline from the March 24 high, and the current consolidation resembles the flag. Chaikin Money Flow (CMF), a proxy for big buying and selling pressure, sits at -0.22, deep below the zero line. That negative reading confirms that big money has been exiting rather than accumulating during the consolidation.
As long as CMF remains negative, every bounce within the flag risks being a continuation setup rather than a reversal. The April 12 unlock adds supply into an environment where large capital flow is already withdrawing, creating a double headwind.
A break below the $0.84-$0.82 zone would confirm a flag breakdown and could activate a 26% measured move to the downside. The first step toward invalidation would be a 12-hour close above $0.93, followed by $0.97 and $1.01 to fully dismantle the pattern. However, that would require CMF to reclaim the zero line first.
 APT Price Analysis: TradingView
A close below $0.82 separates a flag consolidation from a confirmed breakdown, while reclaiming $0.93 with positive CMF would weaken the bearish structure.
Sei (SEI)
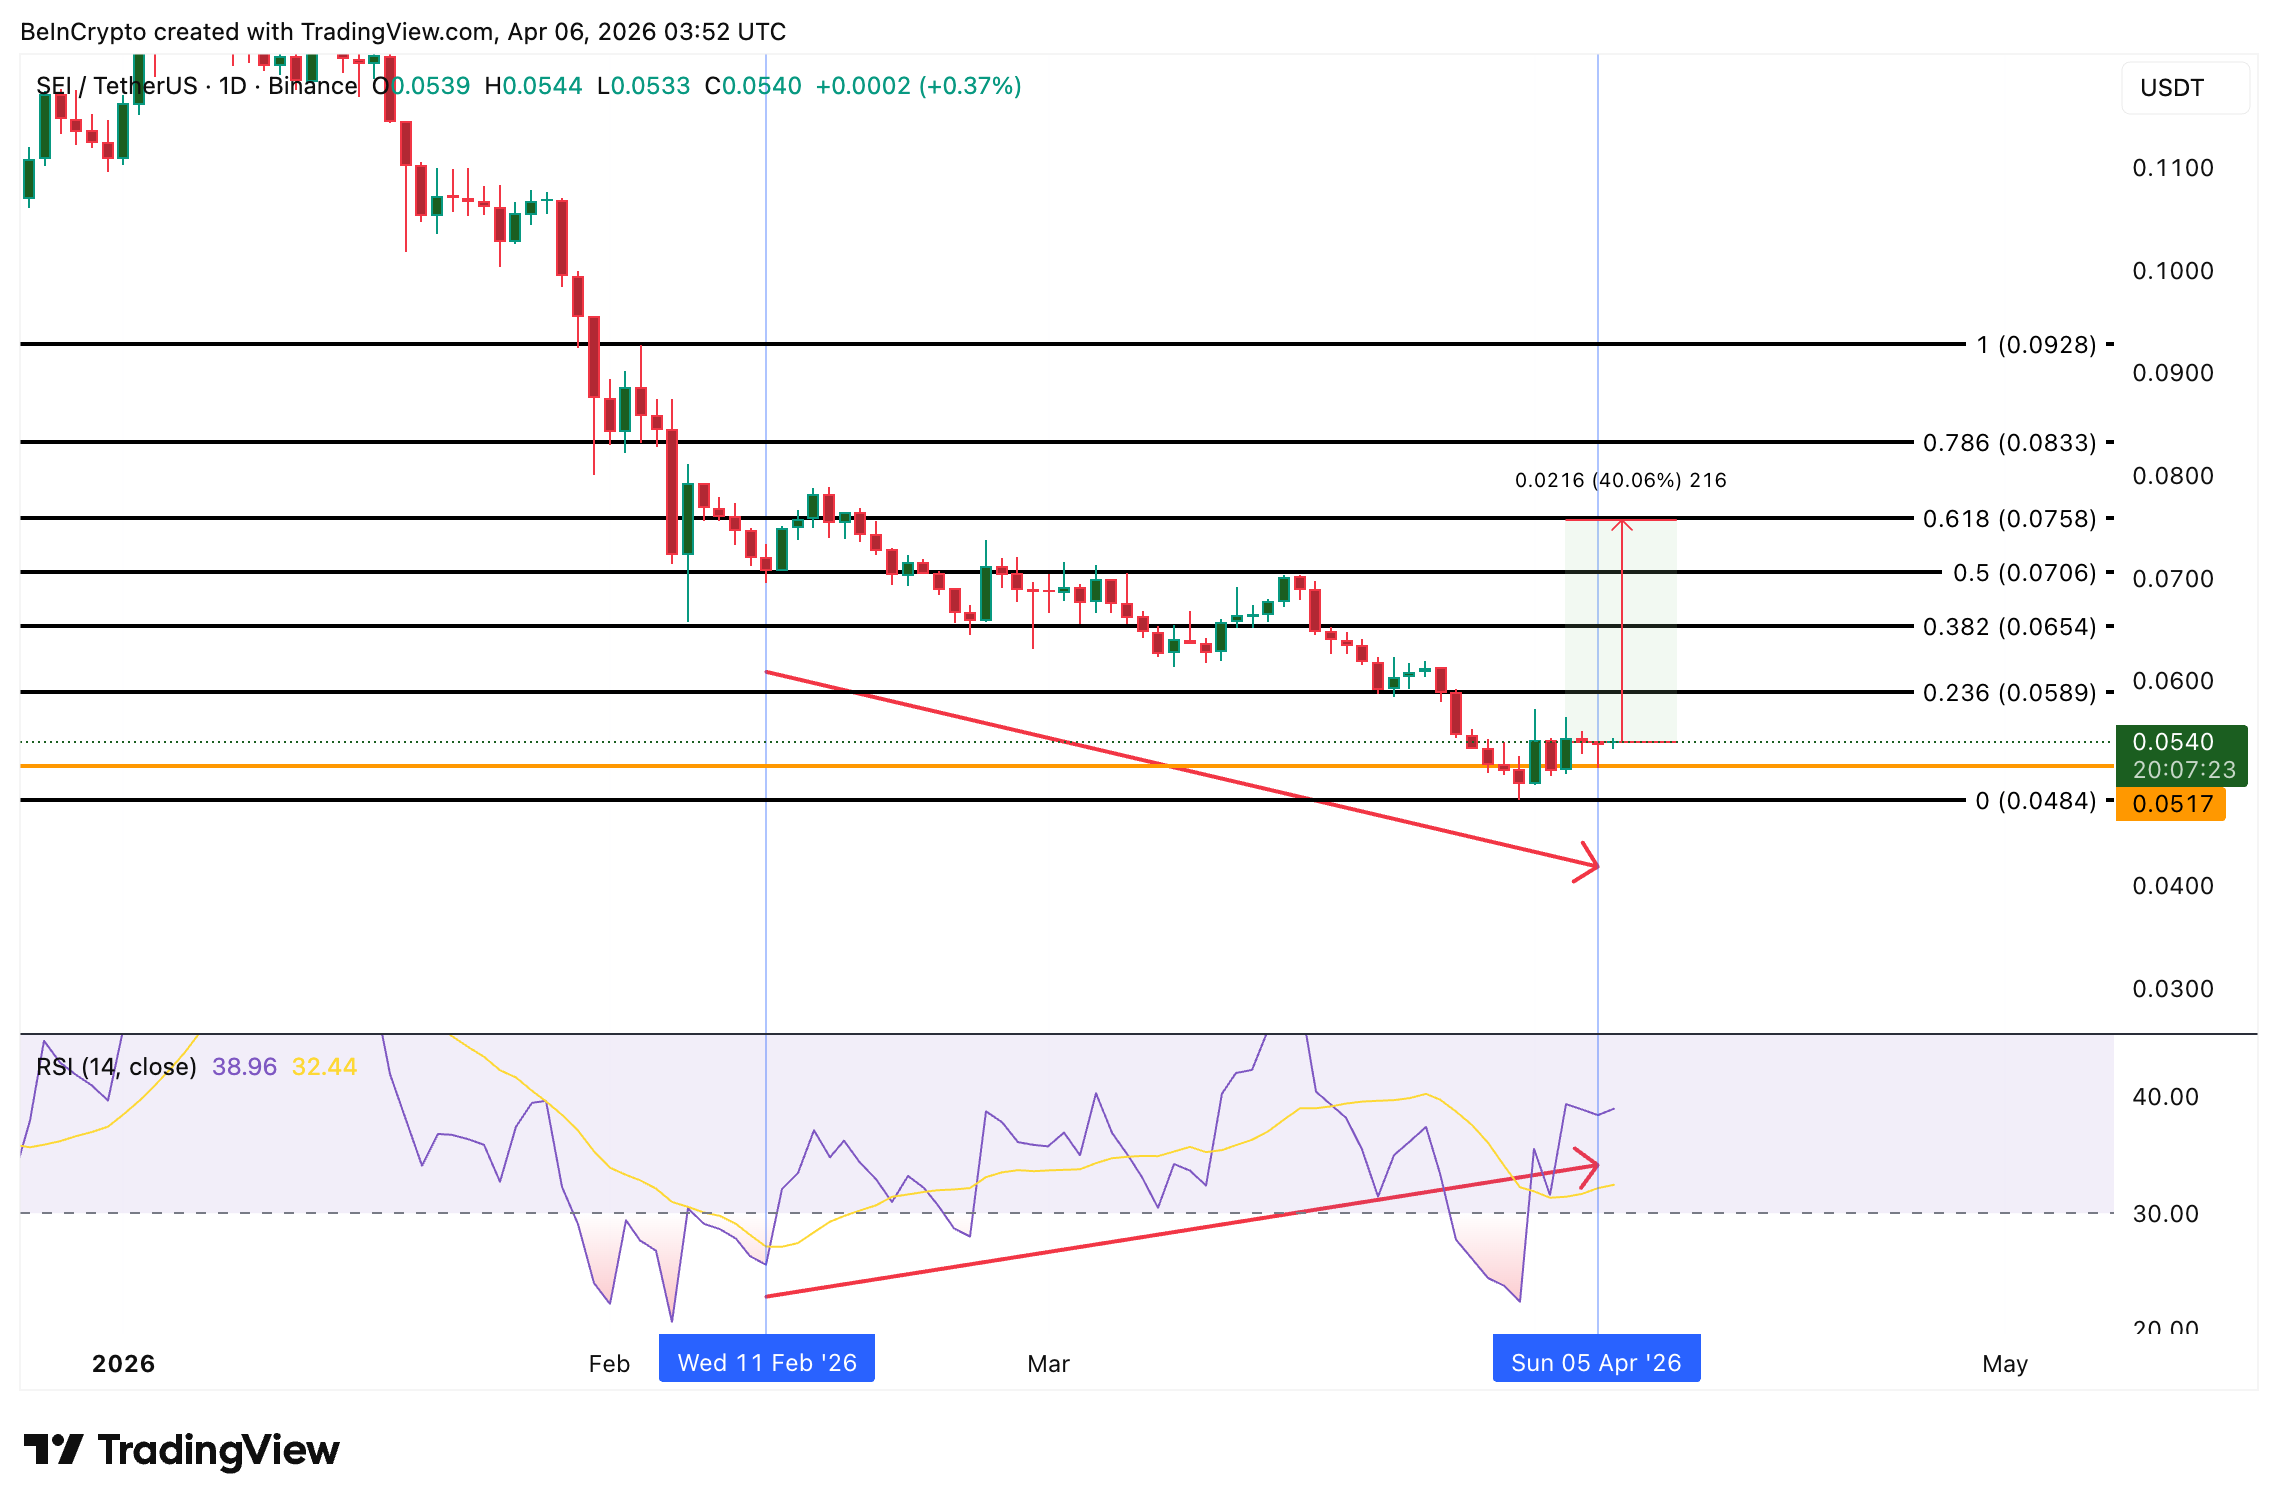
Sei (SEI) trades at $0.054, down 51% year-to-date but flat over the past seven days, making it one of the few altcoins to watch for a potential trend reversal this week. The EVM-only migration window closes between April 6 and 8, completing Sei’s full transition away from Cosmos IBC to native EVM compatibility.
Coinbase and Kraken have both announced support, with deposits and withdrawals paused during the migration. Post-migration, all activity shifts to full EVM architecture, simplifying developer onboarding from the Ethereum ecosystem and setting the stage for the broader “Giga” upgrade targeting 200,000 transactions per second.
The daily chart reveals a significant signal. Between February 11 and April 5, price made a lower low while RSI made a higher low. That standard bullish divergence suggests weakening selling momentum after months of persistent decline. When a bullish divergence aligns with a structural catalyst like the EVM migration, the probability of a trend reversal increases.
However, the token still needs a 40% move to reach meaningful resistance at $0.075, which limits the immediate upside case. A close above $0.058 would confirm the divergence is producing a bounce. Above that, $0.070 and $0.075 become the targets that would shift the structure from bearish to neutral or even bullish.
 SEI Price Analysis: TradingView
A break below $0.051 would invalidate the bullish divergence for now and open the path toward $0.048 and lower, confirming that the migration was priced in rather than a genuine demand catalyst.
Recommended Articles


