


Silver Price Recovers From 2026 Low, but April Arrives With a 36% Downside Threat
Silver (XAG/USD) price has bounced roughly 18% from its 2026 low, currently trading above $72. The recovery followed a hidden bullish divergence that began forming in December. Additionally, the latest positioning data suggests speculators are starting to bet on a floor.
However, the broader daily chart still resembles a bear flag with a potential 36% breakdown. Whether the bounce can mature into a genuine reversal or fades into a larger correction depends on a handful of levels and signals heading into April.
A Hidden Divergence and Fresh COT Longs Support the Bounce
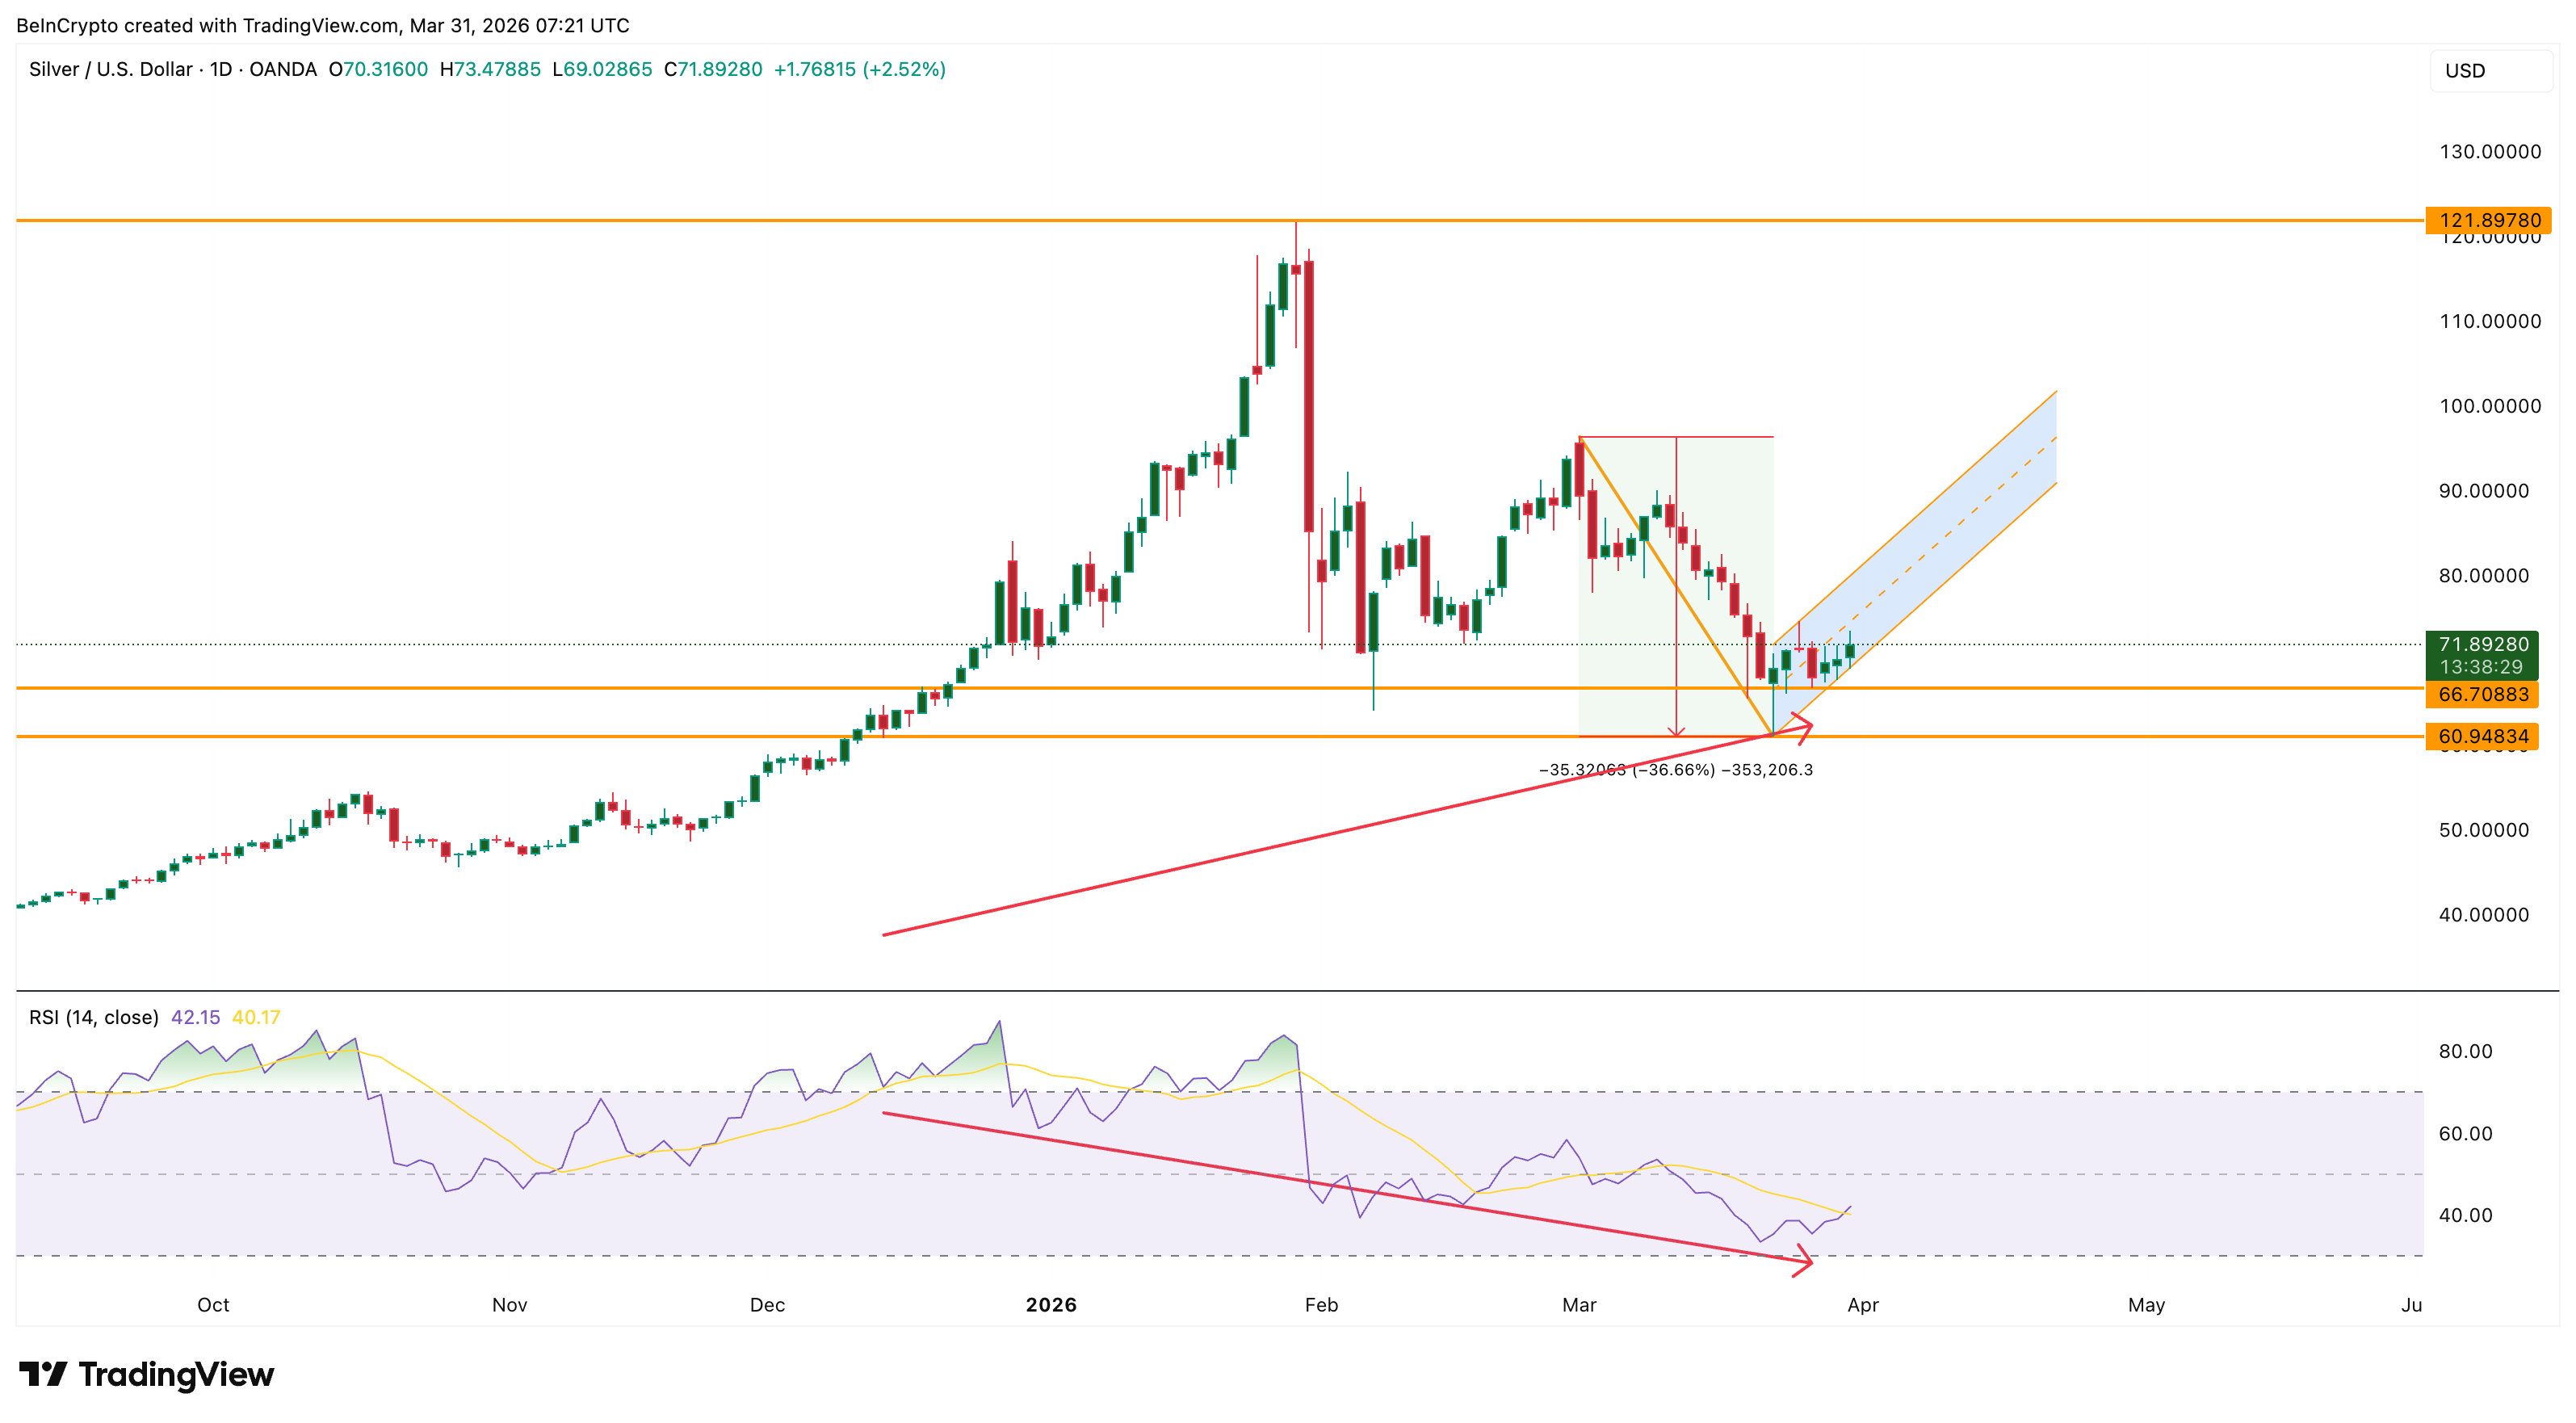
The daily chart shows that between December 12 and March 26, silver price printed a higher low while the Relative Strength Index (RSI), a momentum indicator, made a lower low. The RSI’s previous low came from a deeply overbought region, which means the momentum reset was more structural than panic-driven. This hidden bullish divergence suggests that selling pressure behind the correction from $121 has been gradually exhausting itself.
 Hidden Bullish Divergence: TradingView
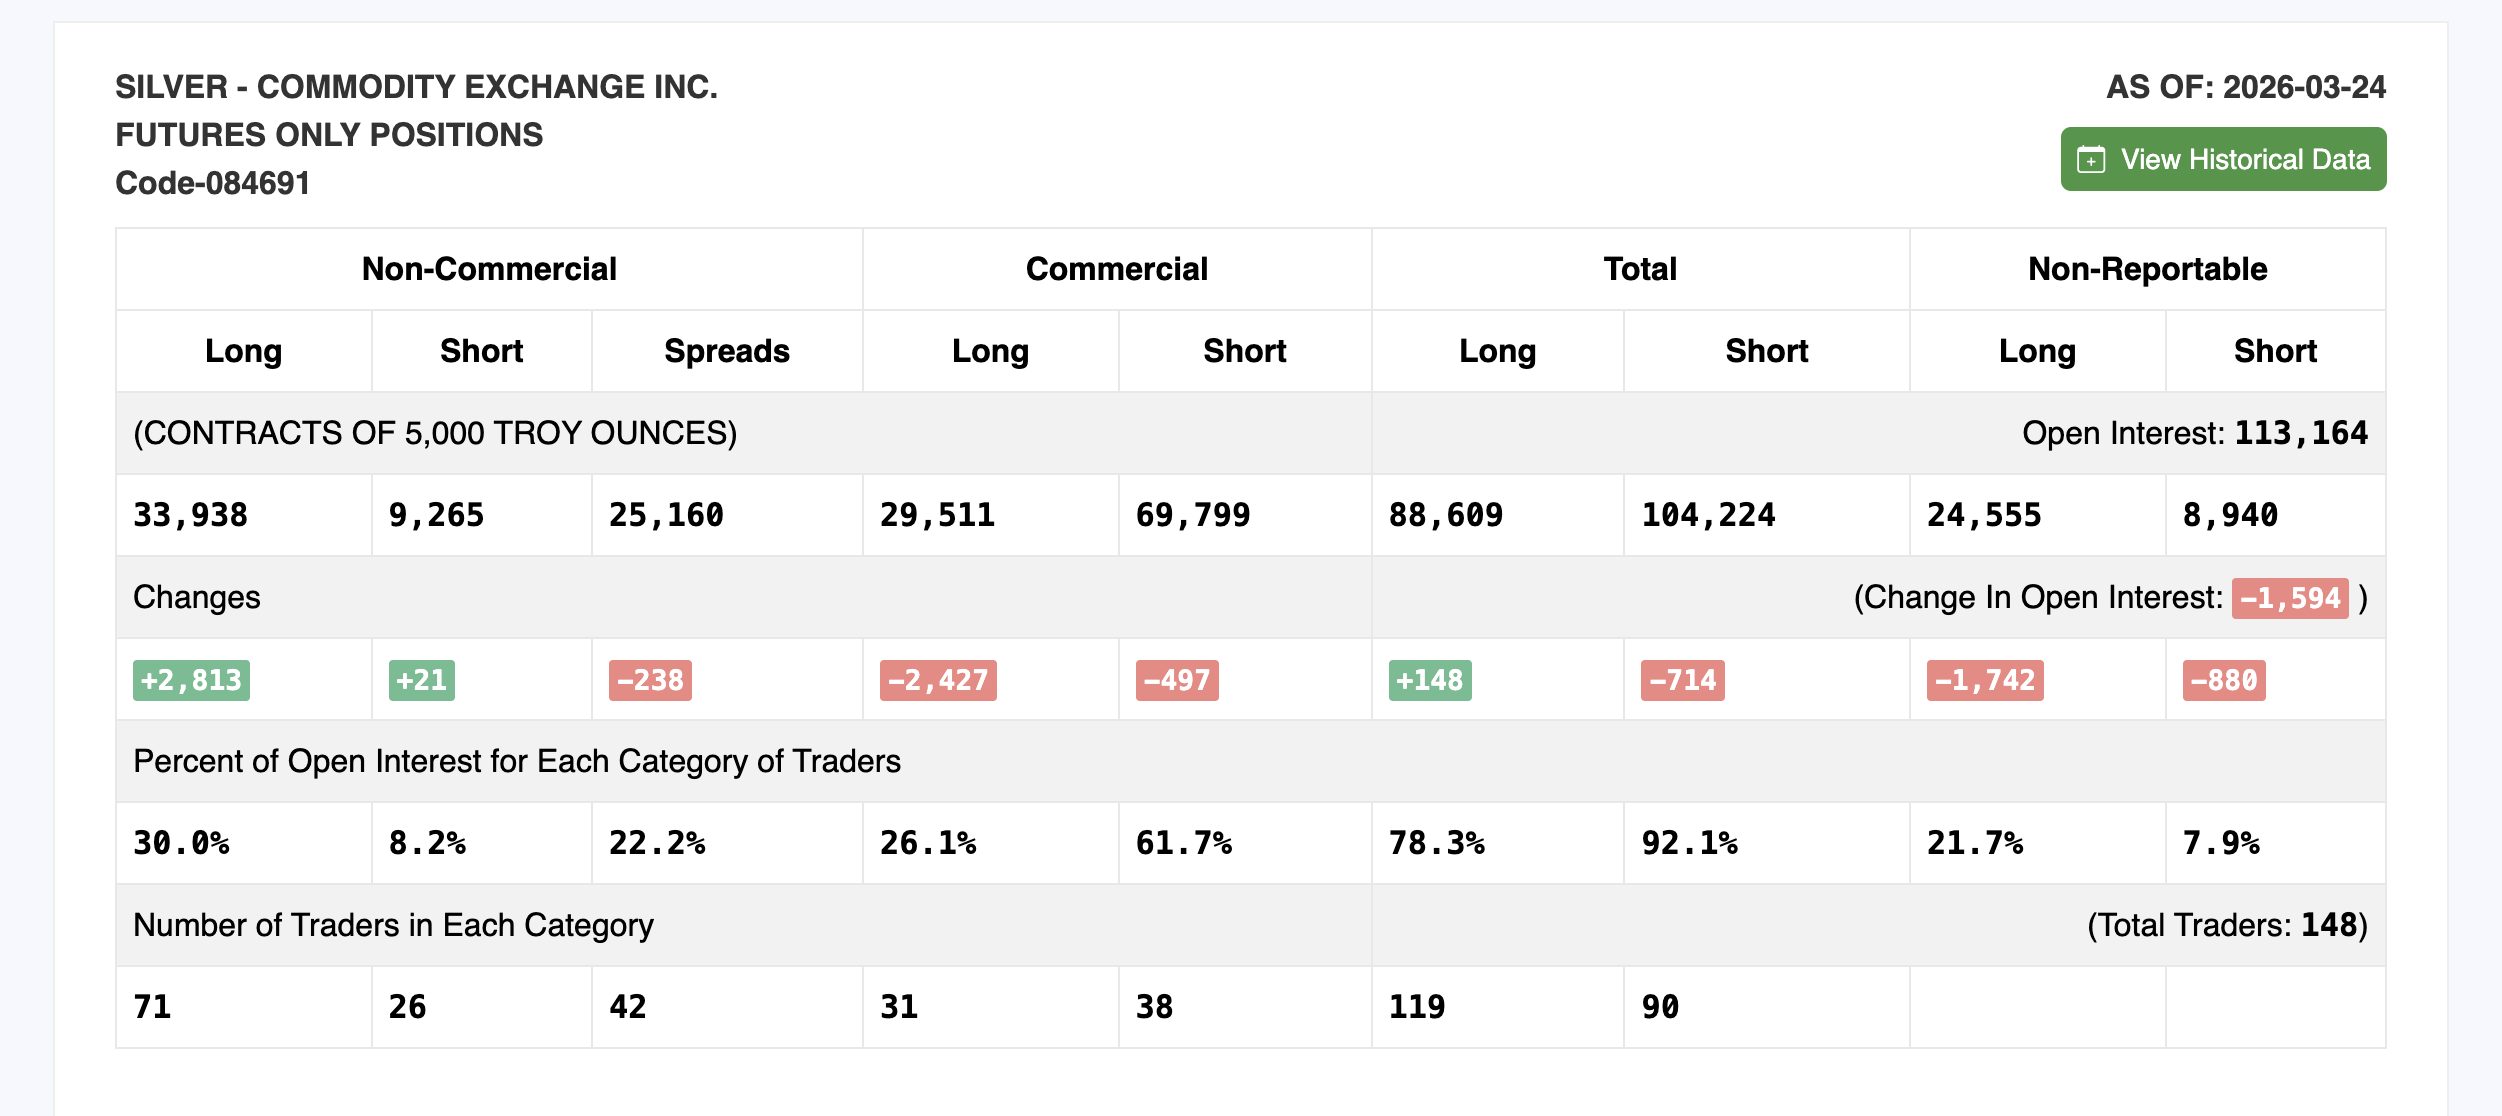
The Commitments of Traders (COT) report, published weekly by the Commodity Futures Trading Commission (CFTC), now confirms that positioning is shifting. The March 24 snapshot shows non-commercial longs rose by 2,813 contracts to 33,938, the first meaningful increase after weeks of consecutive declines. Shorts barely moved, adding just 21 contracts to 9,265.
 Silver COT Report March 24: Tradingster
In the previous Silver price analysis piece, BeInCrypto flagged that a rise in managed money longs would be the earliest confirmation of a floor forming. That signal has now arrived. Open interest fell by 1,594 contracts from the last report, meaning the long additions came alongside broader position unwinding, which typically reflects conviction buying rather than speculative chasing.
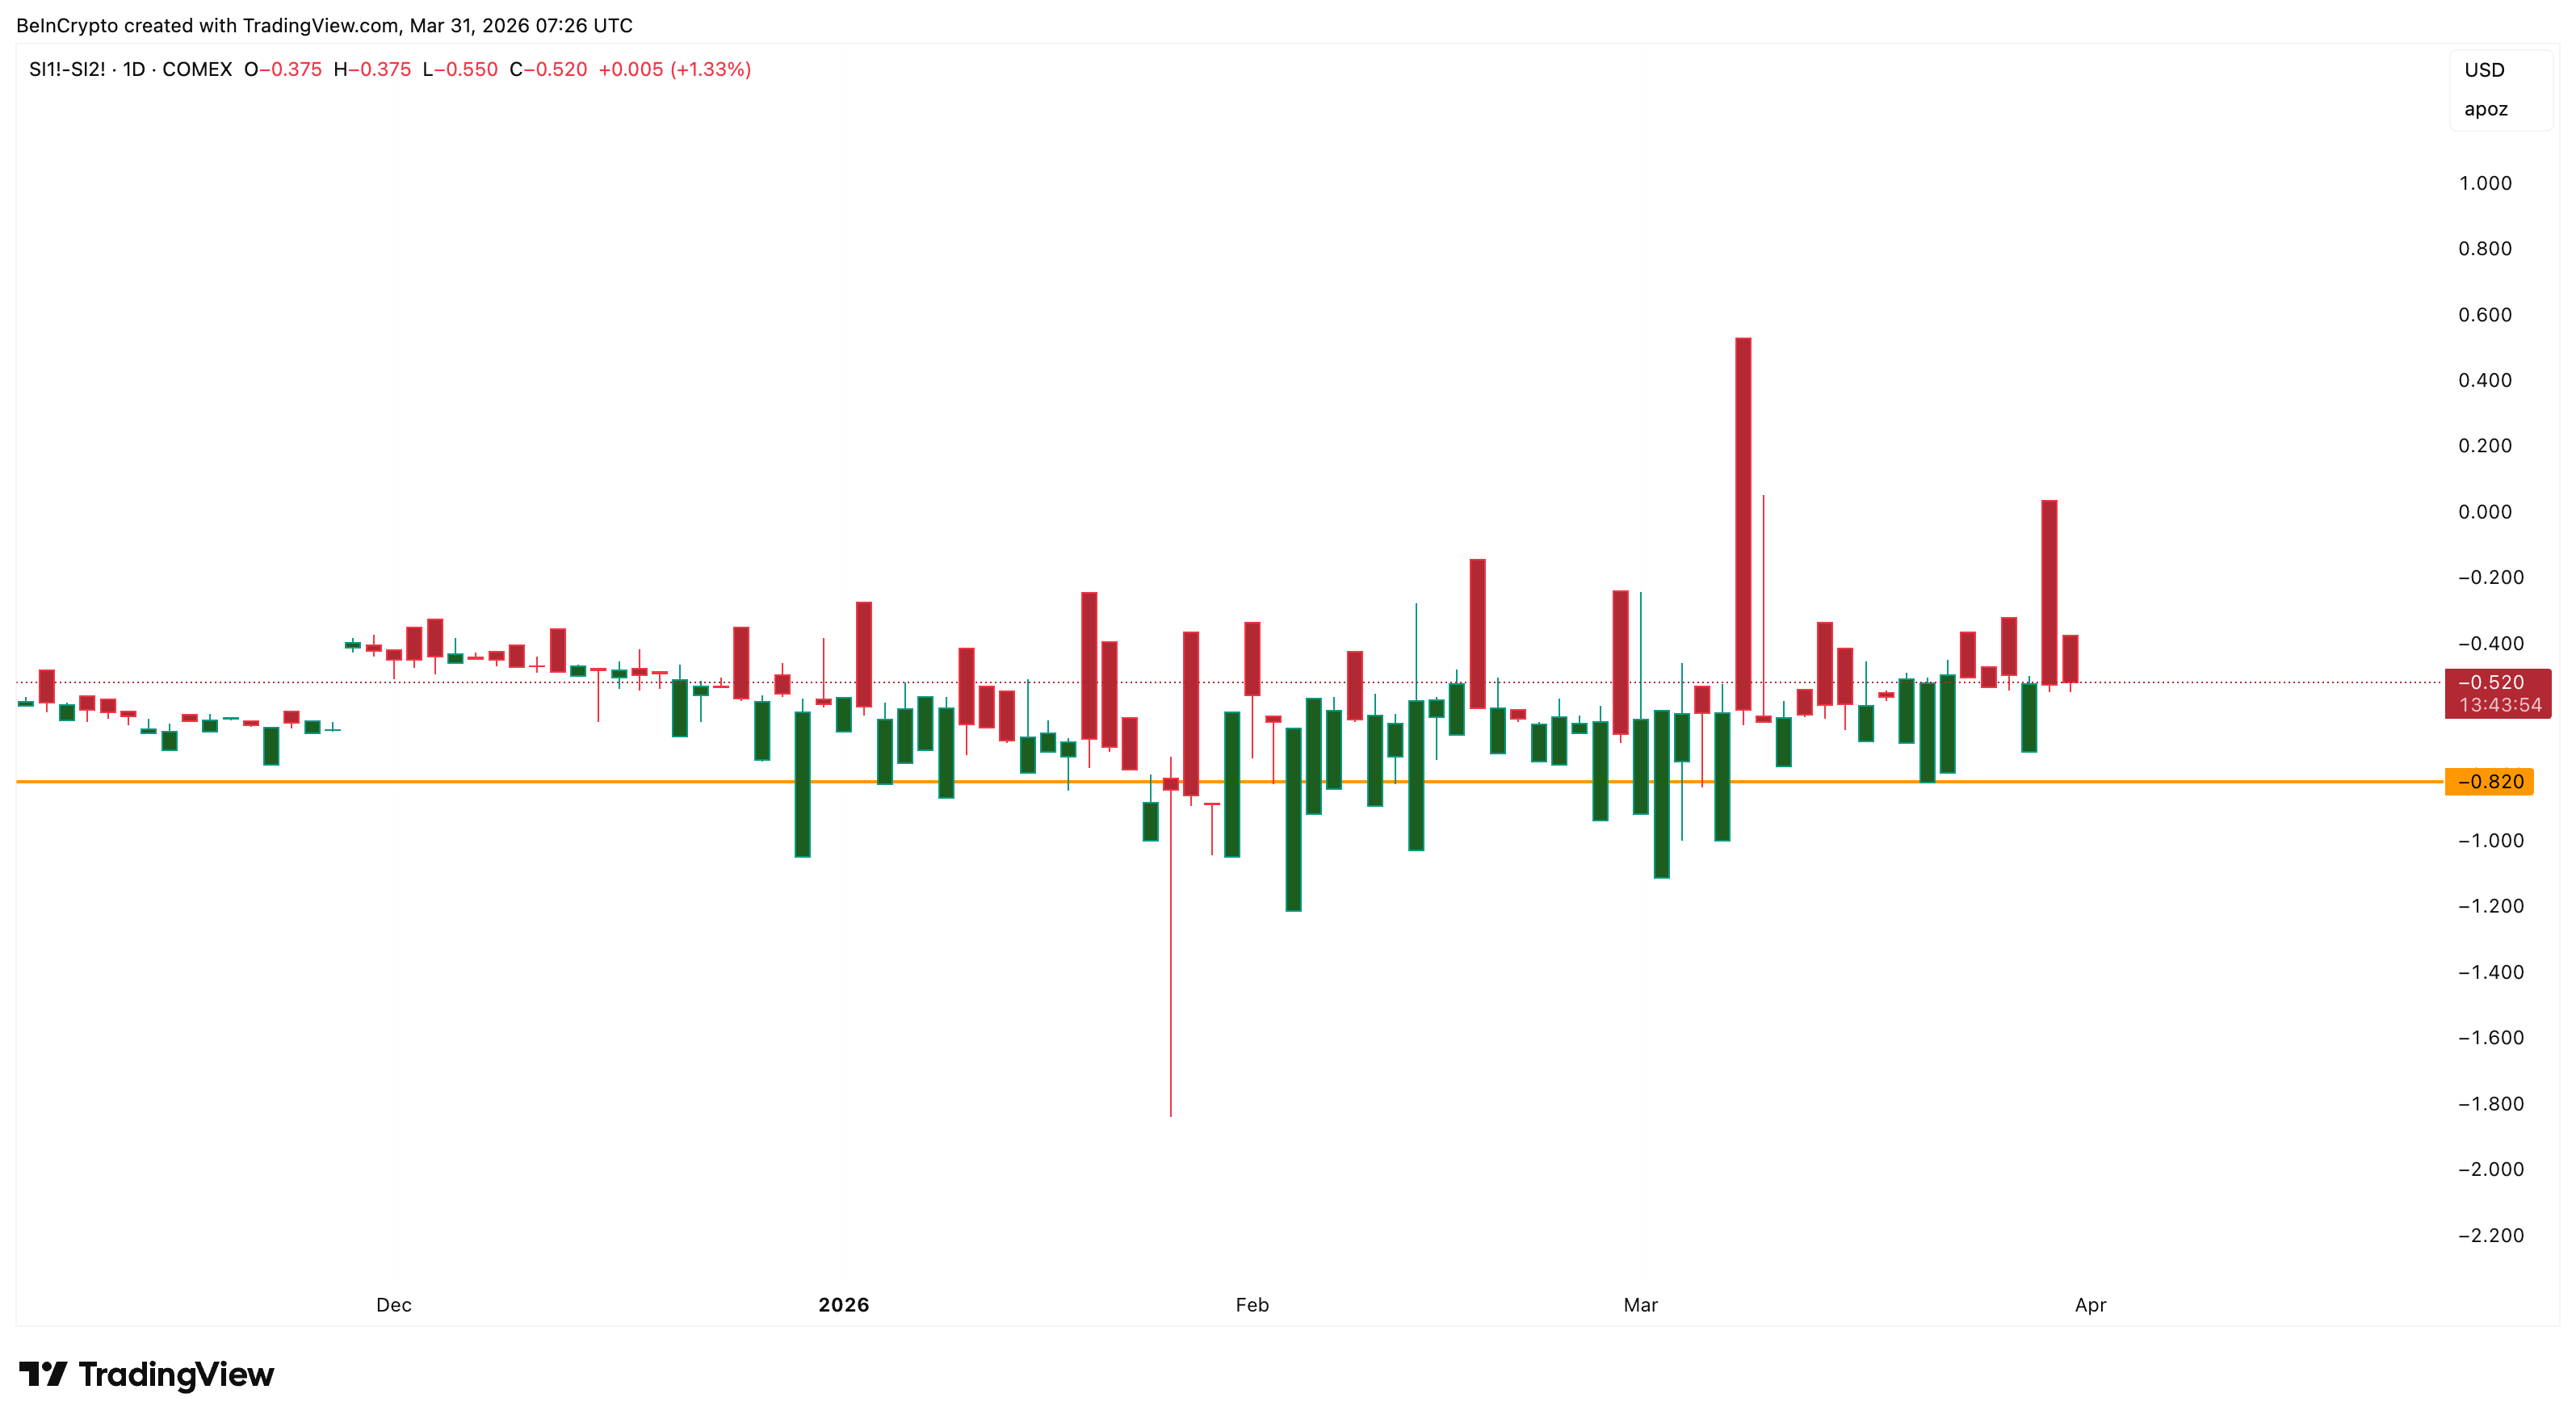
The COMEX silver futures spread (SI1 minus SI2) adds a supporting layer. Silver remains in contango, where future prices trade above near-term prices, signaling no urgency to buy immediately.
 Contango Spread: TradingView
However, the spread recovered from a local low of -0.82 on March 20 (before the 2026 low formed) to -0.52 currently. The narrowing contango suggests demand urgency is slowly returning.
The Dollar Overhang and Gold’s Relative Strength
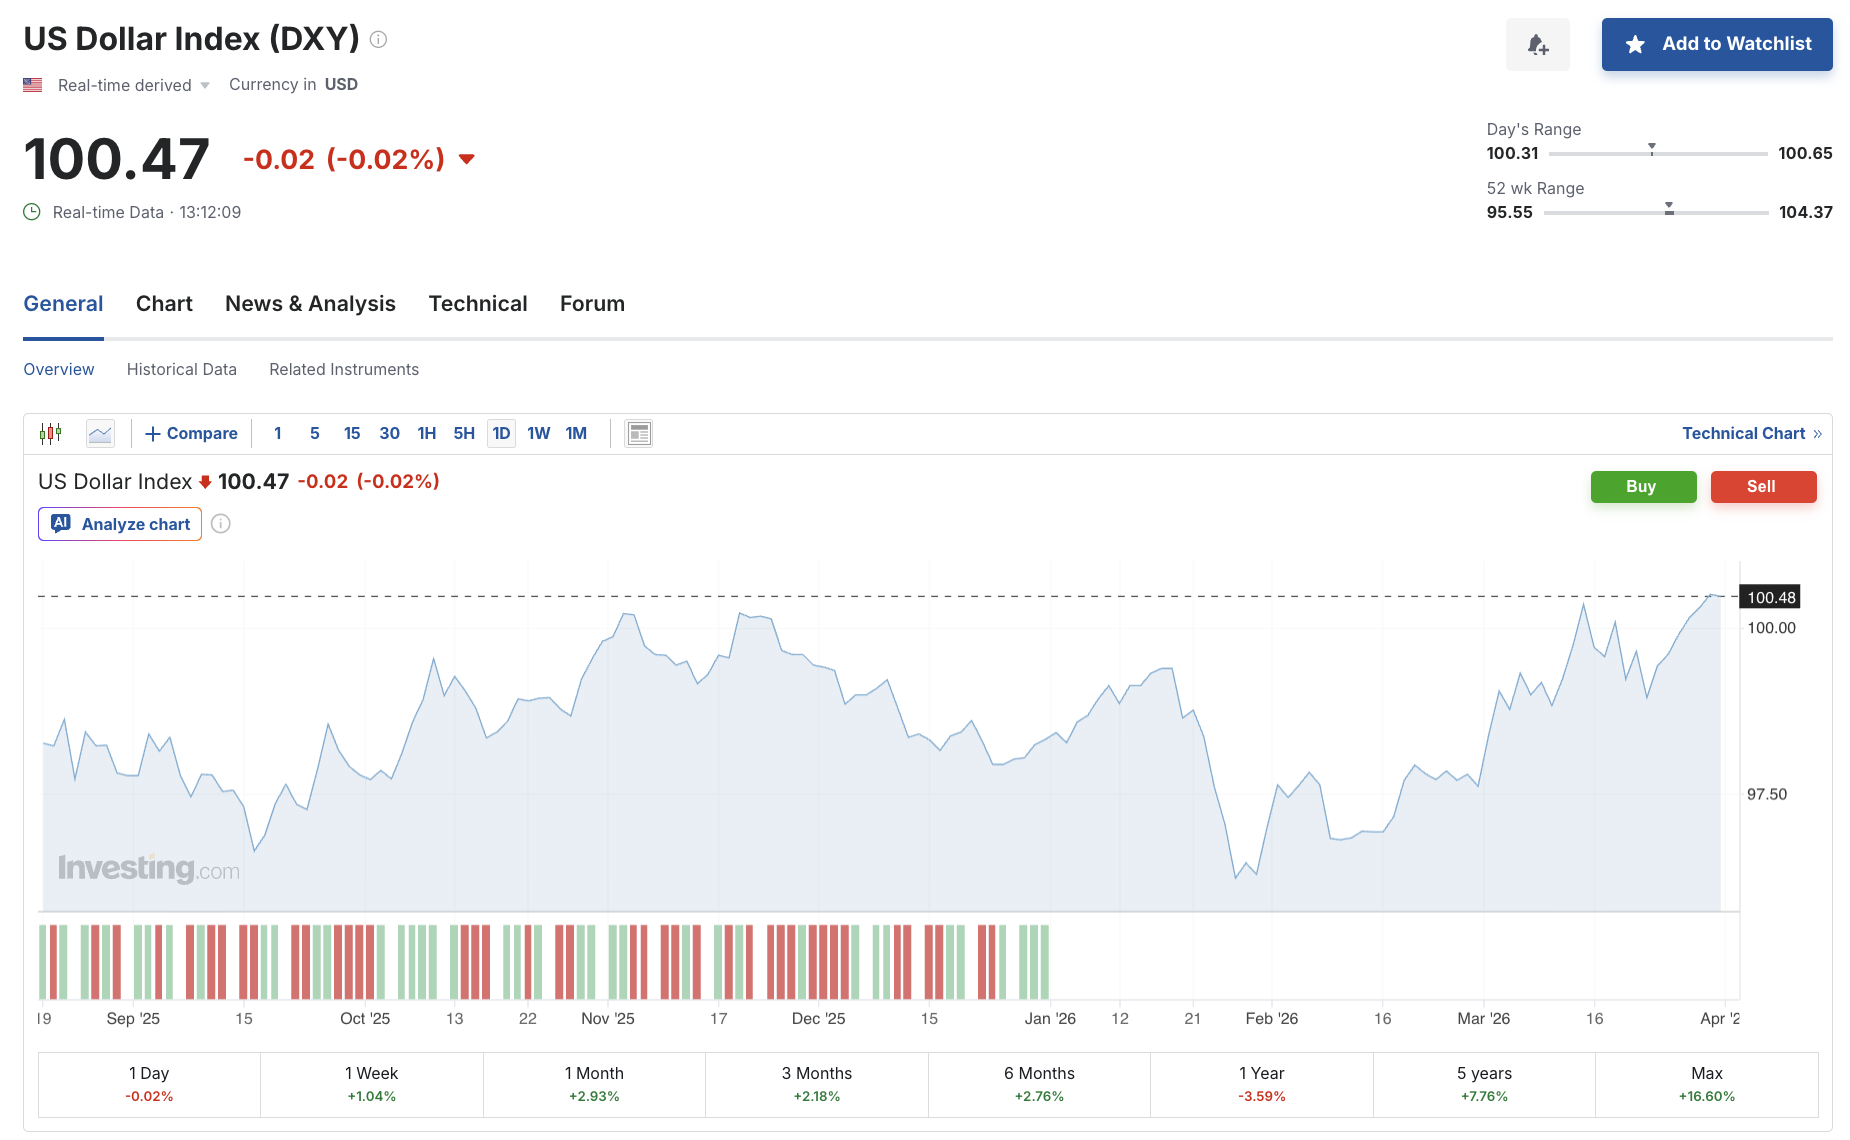
The US Dollar Index (DXY) remains above 100 and has gained roughly 3% over the past month, driven by the ongoing Iran conflict pushing oil prices higher and strengthening the greenback through the petrodollar chain. A stronger dollar typically pressures silver prices by making the metal more expensive for international buyers.
However, a subtle shift may be developing. Over the past week, the DXY gained approximately 1% while silver also gained roughly 1%. The fact that silver is rising alongside the dollar rather than falling against it suggests that the correlation may be loosening near Silver’s recent year-to-date floor or bottom.
 DXY Index: Investing.Com
Gold’s relative performance reinforces silver’s underperformance. Gold is up 1.76% over the past week but down roughly 13.7% over the past month.
Silver corrected 23% over the same monthly window, nearly double gold’s decline. Until silver starts outperforming gold on a sustained basis, the recovery remains fragile.
Silver Price Levels That Will Define April
The most critical Silver price level for April is $74. It aligns with a key technical resistance on the daily chart and sits as the first major hurdle above the current price. A daily close above $74 would mark the first structural shift and bring the 20-day Exponential Moving Average (EMA) and 50-day EMA into play. EMA is a trend indicator that gives greater weight to recent price movements. The 20-EMA sits at $75 and the 50-day EMA sits at $78.
Reclaiming both opens a path toward $88.96, which would invalidate the bear flag entirely.
However, a bearish EMA crossover risk is building. The 20-day EMA is closing in on the 100-day EMA that sits at $73 (another key resistance). The last time a bearish EMA cross occurred on the daily chart, around March 19, silver dropped to its $60 low. If the crossover triggers before silver reclaims $74, it could push prices back toward the two previous swing lows. Those sit at $66 and $60, respectively.
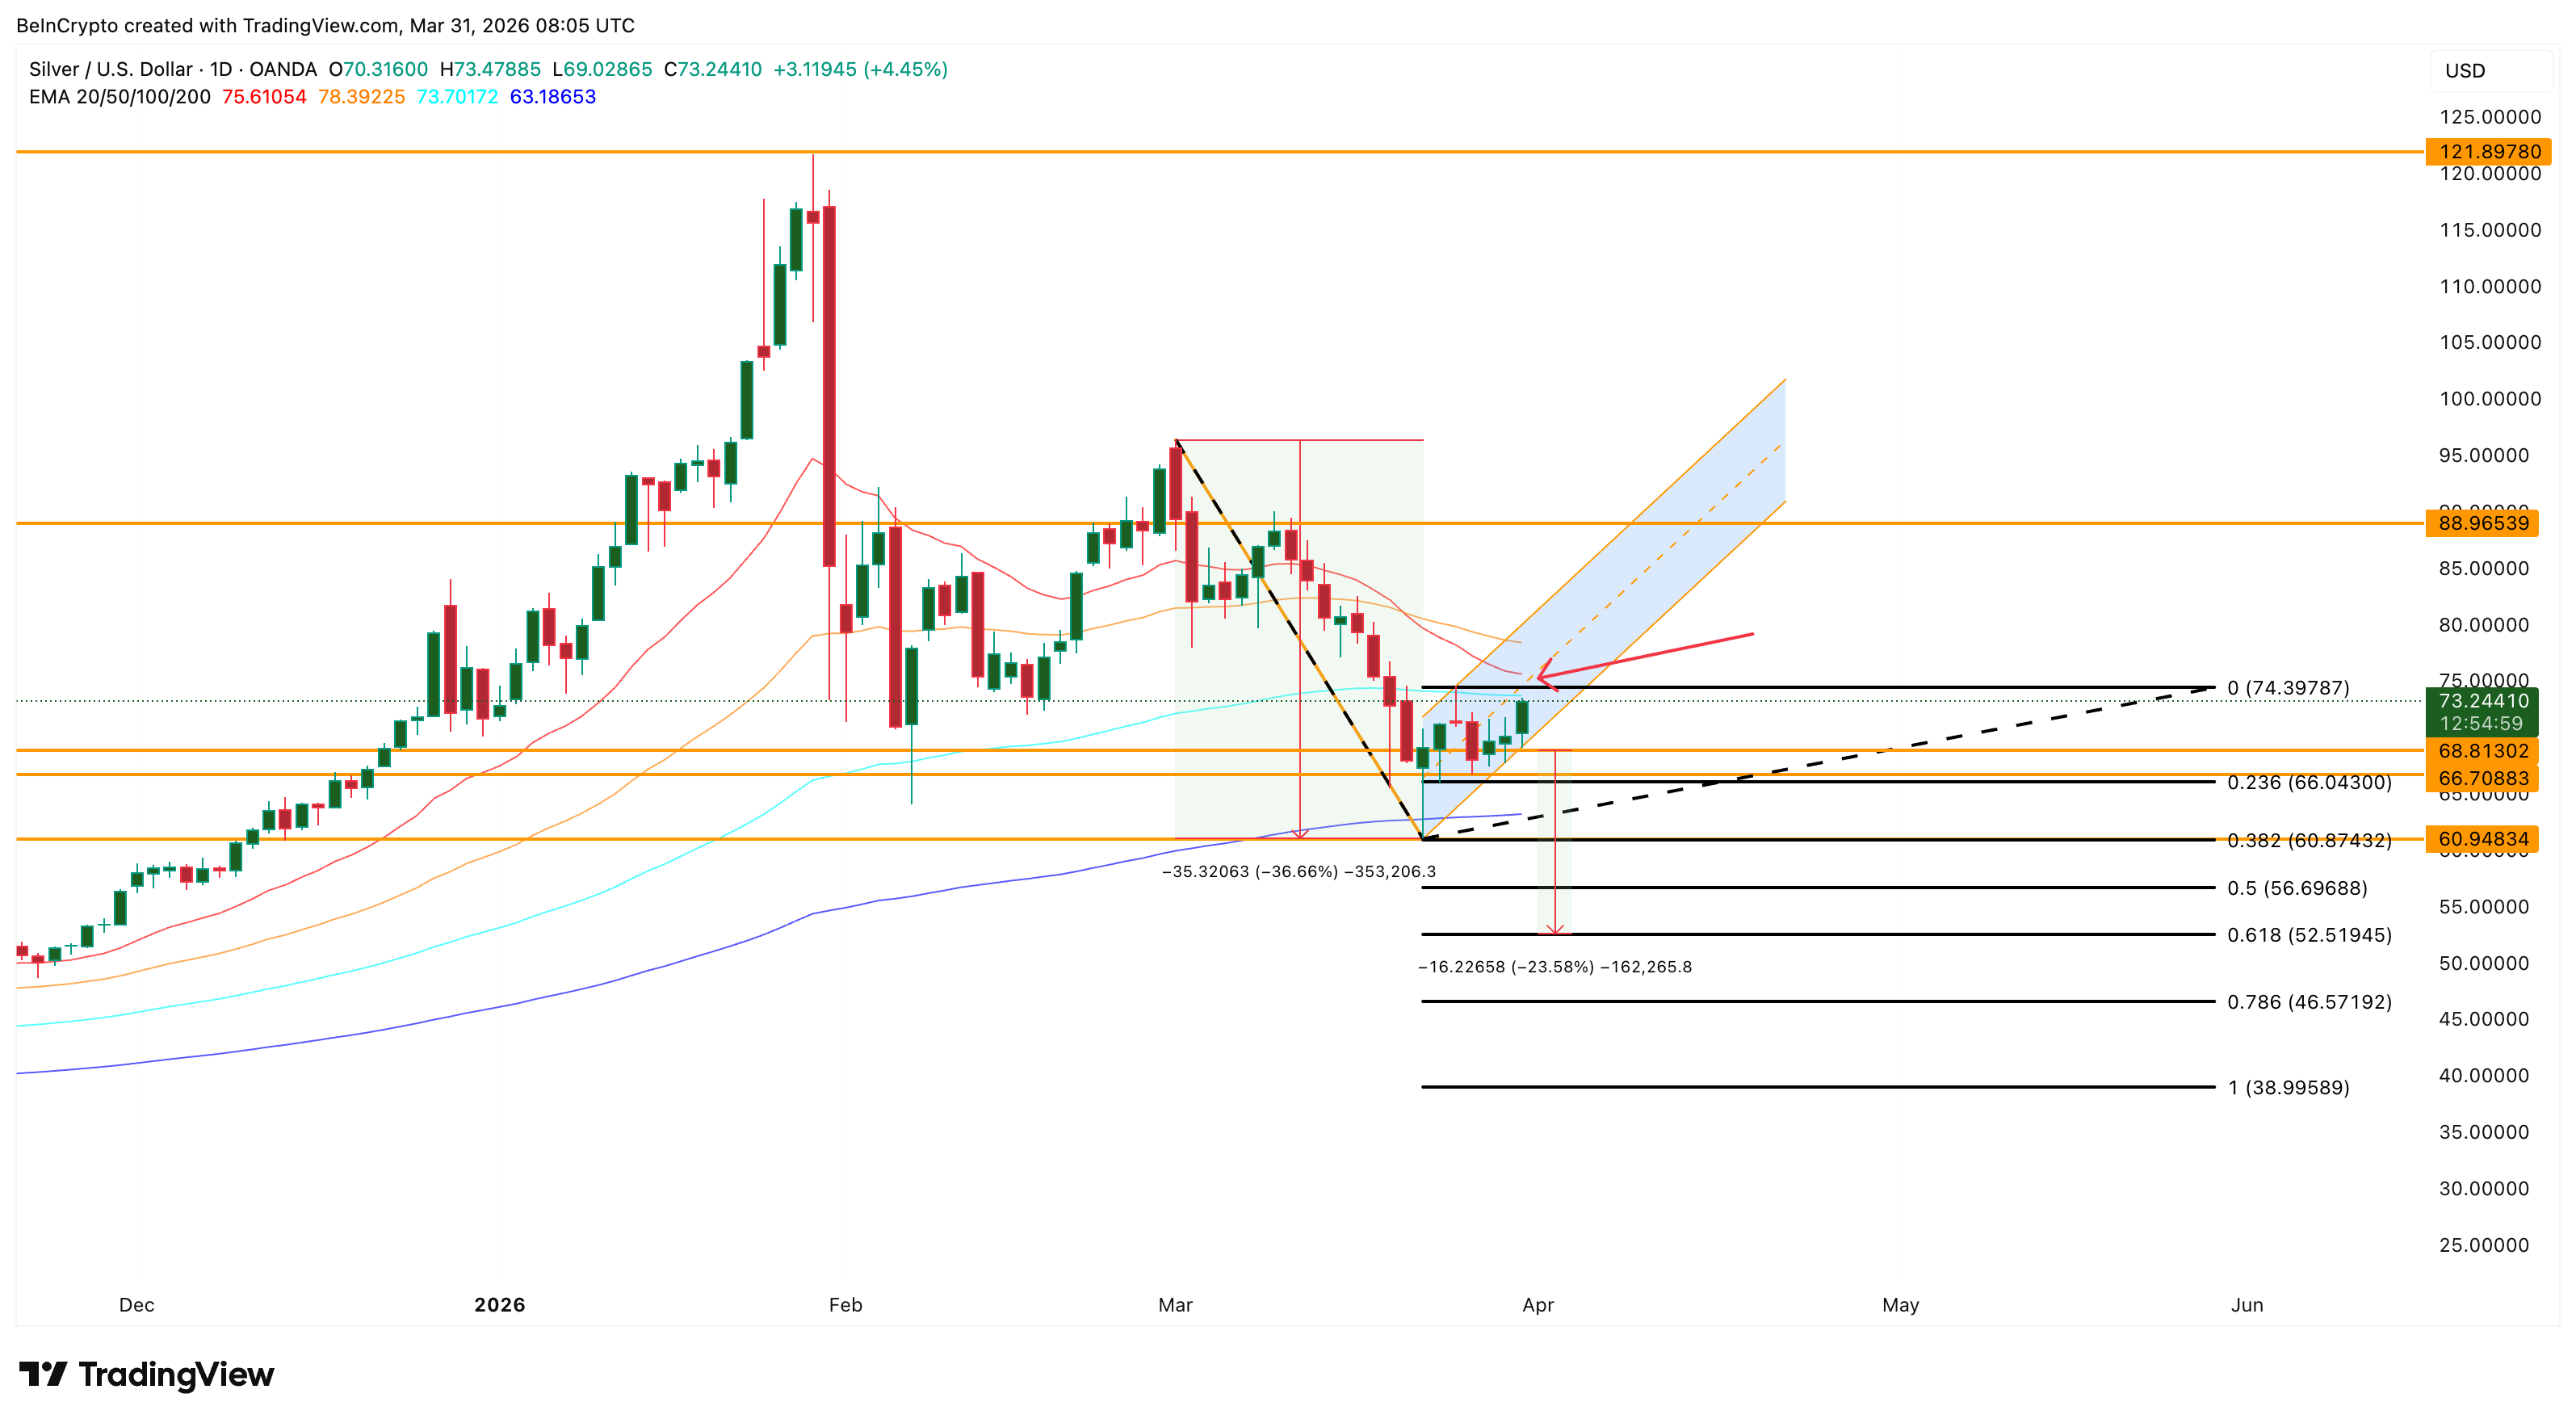 Silver Price Analysis: TradingView
However, even a daily close below $68 would break the lower trendline of the bear flag. That would activate the measured 36% move, targeting roughly $52 first as a key level.
The COT data and the hidden divergence suggest the bottom may be forming. The price structure says it is not yet confirmed. A sustained daily close above $74 separates a genuine recovery toward $88 from a bear flag breakdown toward $52.
Recommended Articles


