


Morgan Stanley’s Bitcoin ETF Launch “Imminent”, But Price May Not Cross $75,000
Bitcoin (BTC) is trading at $69,834 on March 26, 2026, pulling back 2.11% on the day after failing once again to hold above $71,000.
The Money Flow Index (MFI) sits at 69.38 on the daily chart, approaching but not yet clearing the 80-level overbought threshold. Two other signals that suggest the market is not positioned for an immediate move higher.
Morgan Stanley Bitcoin ETF Enters a Weak Flow Environment
Morgan Stanley’s Bitcoin ETF launch is reportedly imminent, per Bloomberg analyst Eric Balchunas. The official NYSE listing announcement adds weight to the prospect.
A development such as this would ordinarily be a strong catalyst. However, the timing lands against a backdrop of disappointing ETF flows and slowing long-term holder accumulation.
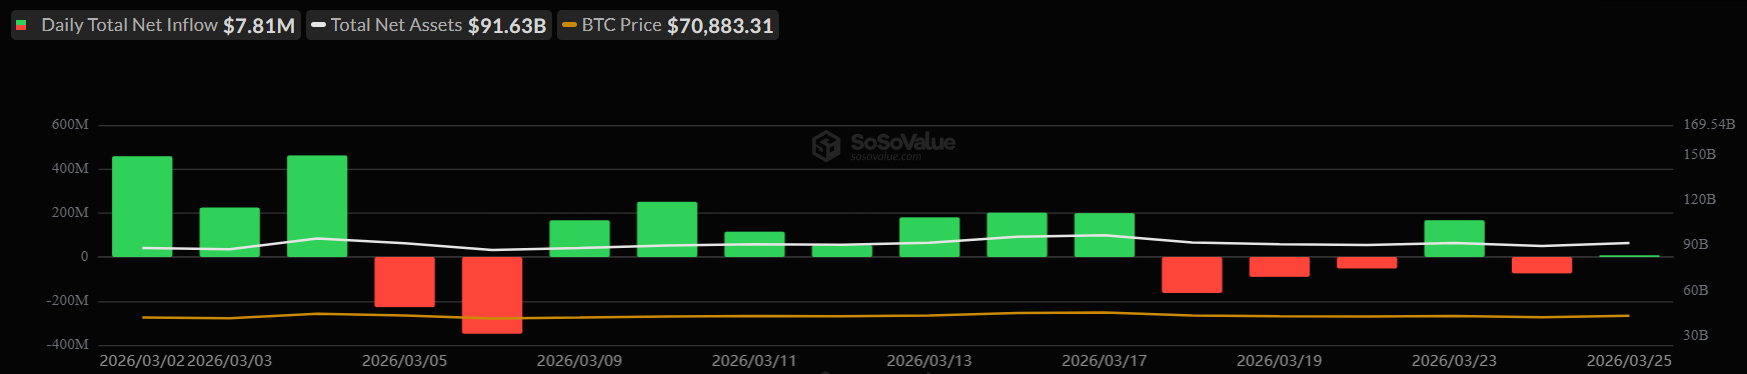
Bitcoin spot ETFs recorded a daily total net inflow of just $7.81 million on March 25, a figure that stands well below the early-March peaks visible on the SoSoValue chart. The total net assets across all Bitcoin spot ETFs stand at $91.63 billion, and the white trend line on the chart shows that figure has been gradually declining since early March.
The March 5 and 6 sessions saw large red bars reaching approximately -$400 million in daily net outflows — the worst of the month. While flows recovered through mid-March with consistent green bars, the most recent sessions from March 19 through March 25 show shrinking positive inflows and a return of small red bars on March 20 and 21.
Want more token insights like this? Sign up for Editor Harsh Notariya’s Daily Crypto Newsletter here.
 Bitcoin ETF Flows. Source: SoSovalue
Morgan Stanley stepping into this space adds a credible long-term demand channel. However, the institutional appetite visible in the current flow data does not support an immediate price breakout. A sustained recovery in daily net inflows above the $200 million range would need to precede any meaningful price follow-through.
Long-Term BTC Holders Are Slowing Their Accumulation
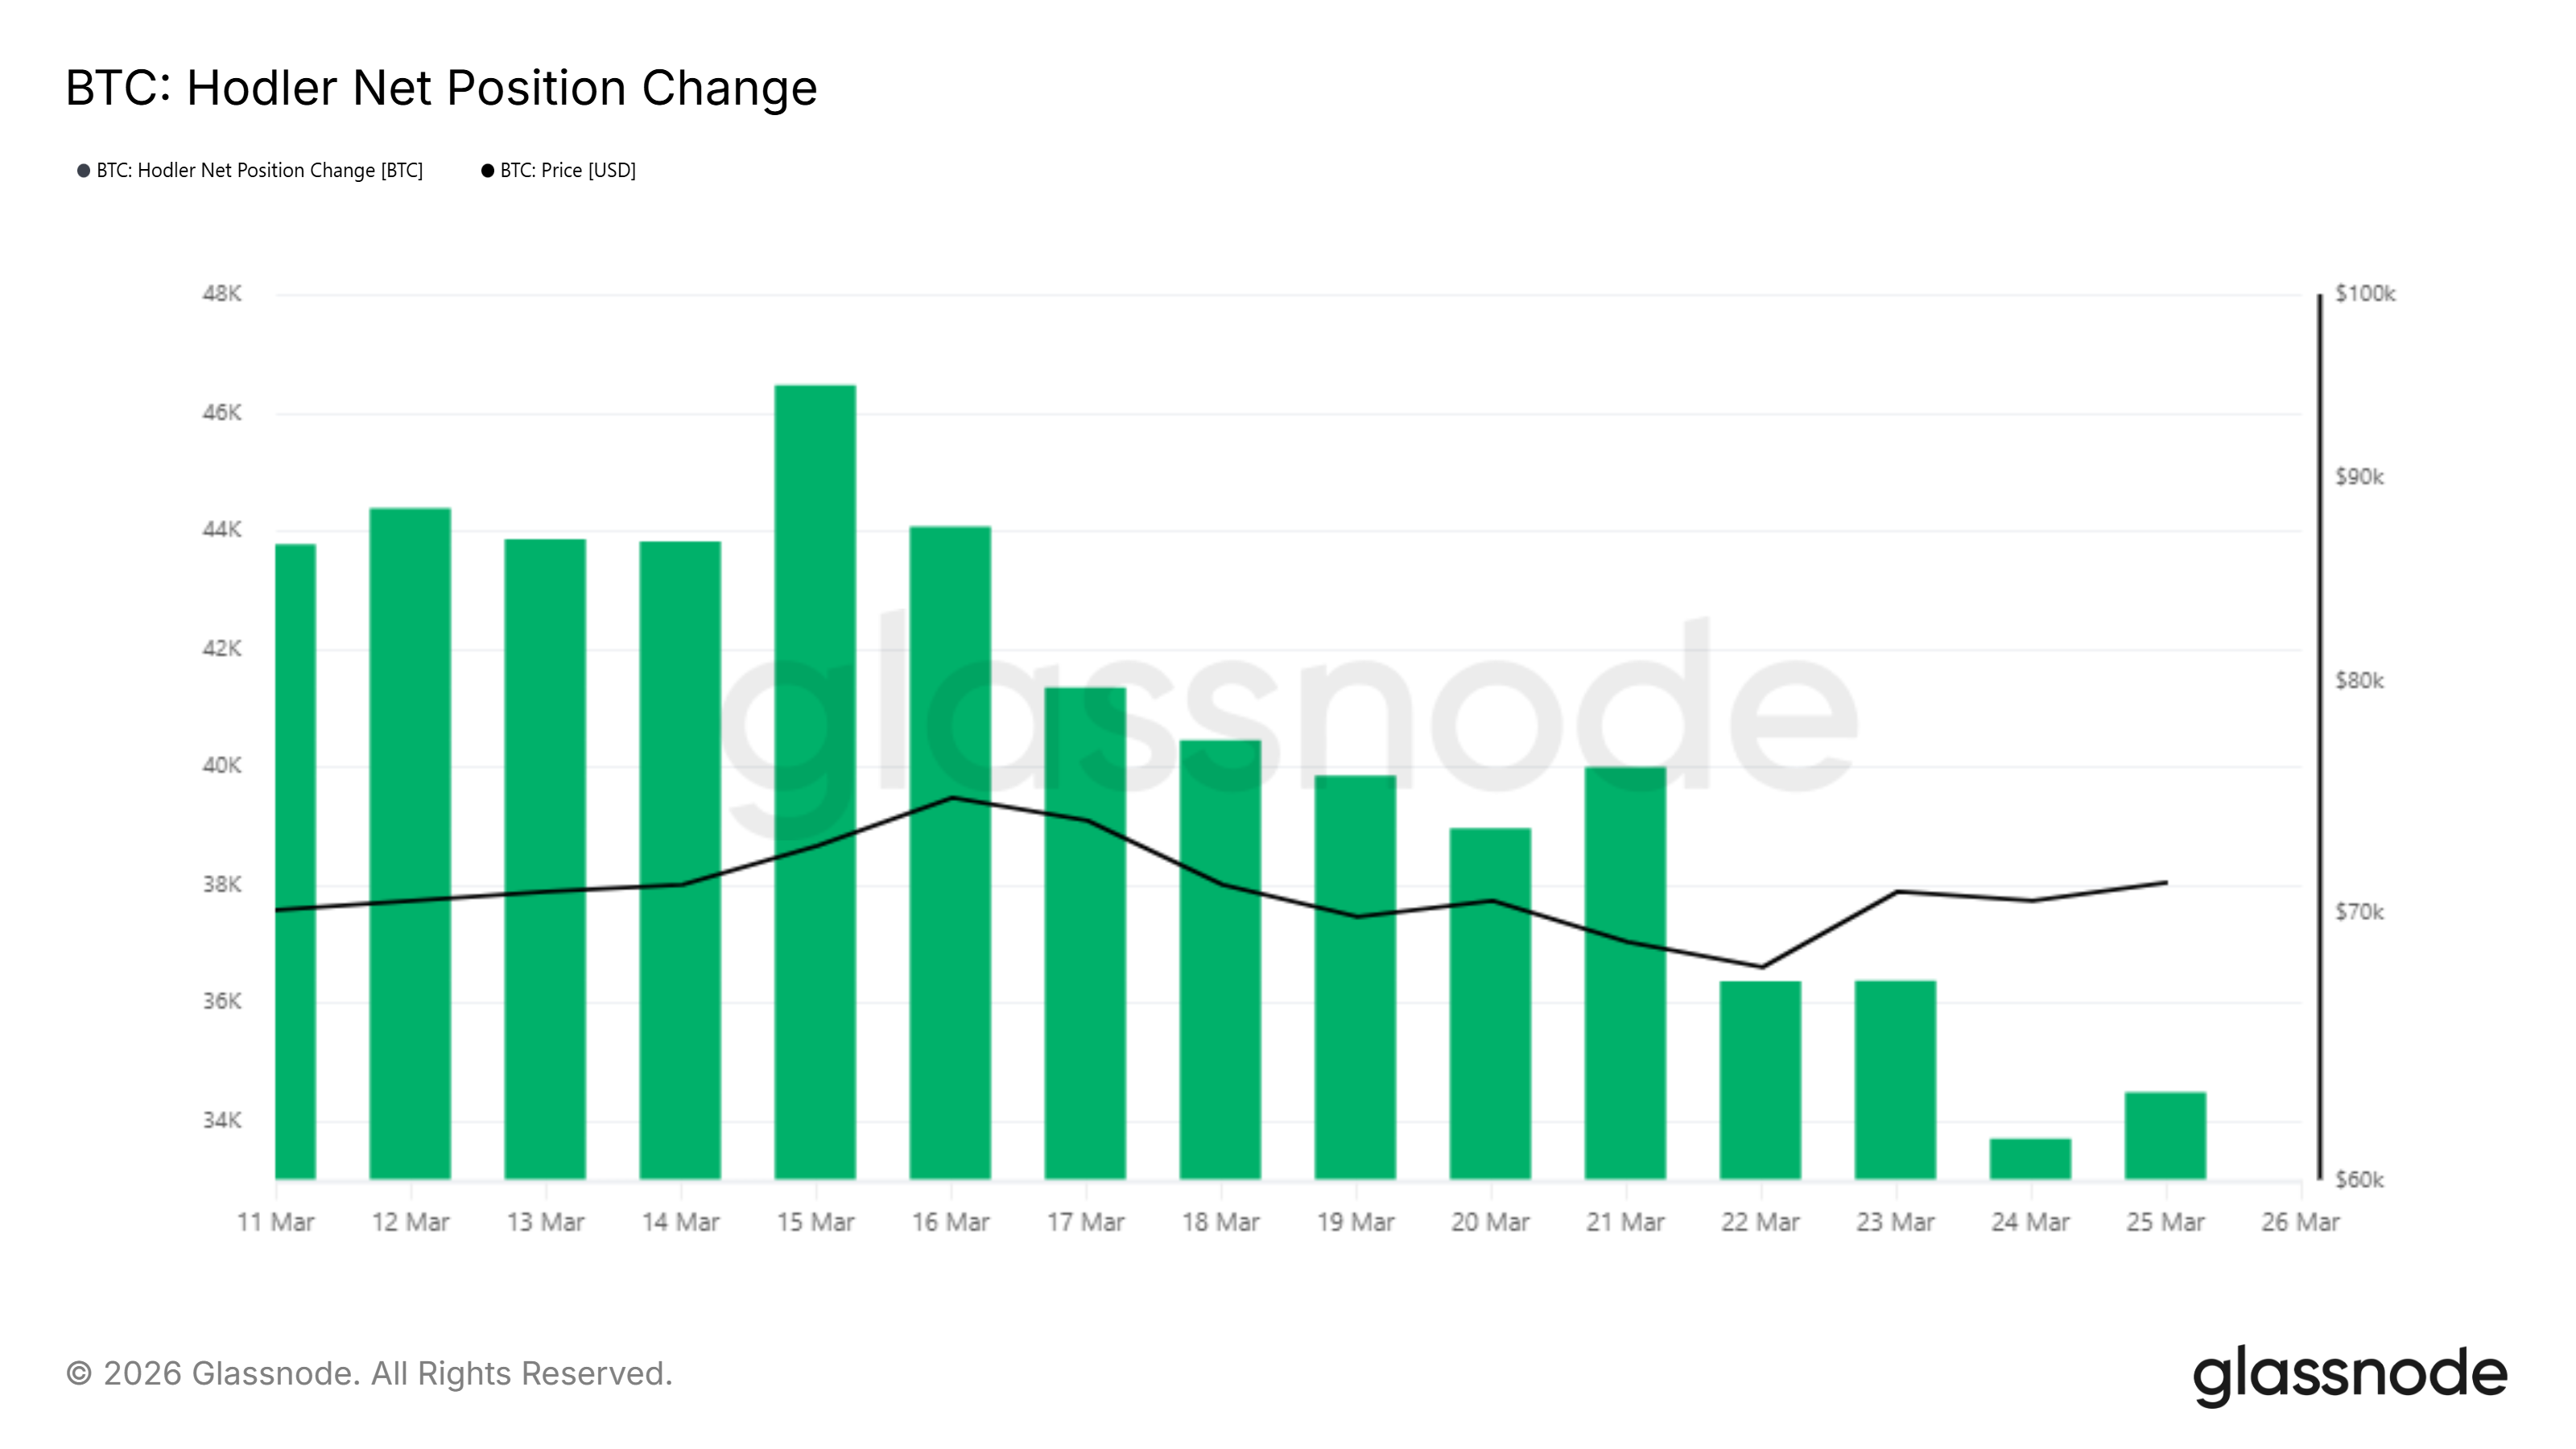
The Glassnode hodler net position change chart covers March 11 through March 25. Every bar in this period is green, meaning long-term Bitcoin holders were net accumulators throughout. However, the size of those bars tells a different story as the month progressed.
From March 11 through March 16, daily accumulation ranged between 44,000 and 46,000 BTC. After March 17, the bars began declining in height consistently, dropping to approximately 36,000 BTC by March 22, then falling sharply to roughly 33,000 BTC on March 24 and recovering only slightly to around 34,000 BTC on March 25.
 Bitcoin HODLer Net Position Change. Source: Glassnode
Long-term holders have not stopped accumulating, but the pace has slowed materially in the final week of March. That deceleration, occurring precisely as price failed to hold above $71,000 on multiple occasions, suggests that conviction at current levels is weakening rather than building.
BTC Price Must Face a Level It Has Already Lost To
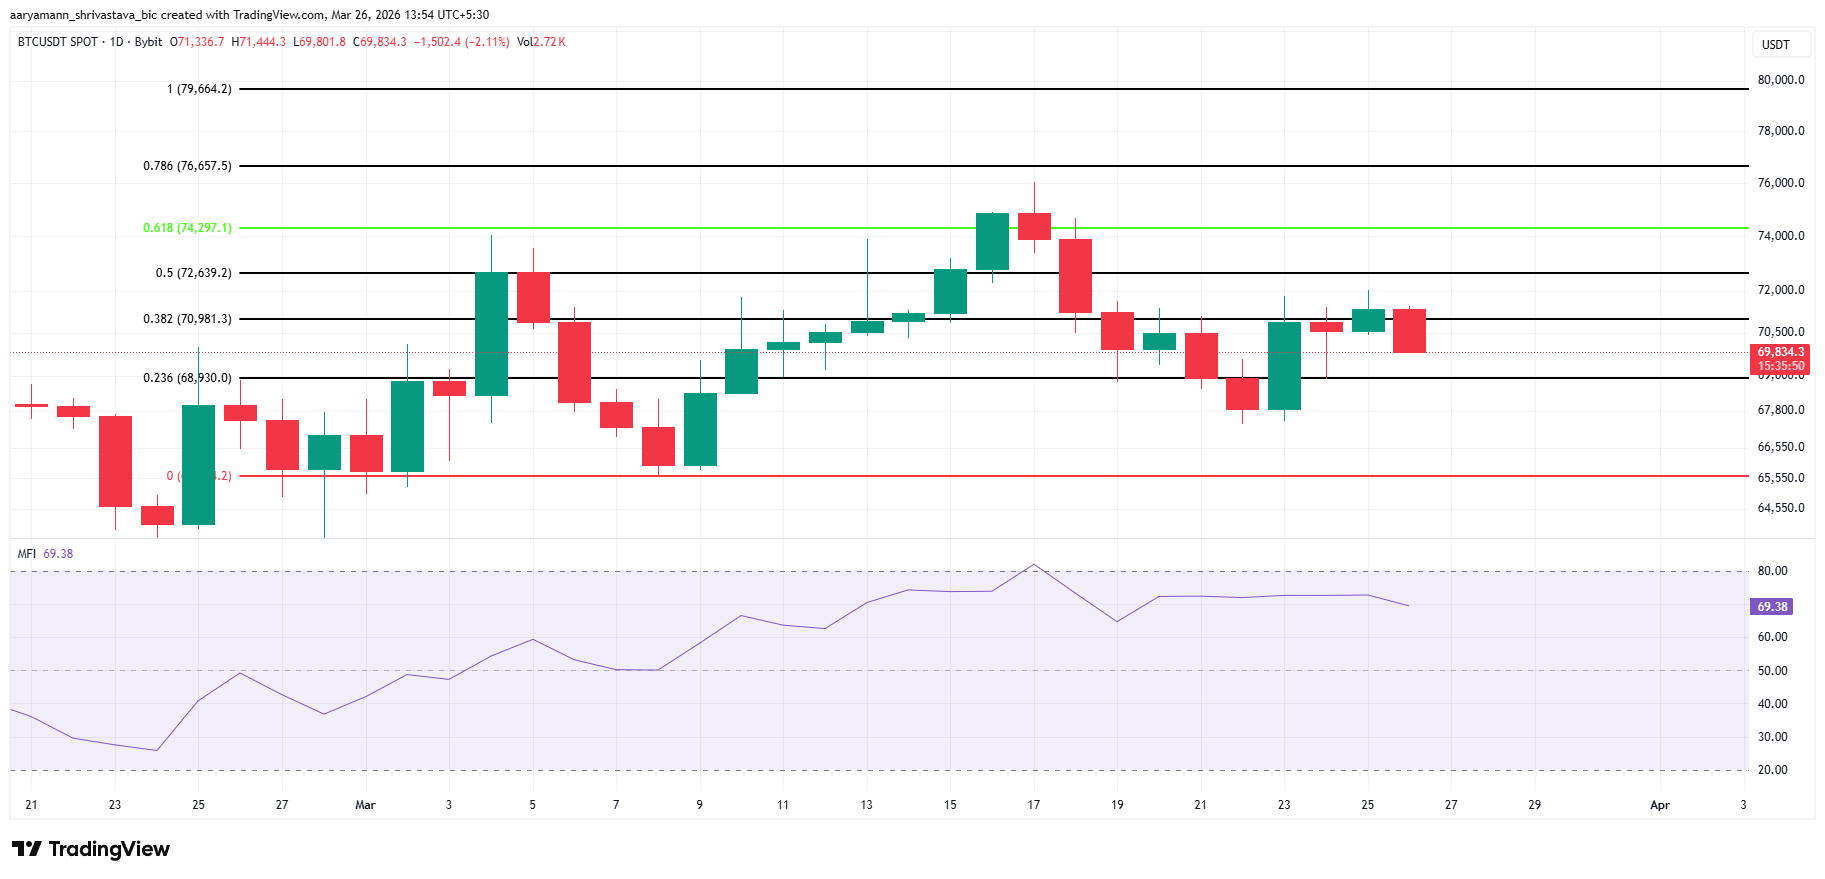
The Fibonacci retracement grid on the daily chart runs from the $65,550 zero level to the $79,664 one level. The 61.8% retracement sits at $74,297, highlighted by the green horizontal line. BTC reached that zone three times during March — on approximately March 5, March 17, and March 19 — and was rejected each time without a daily close above it.
Current price at $69,834 places BTC between the 23.6% level at $68,930 and the 38.2% level at $70,981. The MFI at 69.38 remains below 80, meaning there is room for buying pressure to build before the indicator signals overbought conditions.
 Bitcoin Price Analysis. Source: TradingView
However, MFI reached above 80 in mid-March and failed to produce a $74,297 breakout, which limits how much confidence that reading alone can provide.
A daily close above $74,297 would open the path to the 78.6% level at $76,657 and then the full extension at $79,664. The invalidation of the bullish thesis is a daily close below $68,930. That would put the $65,550 floor directly in focus as the next significant level on the chart.
Recommended Articles


