


Silver Price Sets a New 2026 Low, but Is the Bottom Already In?
Silver (XAG/USD) price trades near $69 after touching $60 on March 23, setting a new 2026 year-to-date low. The correction that BeInCrypto’s analysts flagged through a head-and-shoulders breakdown has now played out, overshooting the initial $65 target and extending to $60.
The question is no longer whether the correction would happen. It did. The question now is whether this is the local bottom or just a pause before a deeper move.
Two COT Reports Explain the Correction and Hint at What Comes Next
The correction that began on March 13 did not appear out of nowhere.
Want more insights like this? Sign up for Editor Harsh Notariya’s Daily Crypto Newsletter here.
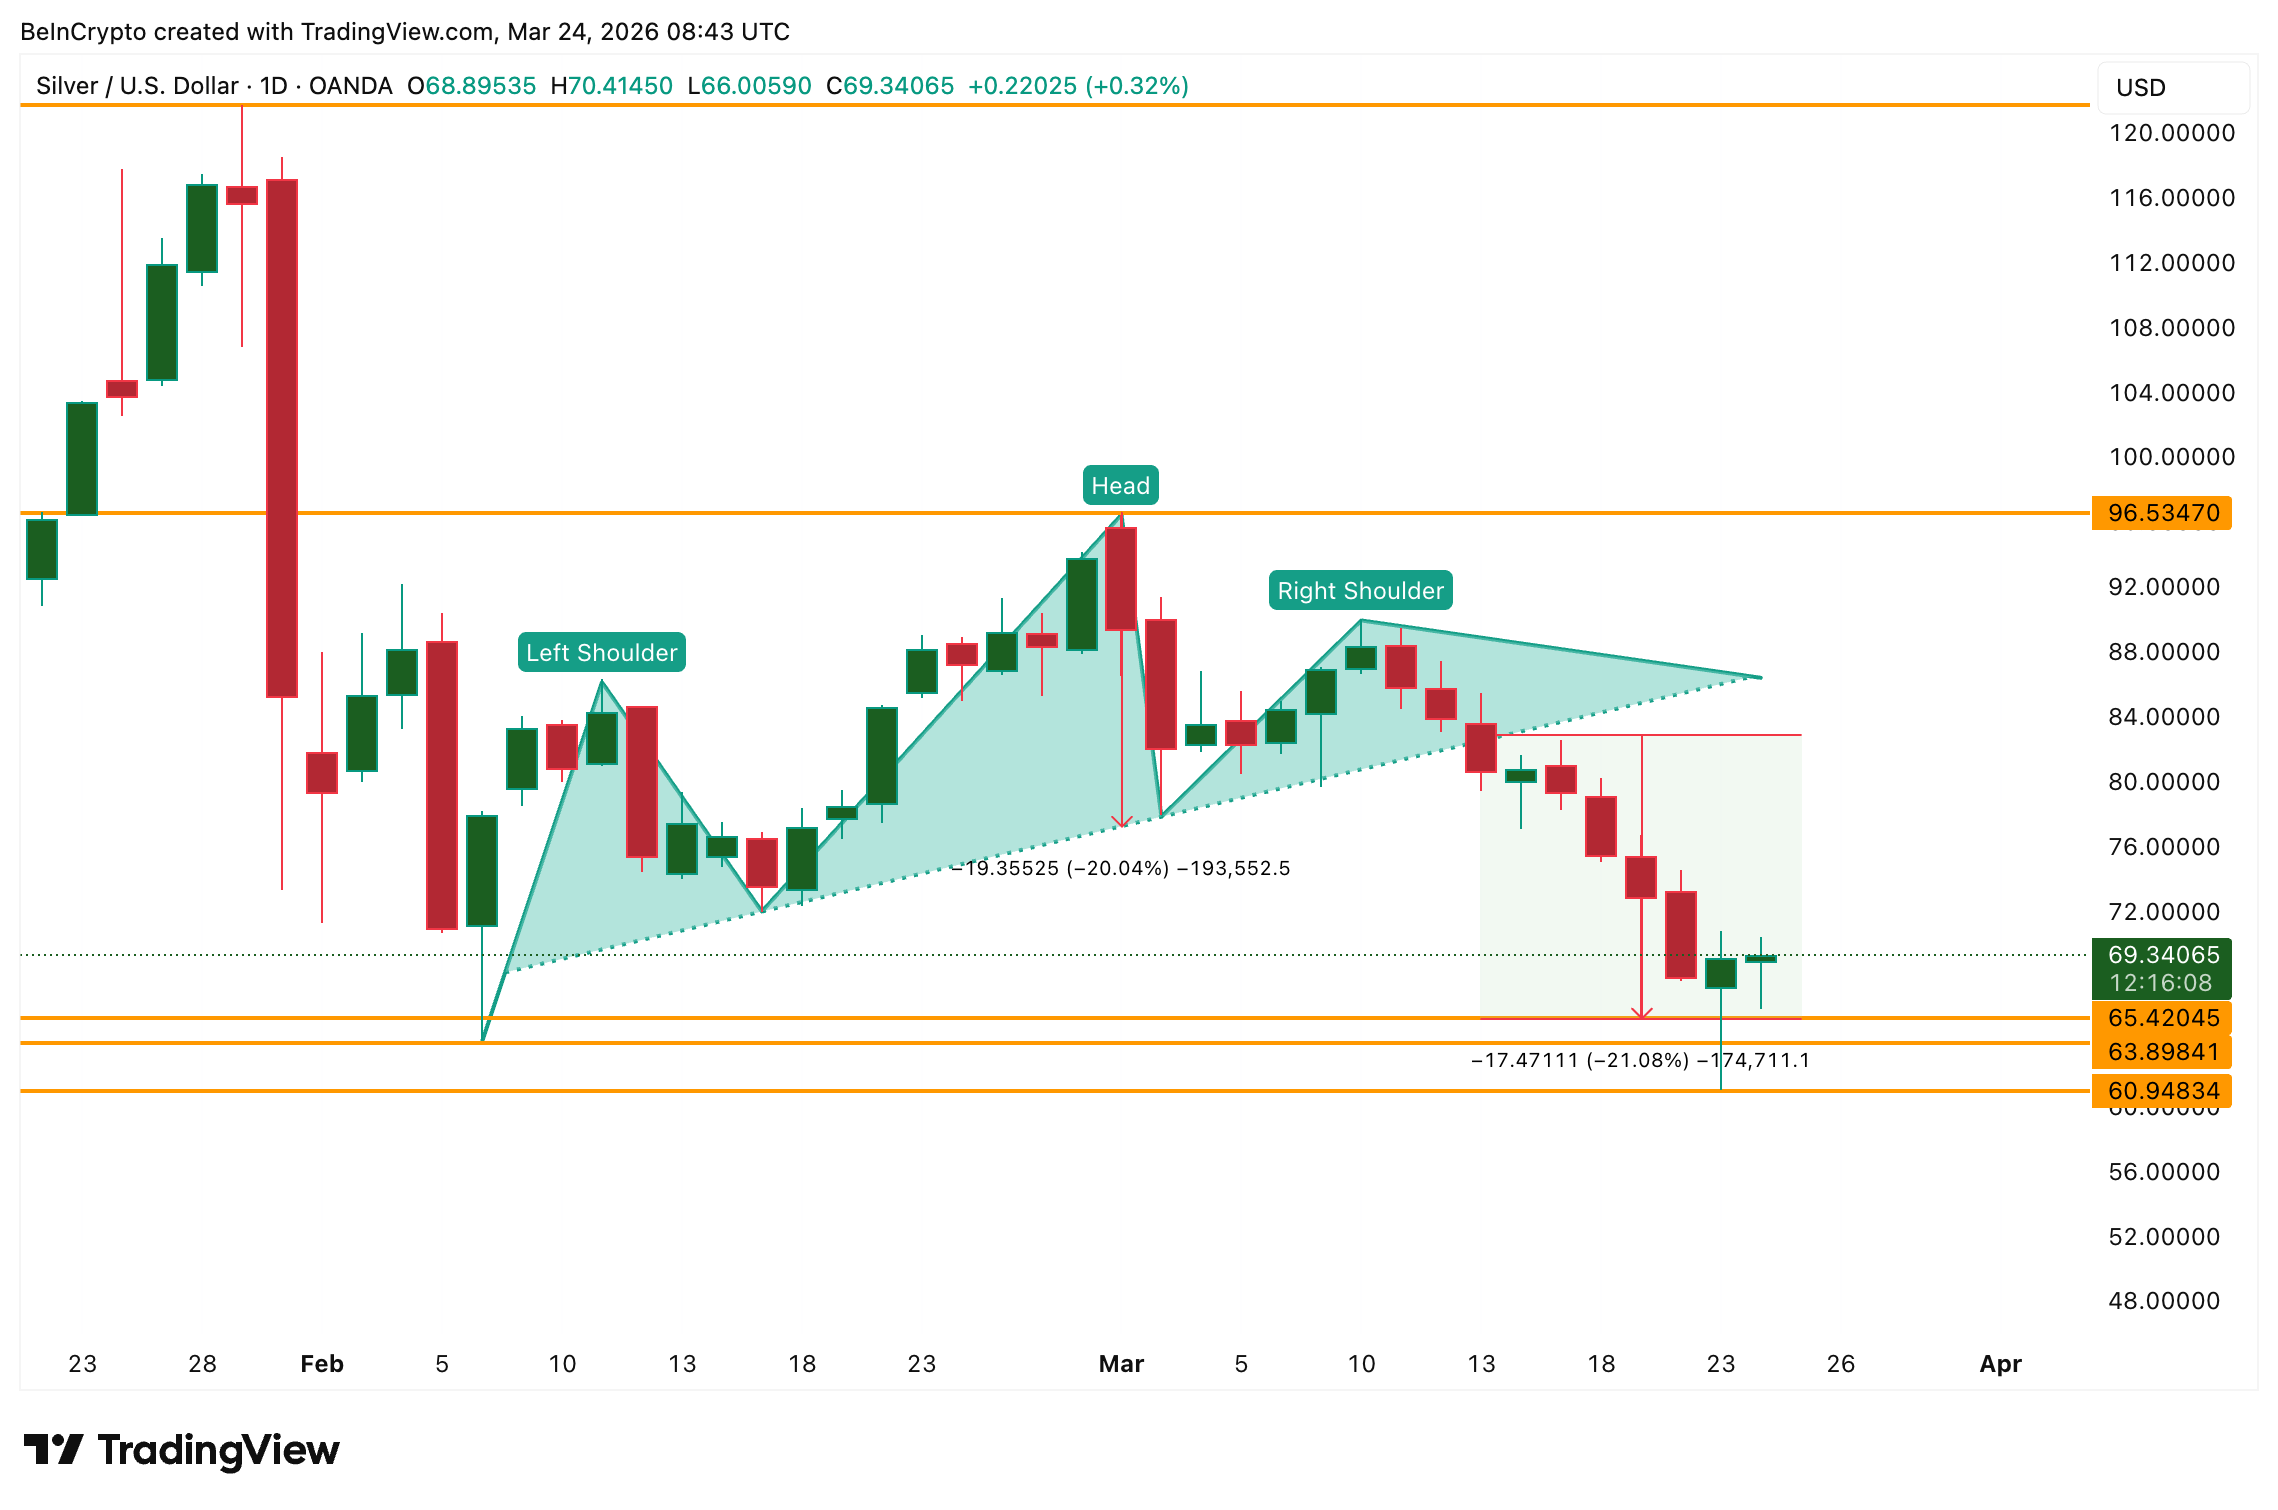 Earlier Price Structure: TradingView
The CFTC’s Commitments of Traders (COT) report as of March 10 already showed large speculators trimming exposure. Non-commercial longs fell by 920 contracts to 33,306 while shorts dropped by 2,160 to 8,728. The net positioning was still long, but the direction had shifted. Open interest rose by 2,132 contracts, indicating new short entries were building alongside long exits.
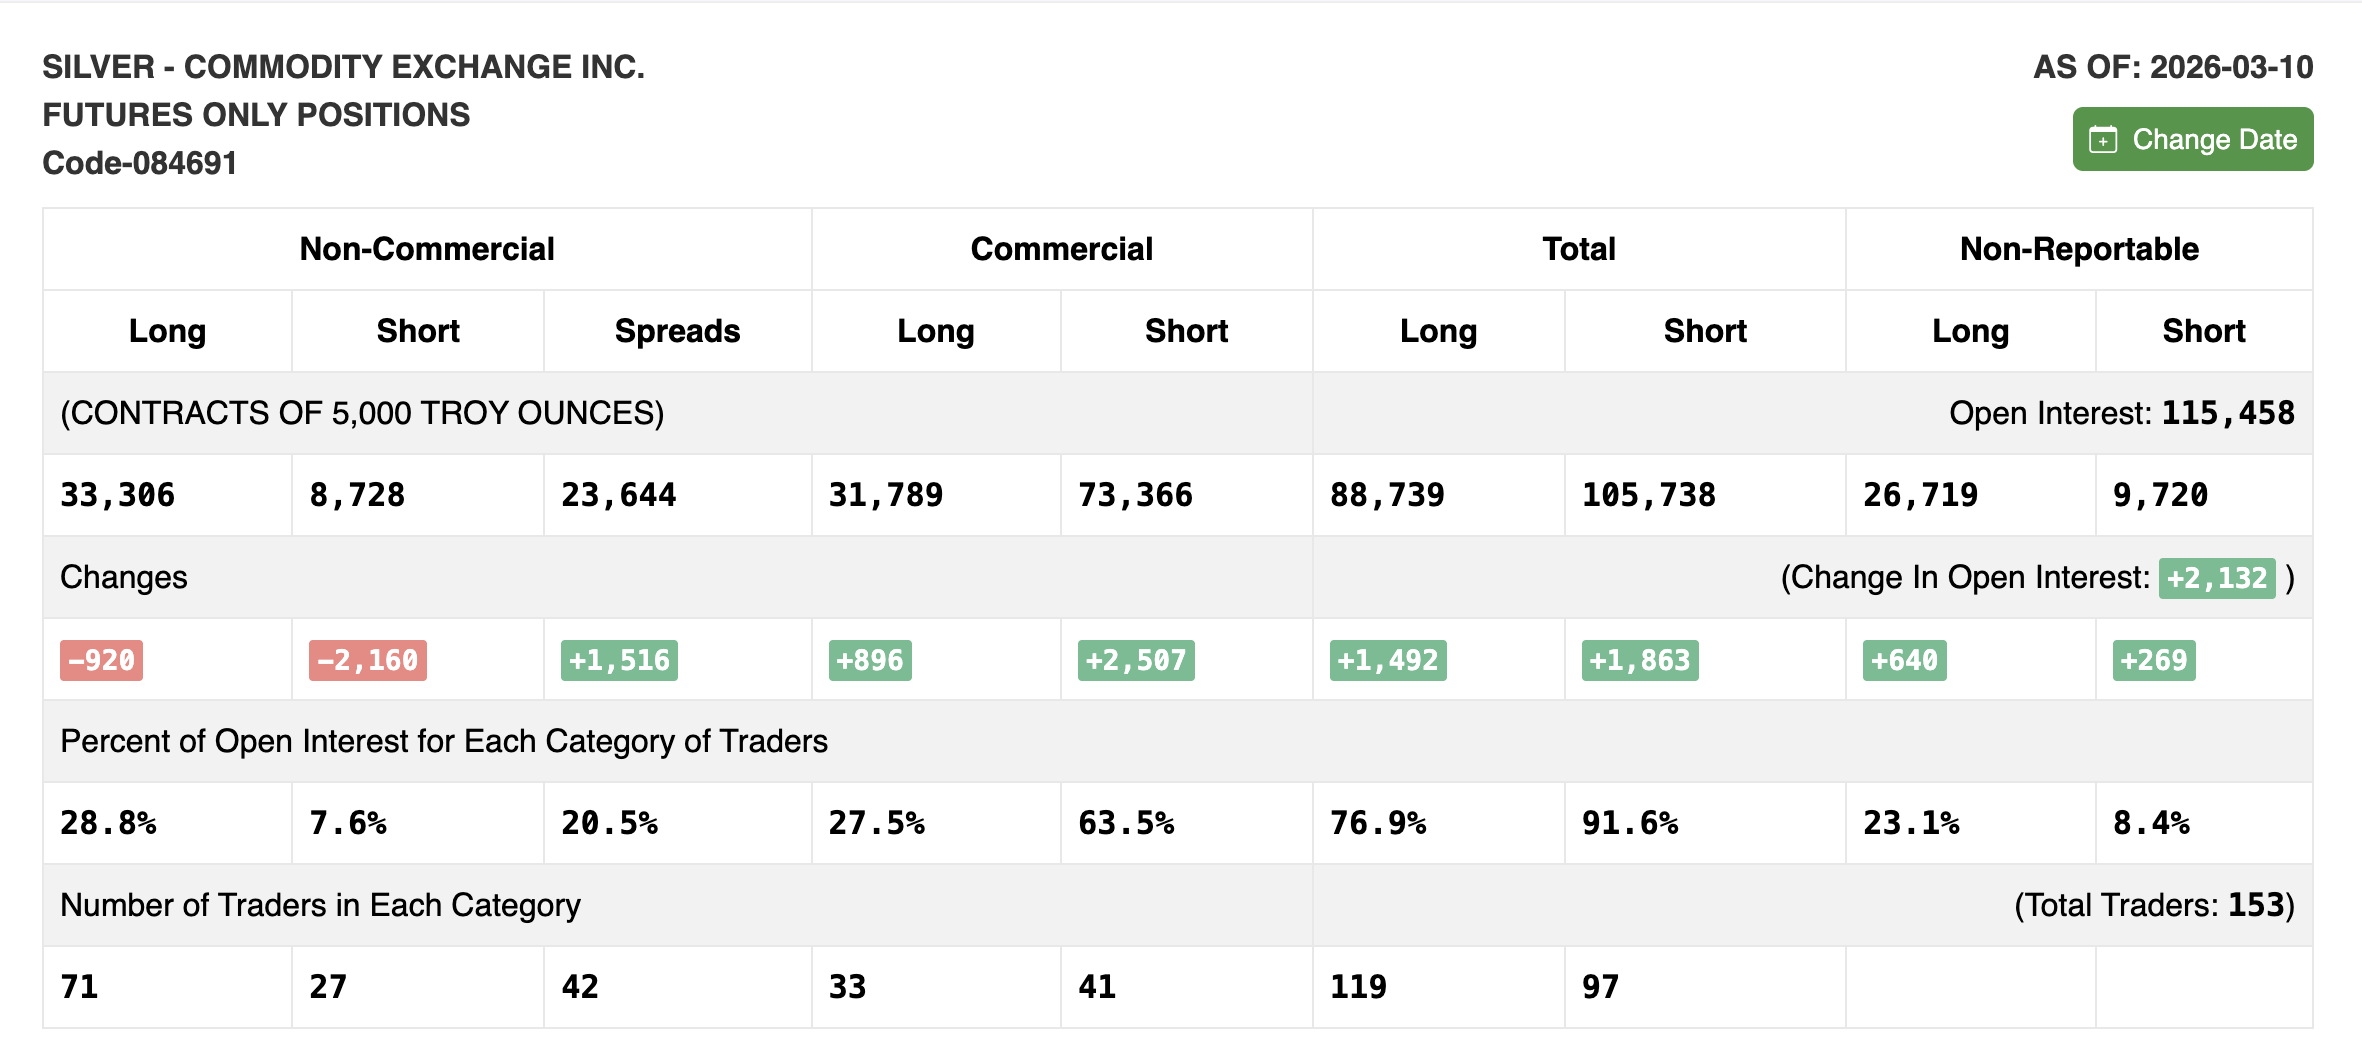 Silver COT Report as of March 10: CFTC
By the March 17 snapshot (released March 20), the deterioration had accelerated. Non-commercial longs dropped by another 2,181 contracts to 31,125, a roughly 7% weekly decline. Shorts rose by 516 to 9,244. Open interest fell by 700 contracts, confirming the selling was liquidation-driven. Between these two snapshots, the silver price fell from approximately $85 to $69, roughly 18% in just over a week.
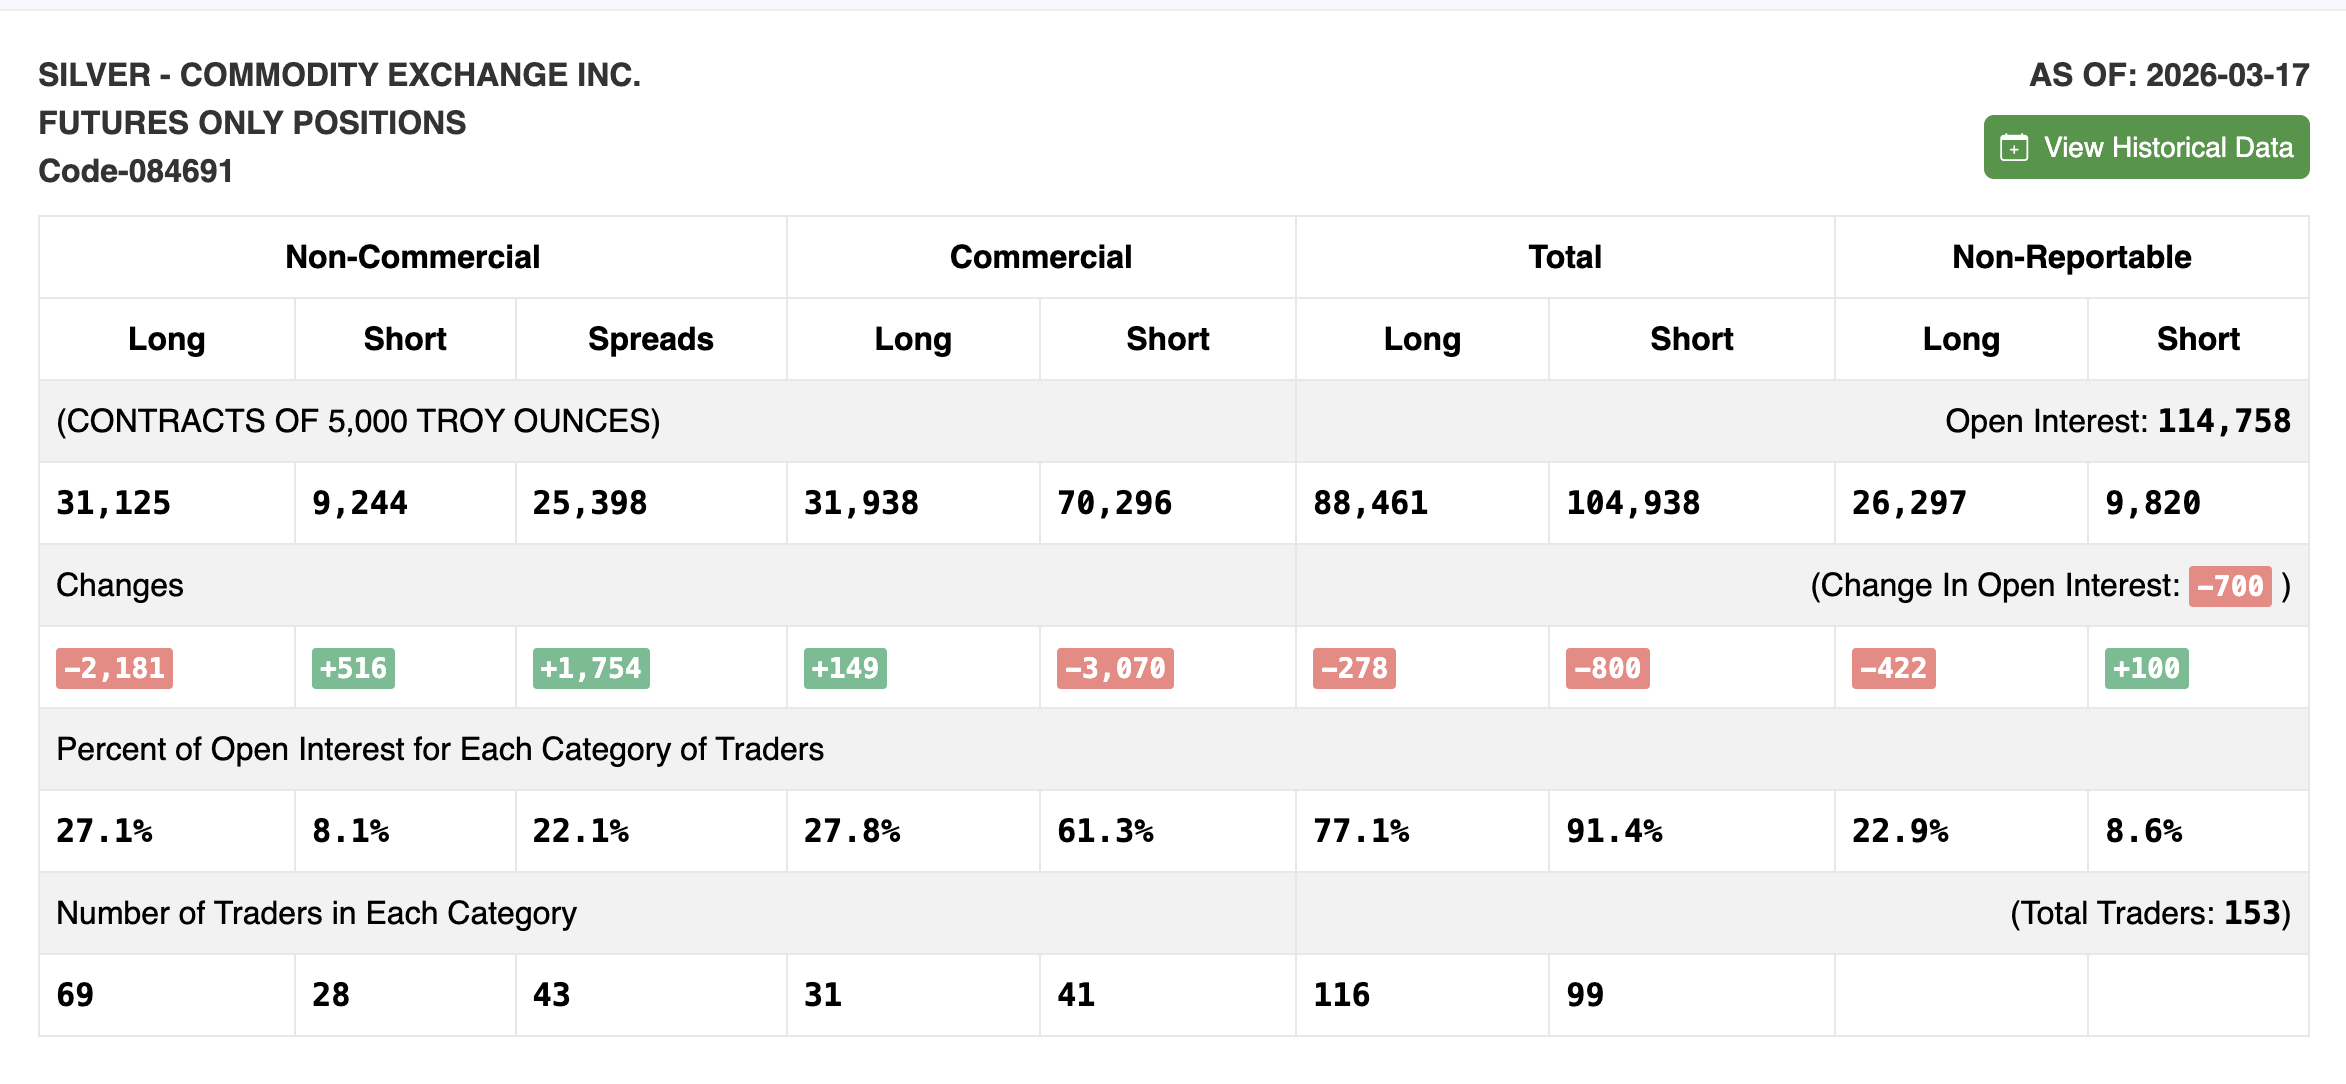 Silver COT Report as of March 17: CFTC
The next COT report arrives on March 27, containing data from today (March 24). If managed money longs tick higher for the first time in weeks, that would be the earliest confirmation of a floor forming. Historically, extreme managed money net short positioning has tended to mark local bottoms.
SLV Options Show a Subtle but Important Shift
The iShares Silver Trust (SLV) ETF put-call ratio adds a complementary layer. On March 17, when SLV closed at $71.66, the volume ratio stood at 0.69 and the open interest ratio at 0.65.
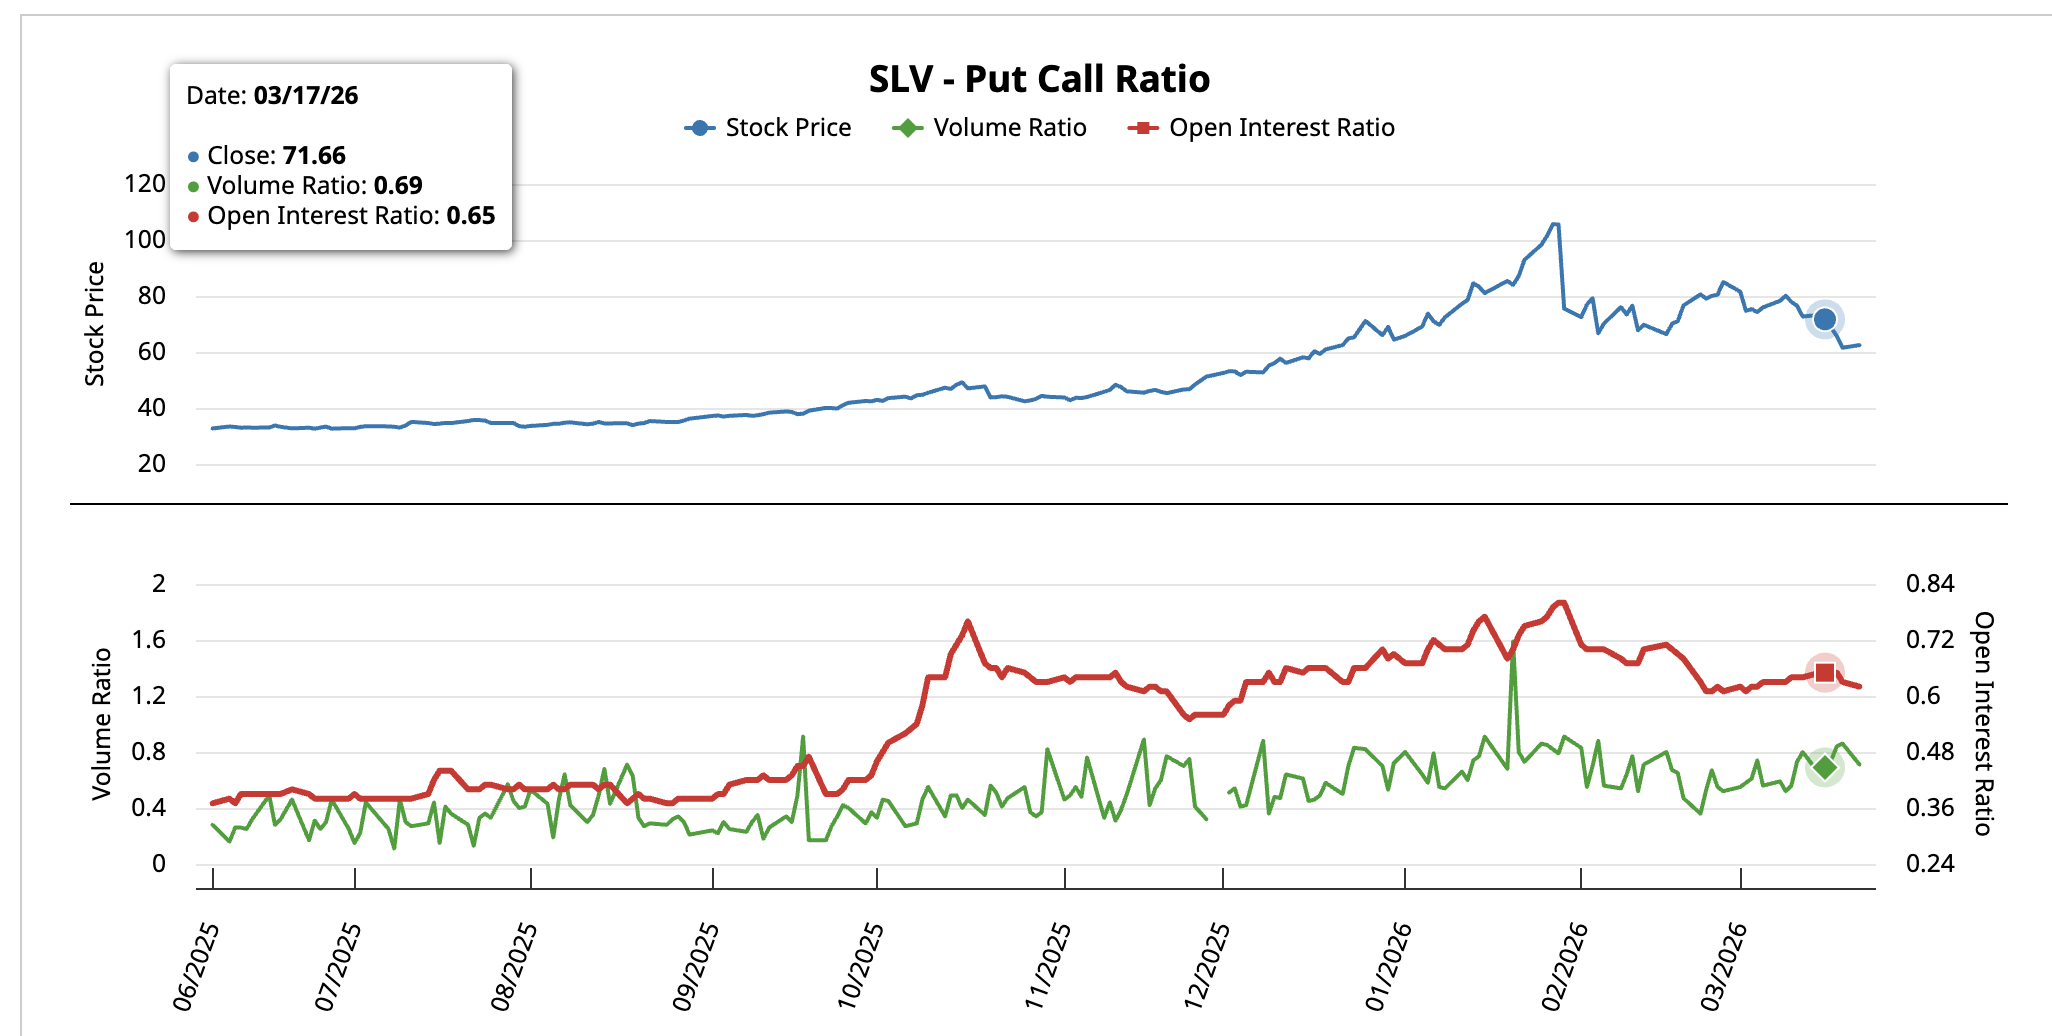 SLV Put-Call Ratio March 17: Barchart
By March 23, after the correction pushed SLV to $62.47, the volume ratio had risen to 0.71 while the open interest ratio dropped to 0.62. The volume ratio rising means more puts were being traded relative to calls, reflecting near-term fear. However, the open interest ratio falling suggests existing put positions were being closed rather than new ones opened.
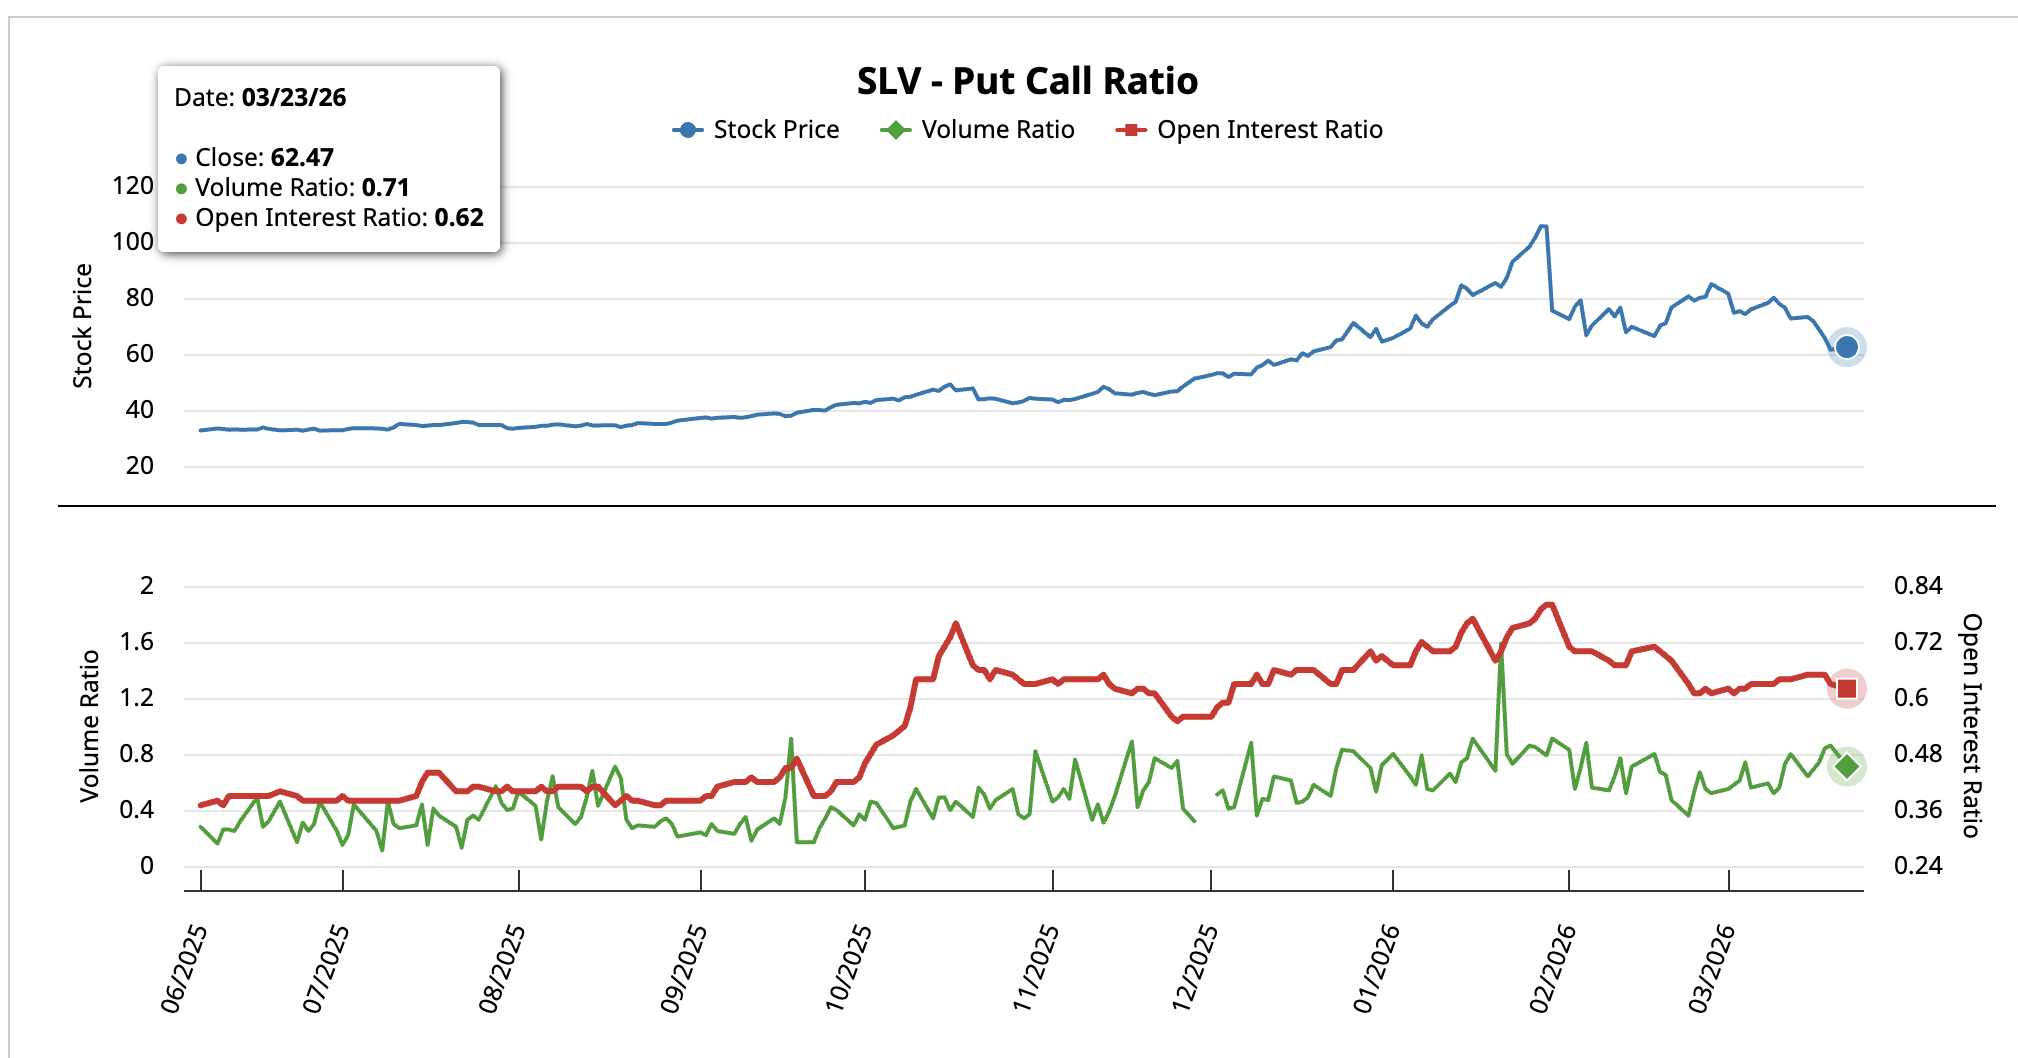 SLV Put-Call Ratio March 23: Barchart
The hedges built before the correction are being unwound now that the move has played out. This divergence suggests the bearish positioning may already have served its purpose.
The COT and options data address futures and ETF positioning. But whether the silver price can sustain a recovery also depends on two macro forces that sit outside the silver market itself.
The Gold-Silver Ratio and DXY Hold the Macro Keys
The gold-silver ratio peaked at 72.81 in early February. It has since declined to 63.37, meaning silver has been gaining relative strength against gold. A drop below the swing low at 62.84 would confirm silver is outperforming gold on a relative basis, a historically bullish signal.
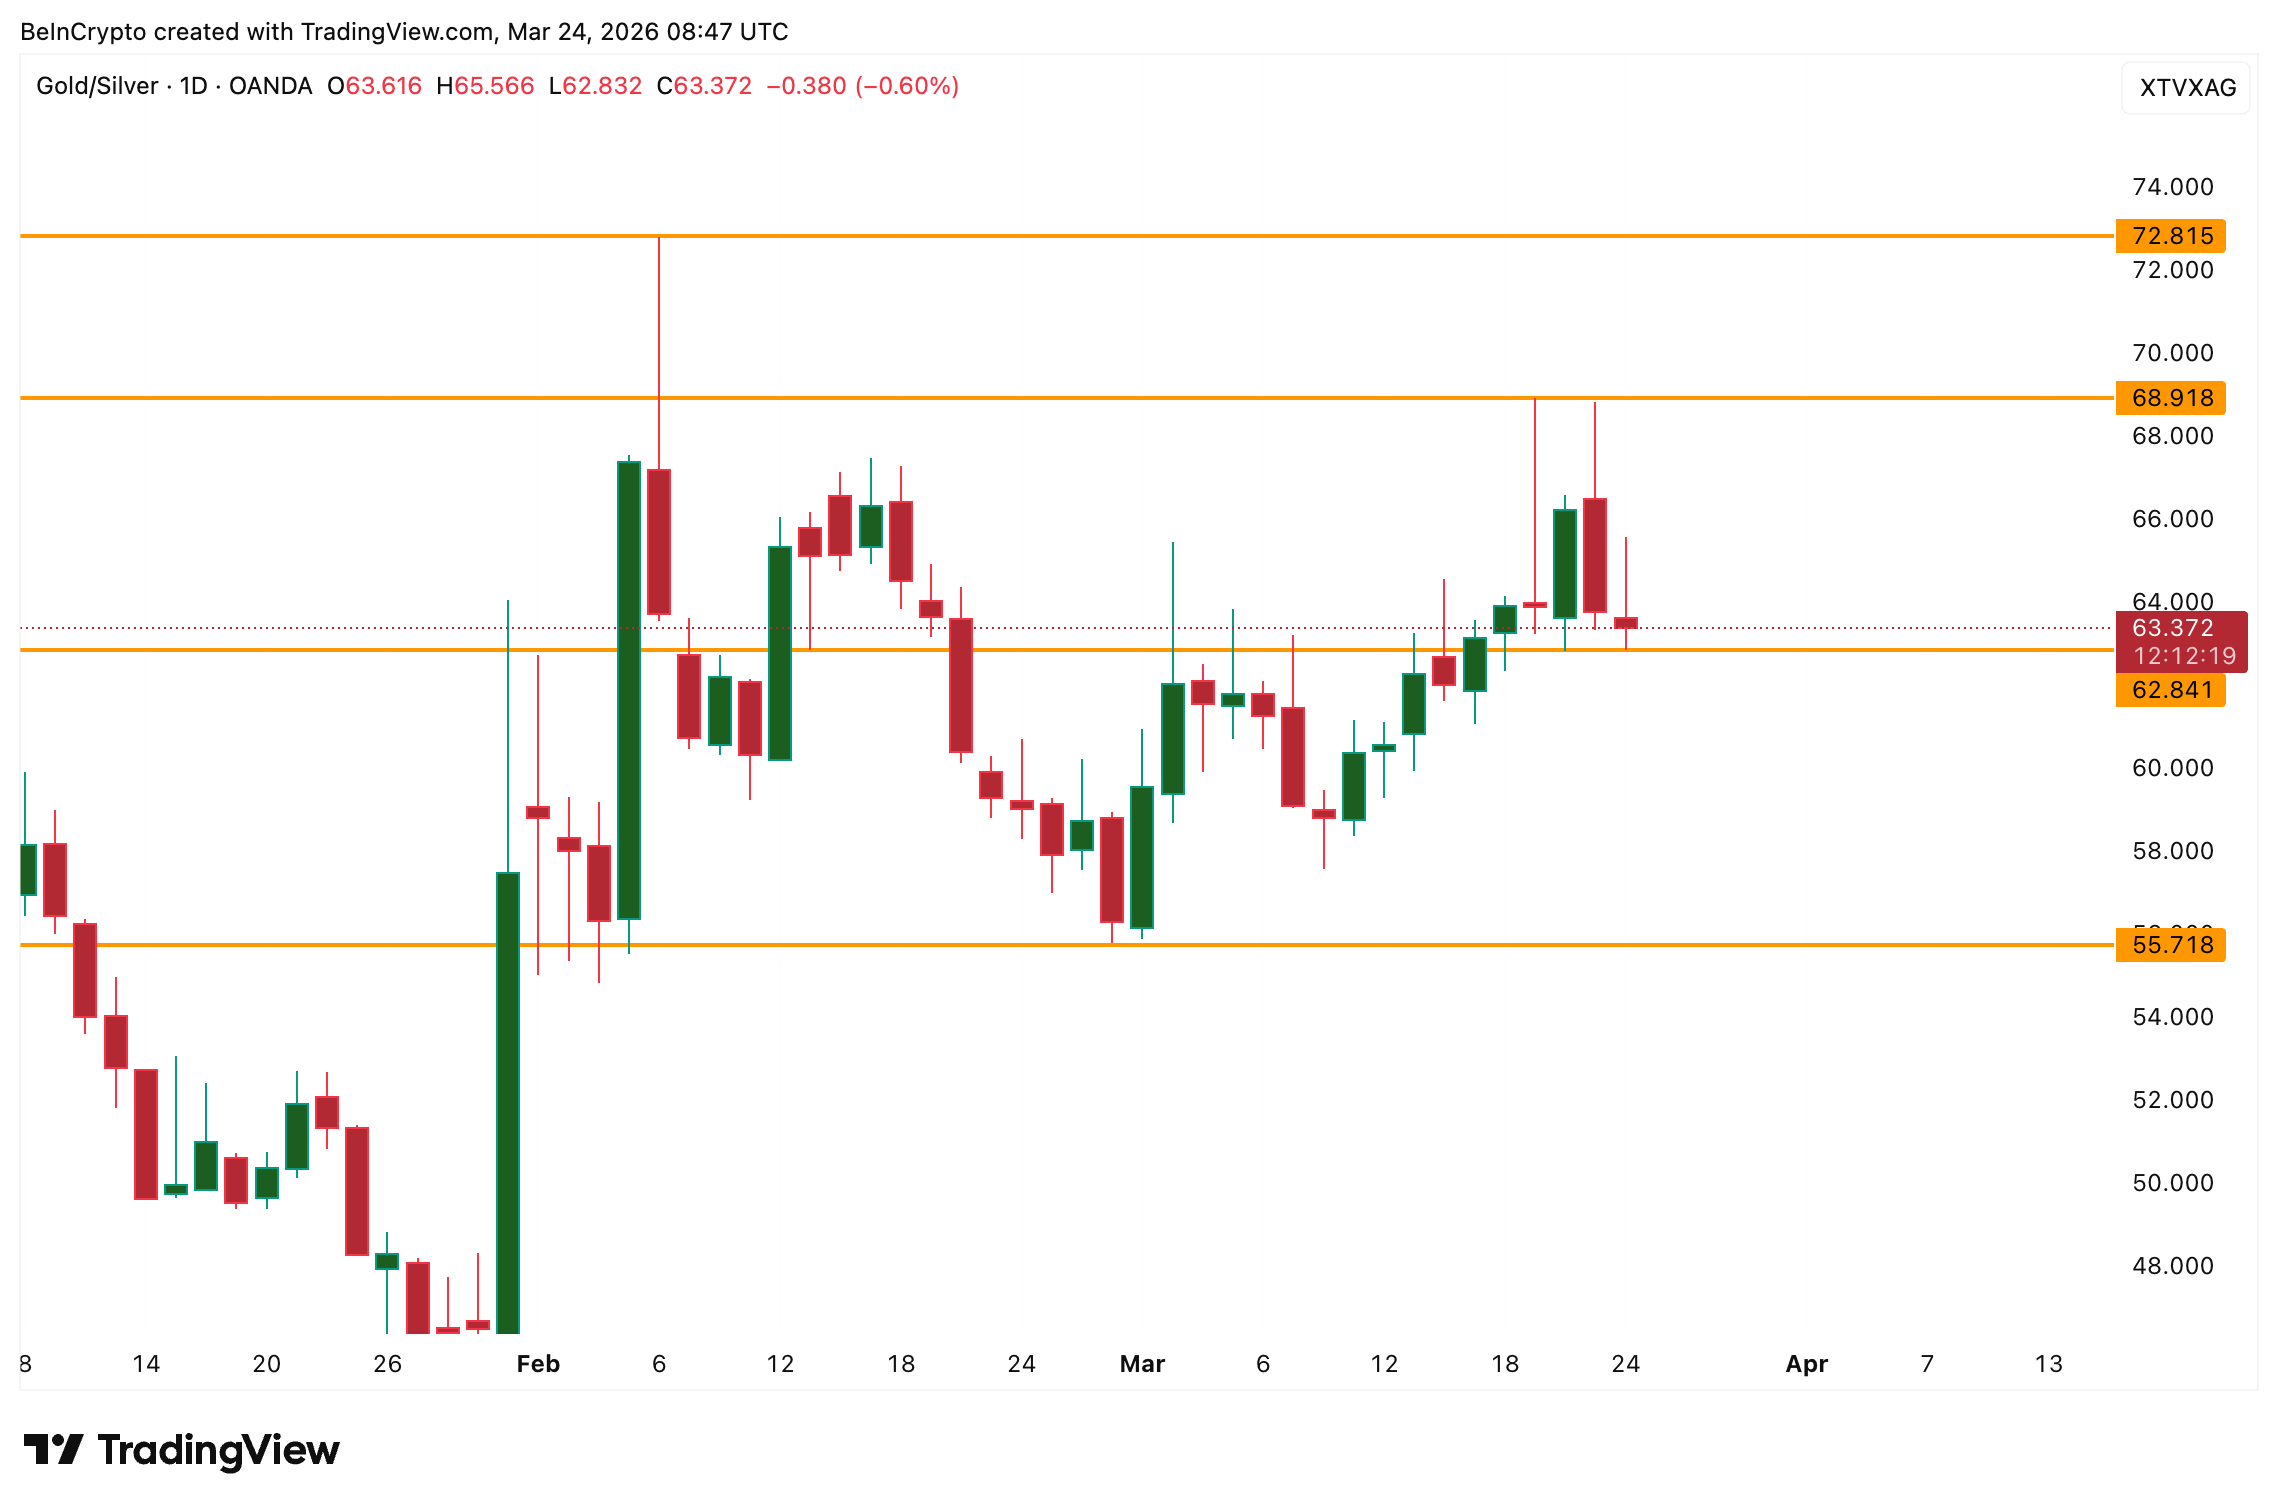 Gold-Silver Ratio: TradingView
The Dollar Index (DXY) remains the overriding macro variable. It currently trades at 99.26 and is forming what resembles a bull flag on the daily chart. It touched 100.56 on March 19, the same day the silver price began its deepest leg lower. If the flag resolves upward past 100, it would create sustained headwinds for silver regardless of the COT or options data.
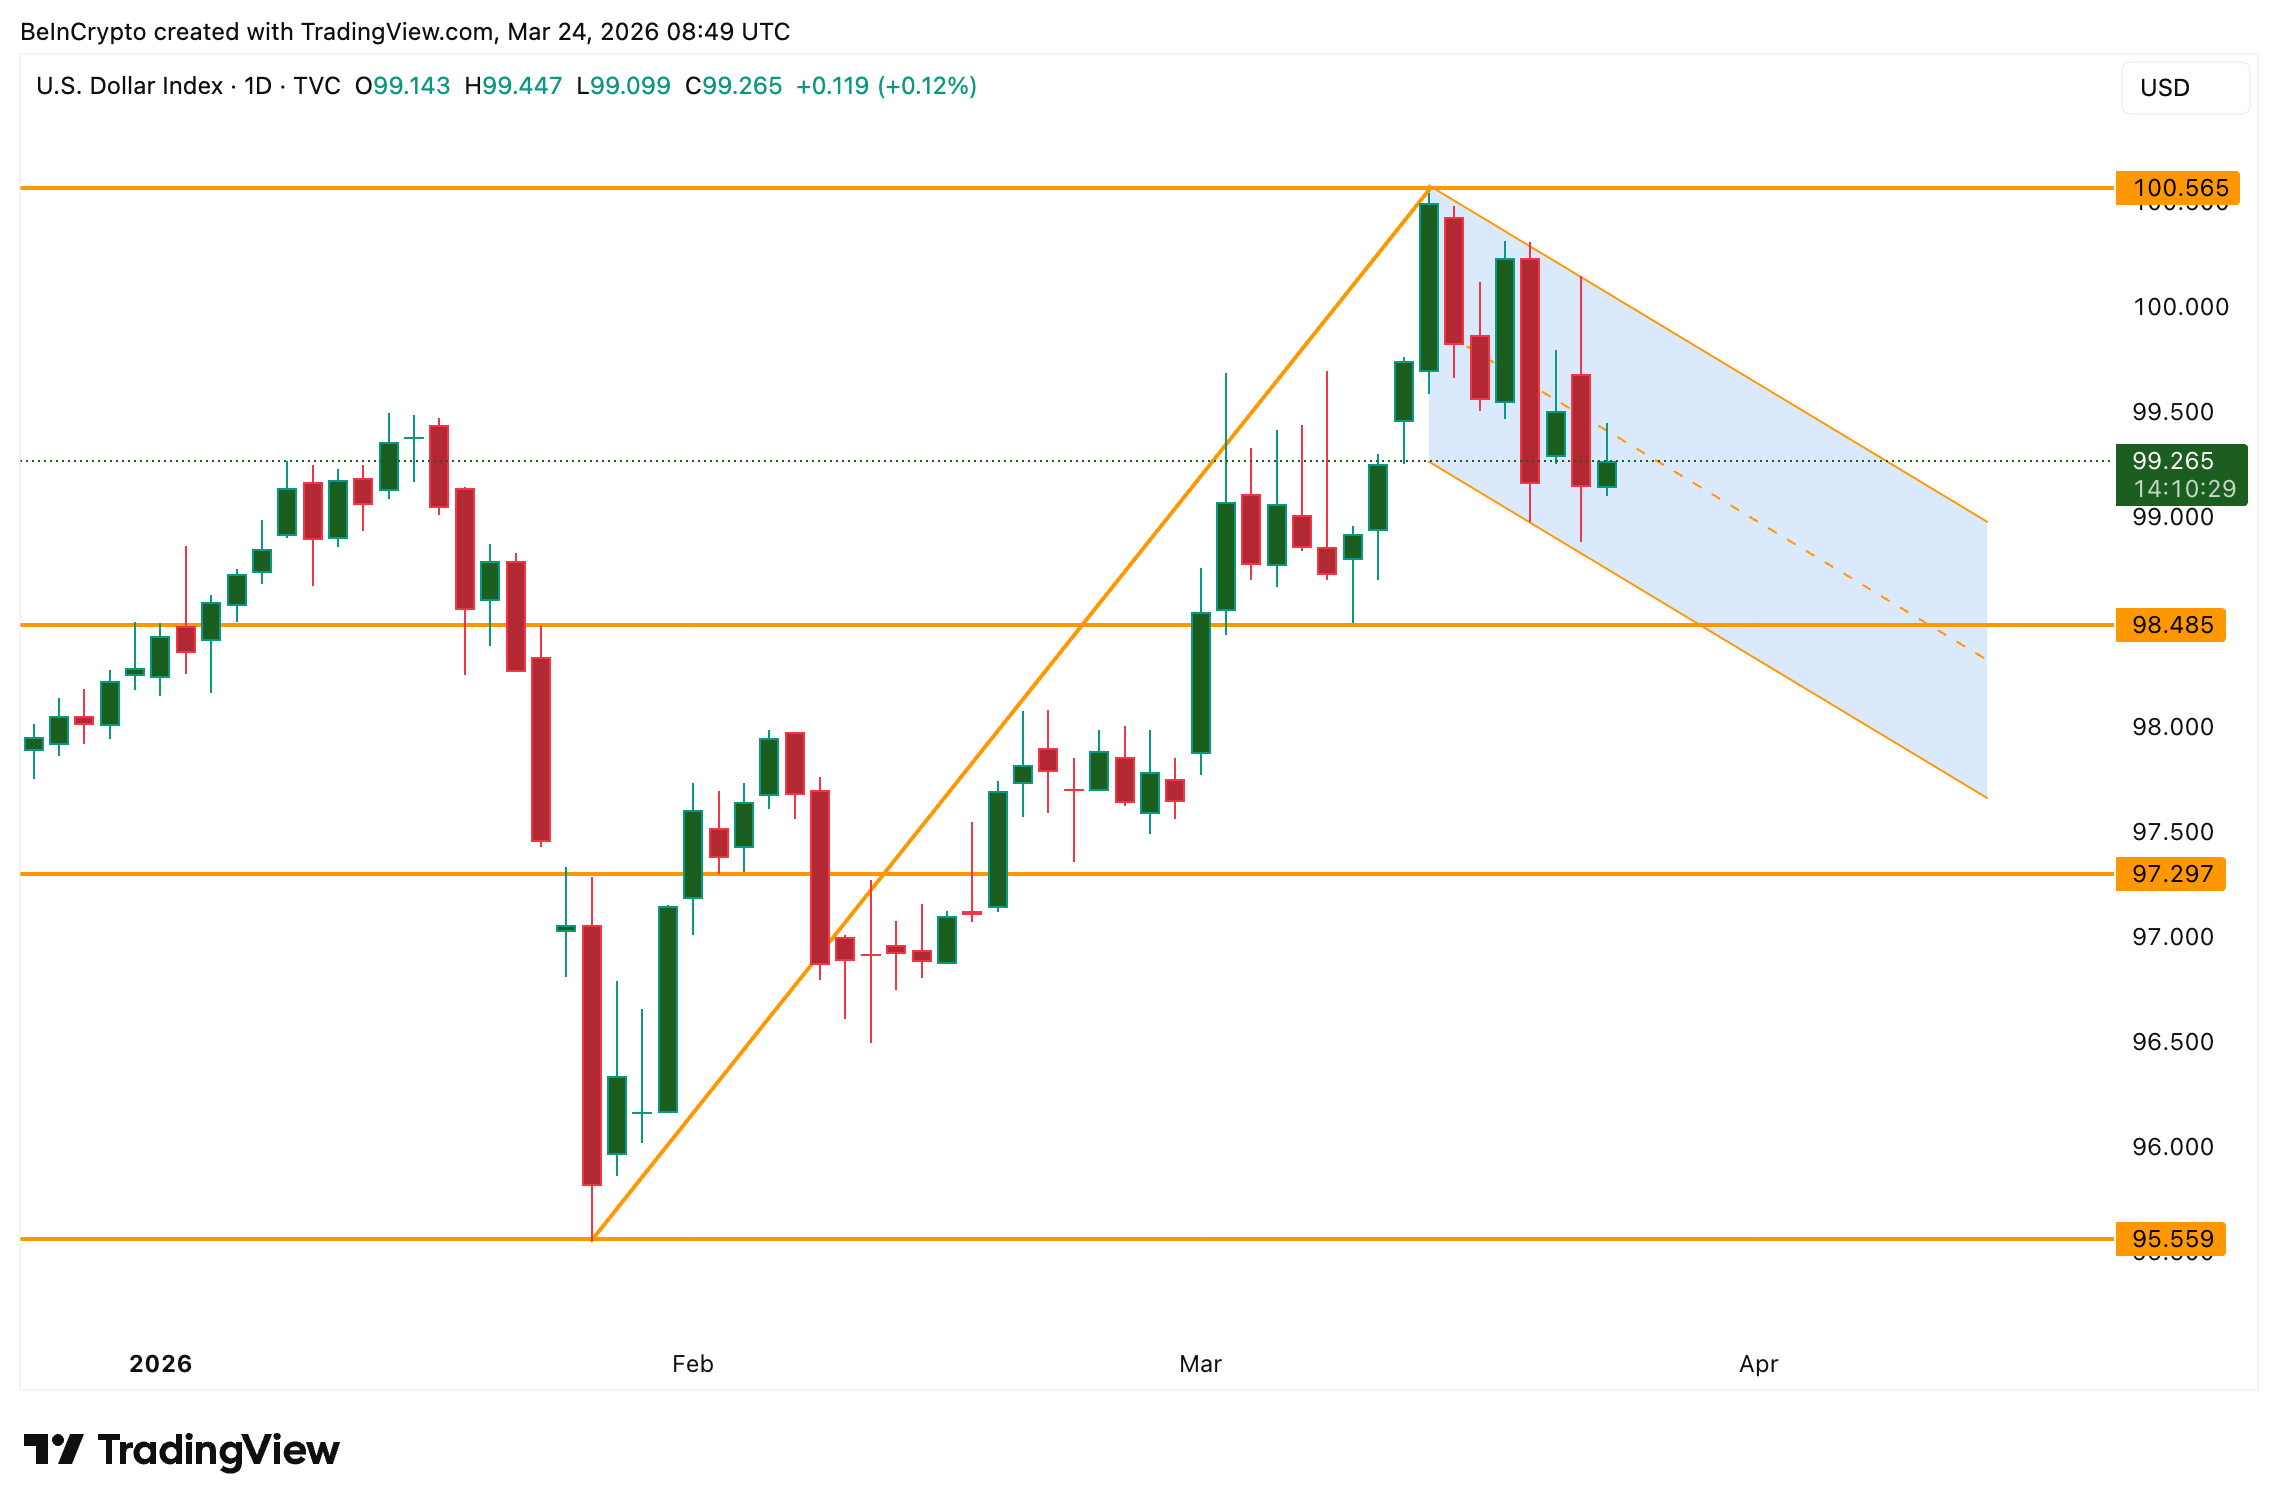 DXY Daily Chart: TradingView
For silver to build a sustained recovery, the DXY needs to break below 98.48, ideally toward 97.30. Any escalation in the Iran conflict that pushes oil higher feeds inflation expectations, which pushes yields higher, which strengthens the dollar, which pressures silver. De-escalation would trigger the reverse chain.
Silver Price Finds Structural Support at a Critical Fibonacci Level
The 12-hour chart reveals two signals that, taken together, build the strongest case for a local bottom.
First, a hidden bullish divergence has formed. The current low near $60 sits at the same price zone that acted as support on December 12. However, the RSI has made a significantly lower low compared to that December reading. This form of hidden bullish divergence, where price holds a similar level while momentum registers lower, suggests selling pressure is exhausting itself even as price retests a known floor-like zone.
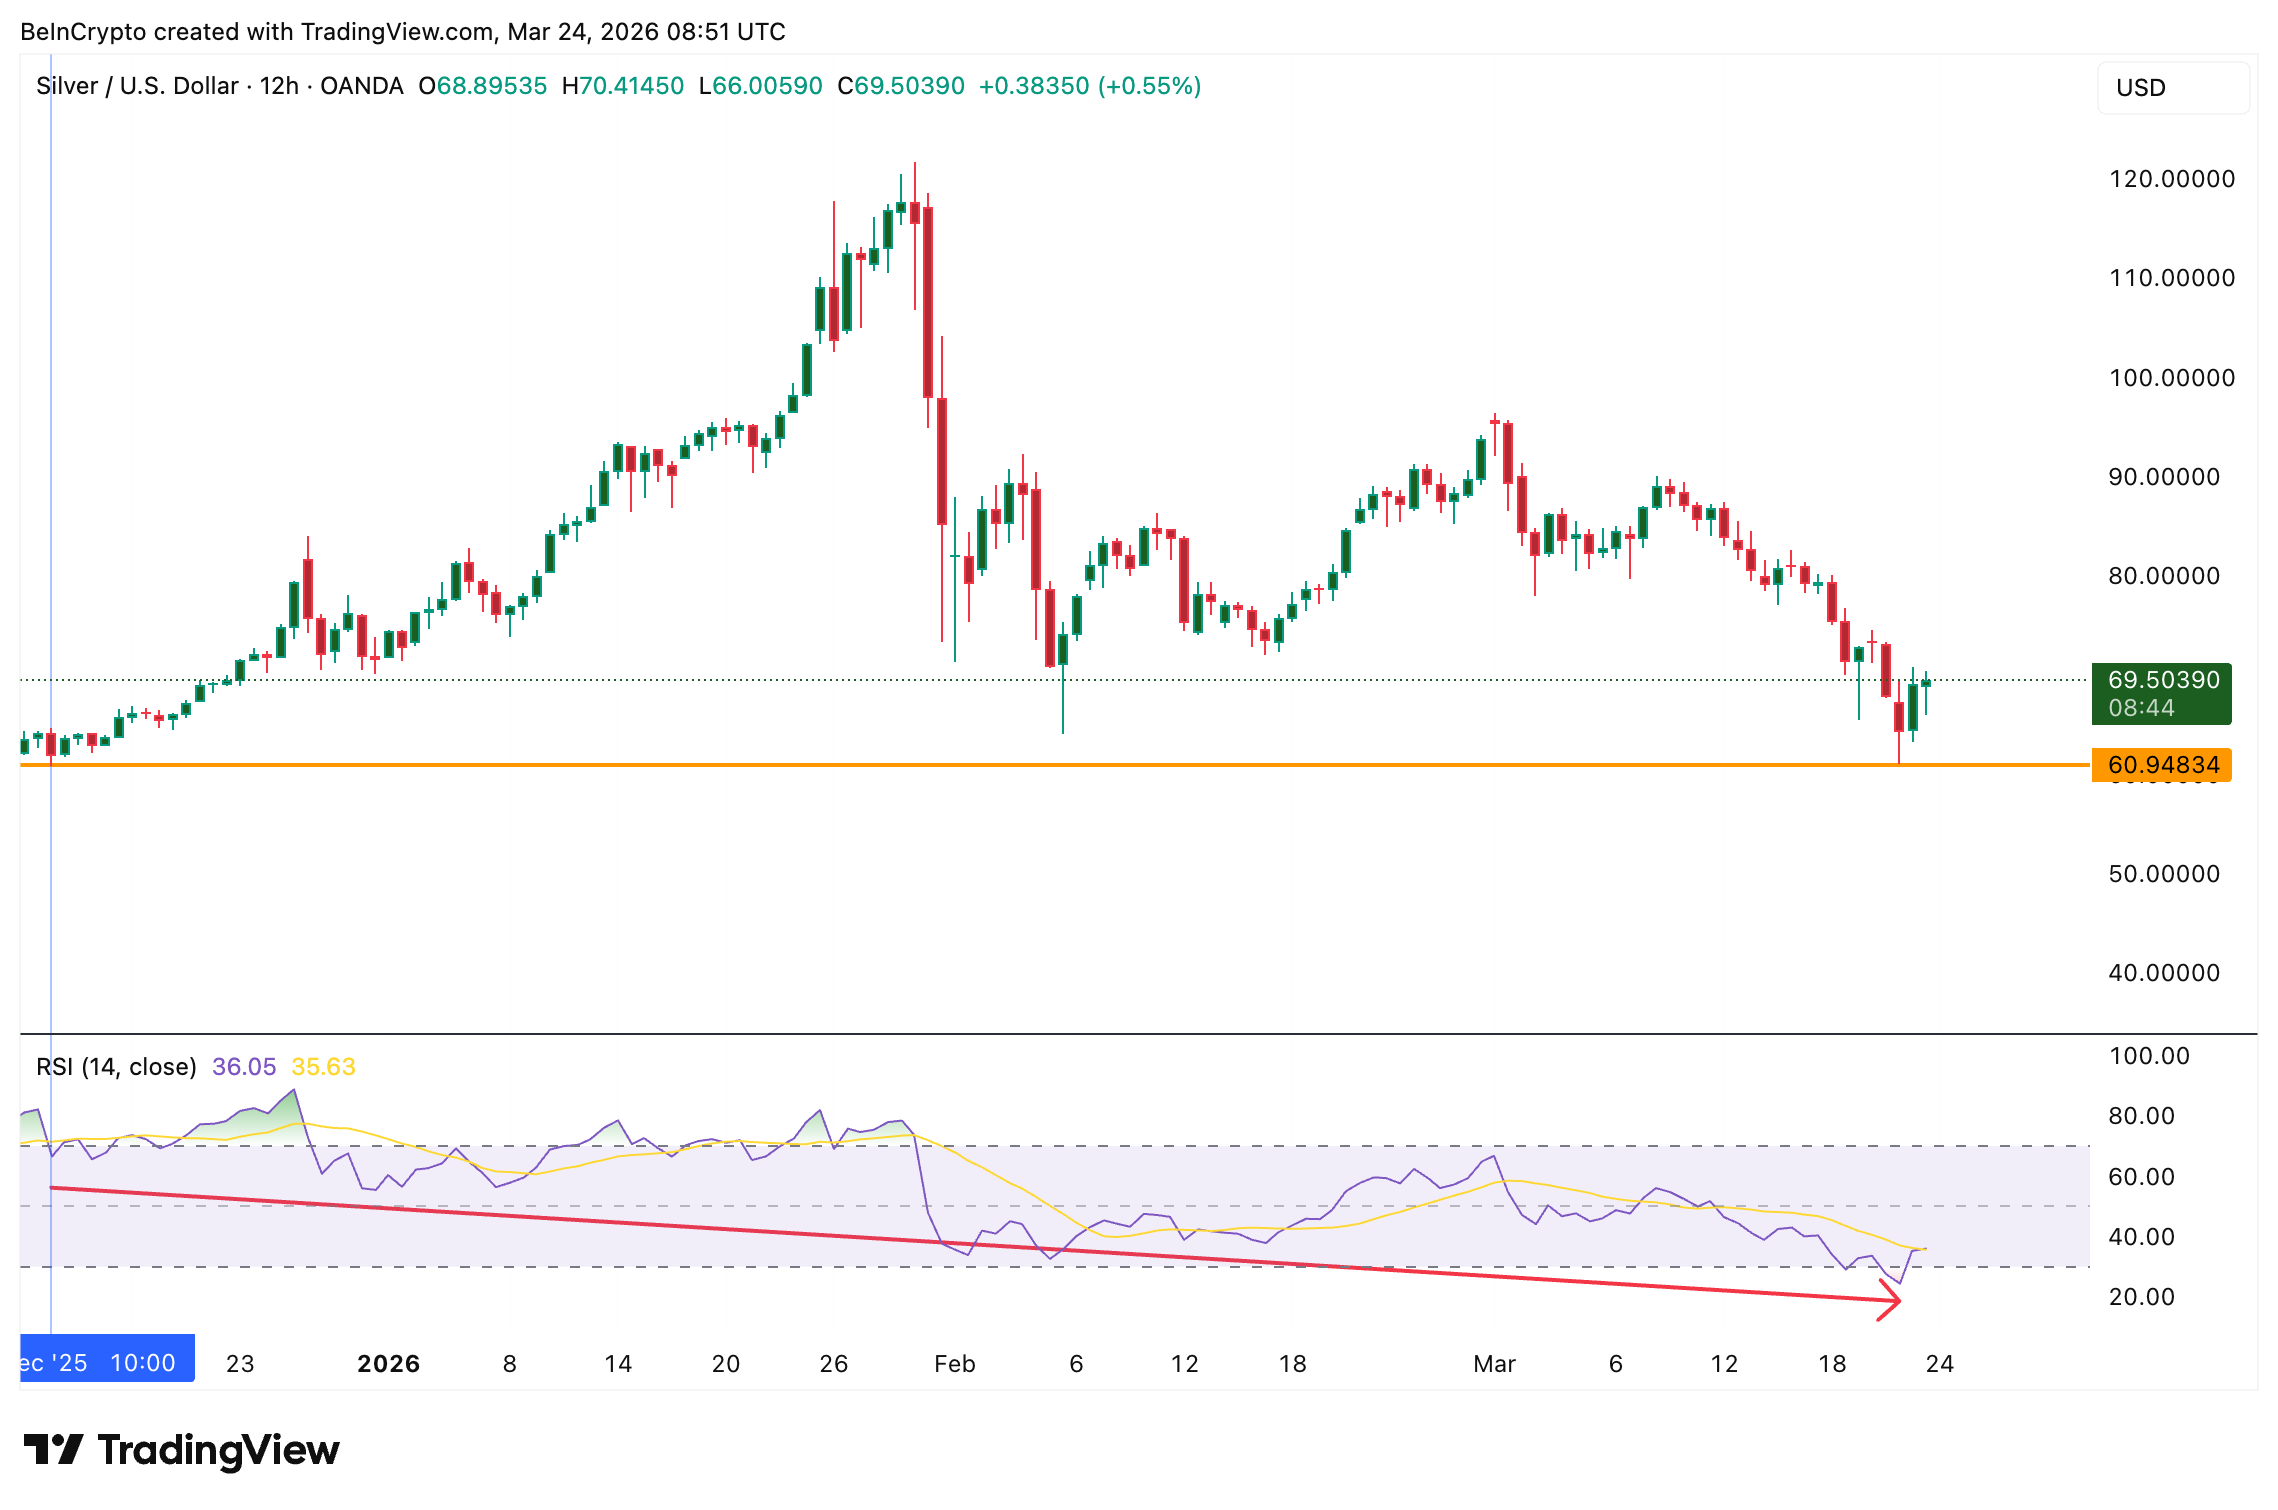 Silver RSI Hidden Bullish Divergence: TradingView
Second, the $60 low aligns almost perfectly with the 0.618 Fibonacci extension. The trend-based Fibonacci drawn from the January 29 peak through the February 5 bottom and the March 1 bounce places the 0.618 extension at $60. The year-to-date low landed at the same level.
The 0.618 level is widely regarded as one of the strongest structural support zones in Fibonacci analysis, and silver has responded to it almost to the cent.
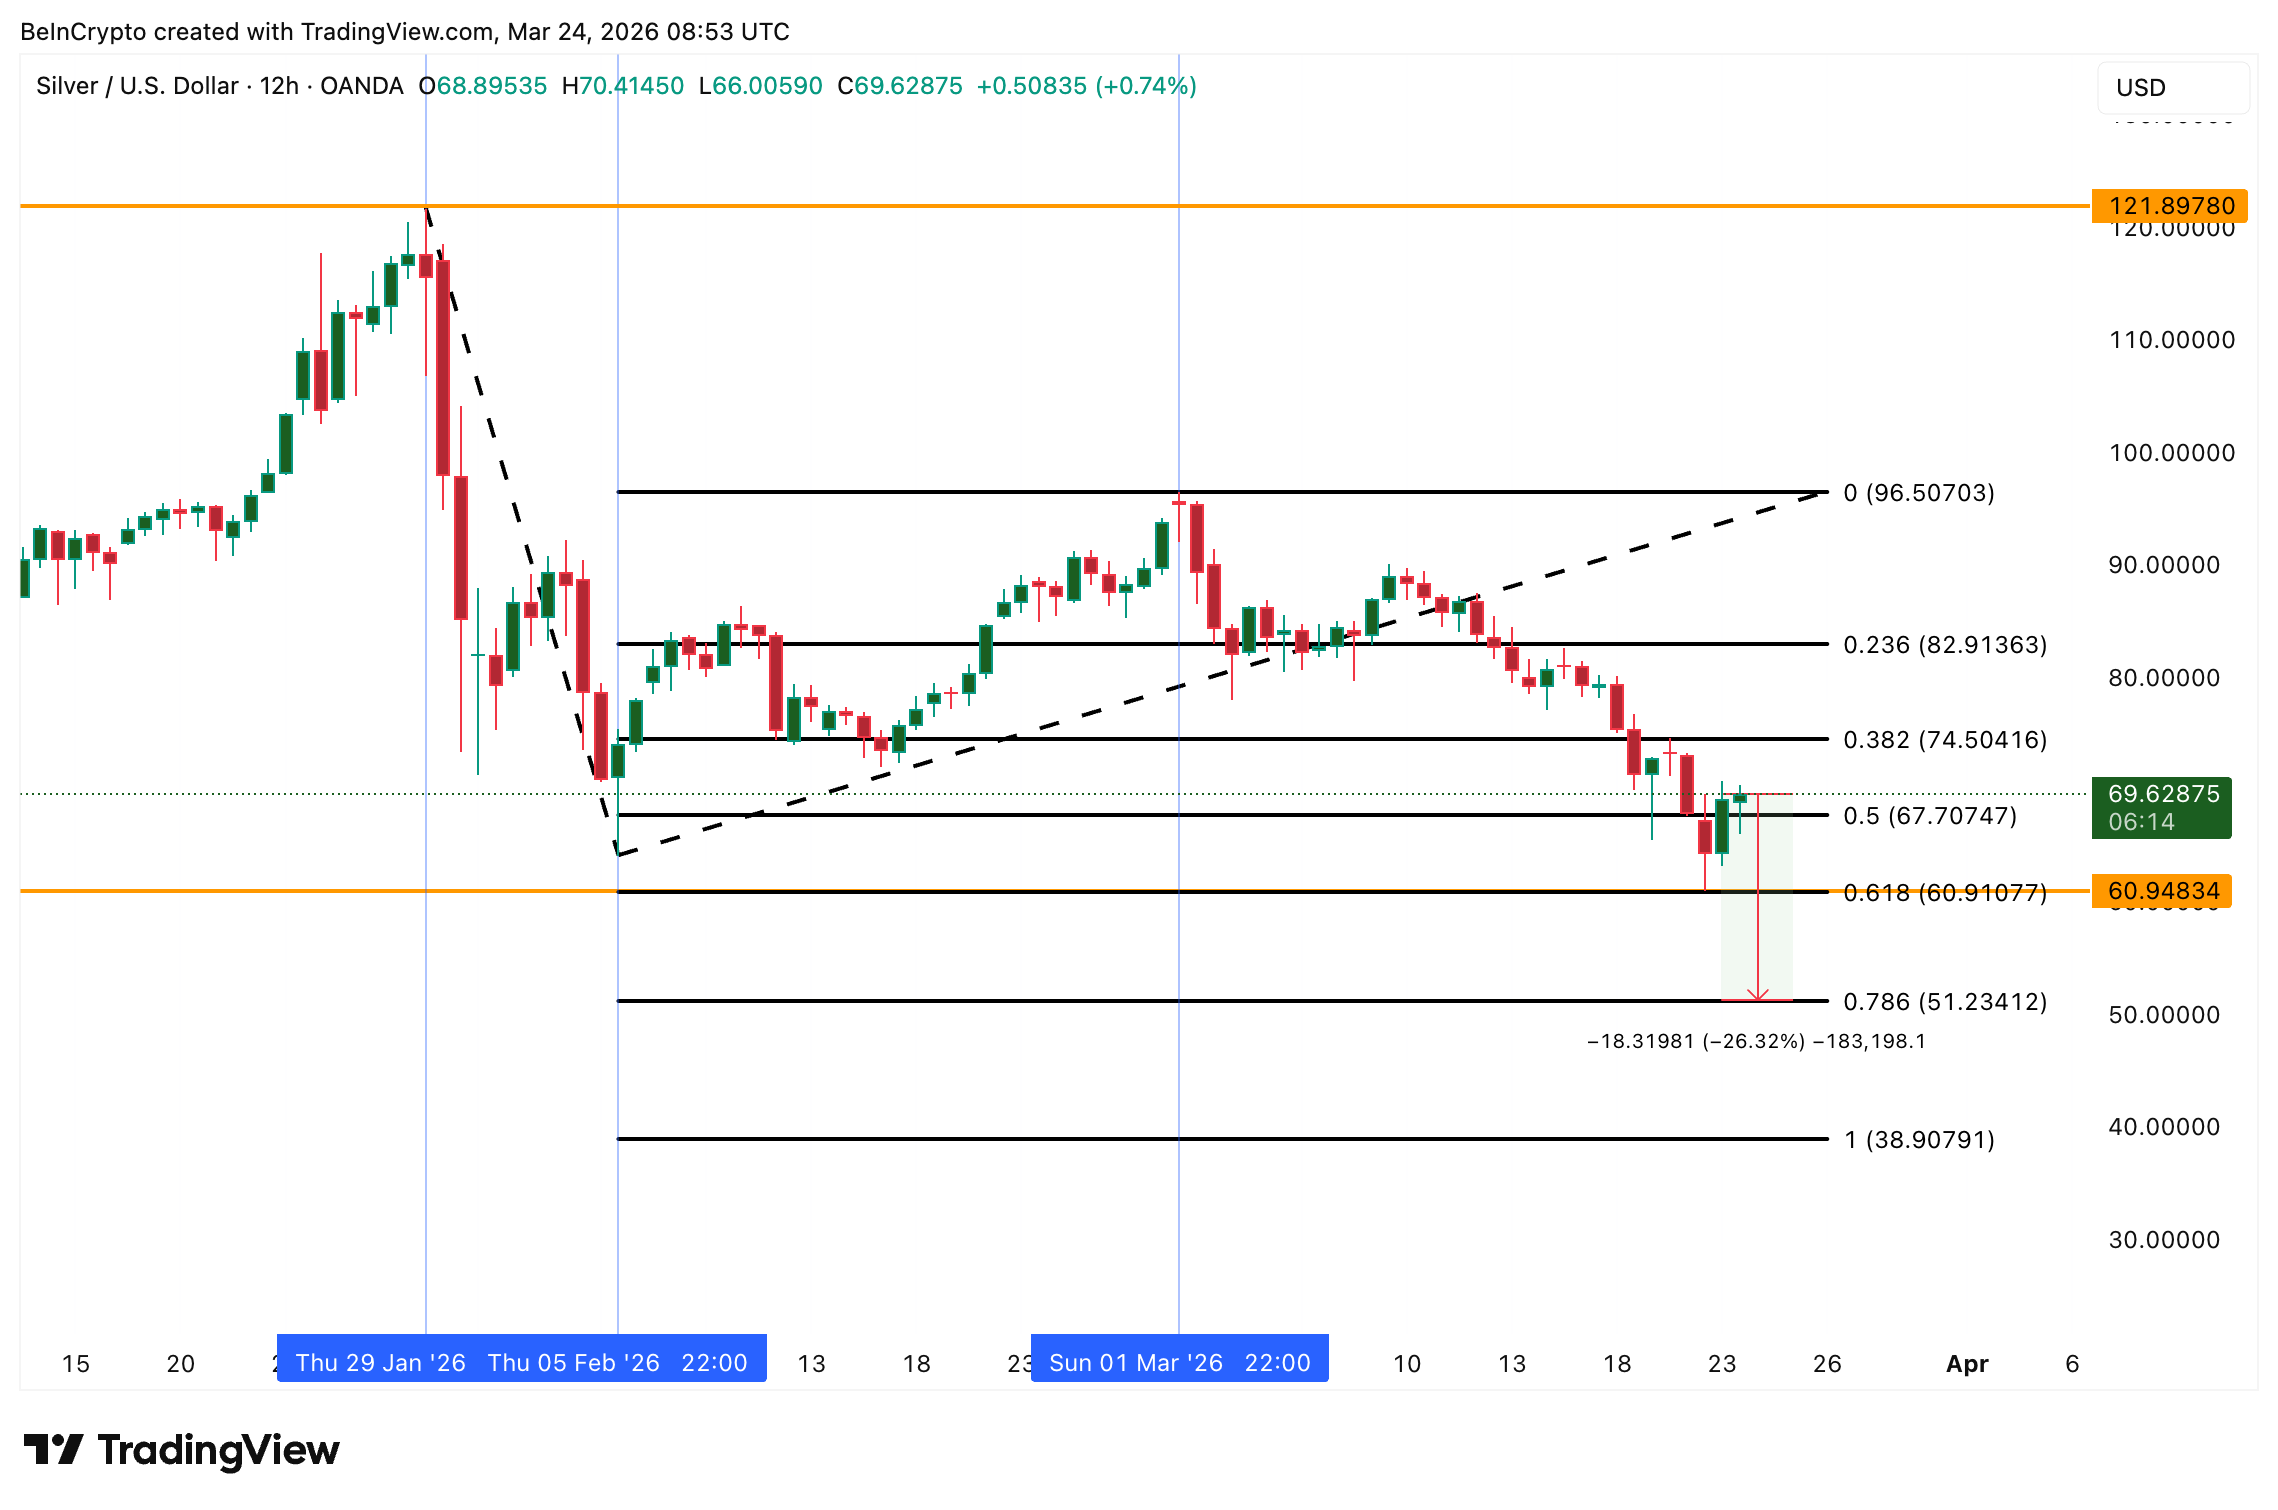 Silver Price Analysis: TradingView
If $60 holds, recovery targets sit at $74 (0.382), $82 (0.236), and ultimately $96, which also corresponds to the head of the previous head-and-shoulders. If $60 breaks on a 12-hour close, the next support falls to $51, which could be a 26% dip.
For now, silver’s 2026 local bottom hinges on whether the 0.618 Fibonacci floor holds, the next COT report shows managed money longs returning, and the DXY breaks below 98.48.
All three need to align for the bottom to be confirmed.
Recommended Articles


