


Pi Coin (PI) Price Builds a 22% Breakout Case, but One Metric Says Not Yet
Pi Network (PI) price trades near $0.188, down roughly 3% today but still holding an 11.6% gain on the month. Two patterns are forming simultaneously on the 8-hour chart that could define the next move.
A hidden bullish divergence on the RSI suggests selling pressure is fading, while a cup-and-handle formation points to a potential 22% rally. However, BeInCrypto’s proprietary Pi Isolation and Shock Index (PISI) reads near zero, indicating the breakout may not arrive immediately. The Pi Coin price sits at a crossroads between pattern confirmation and continued consolidation.
Hidden Divergence and a Cup-and-Handle Build Together
The 8-hour chart on OKX shows a hidden bullish divergence forming between February 19 and March 23. During that period, the PI price carved a higher low on the candles while the Relative Strength Index (RSI), a momentum indicator, formed a lower low. Hidden bullish divergence typically suggests that selling pressure is weakening within an existing structure, supporting continuation rather than reversal.
Want more token insights like this? Sign up for Editor Harsh Notariya’s Daily Crypto Newsletter here.
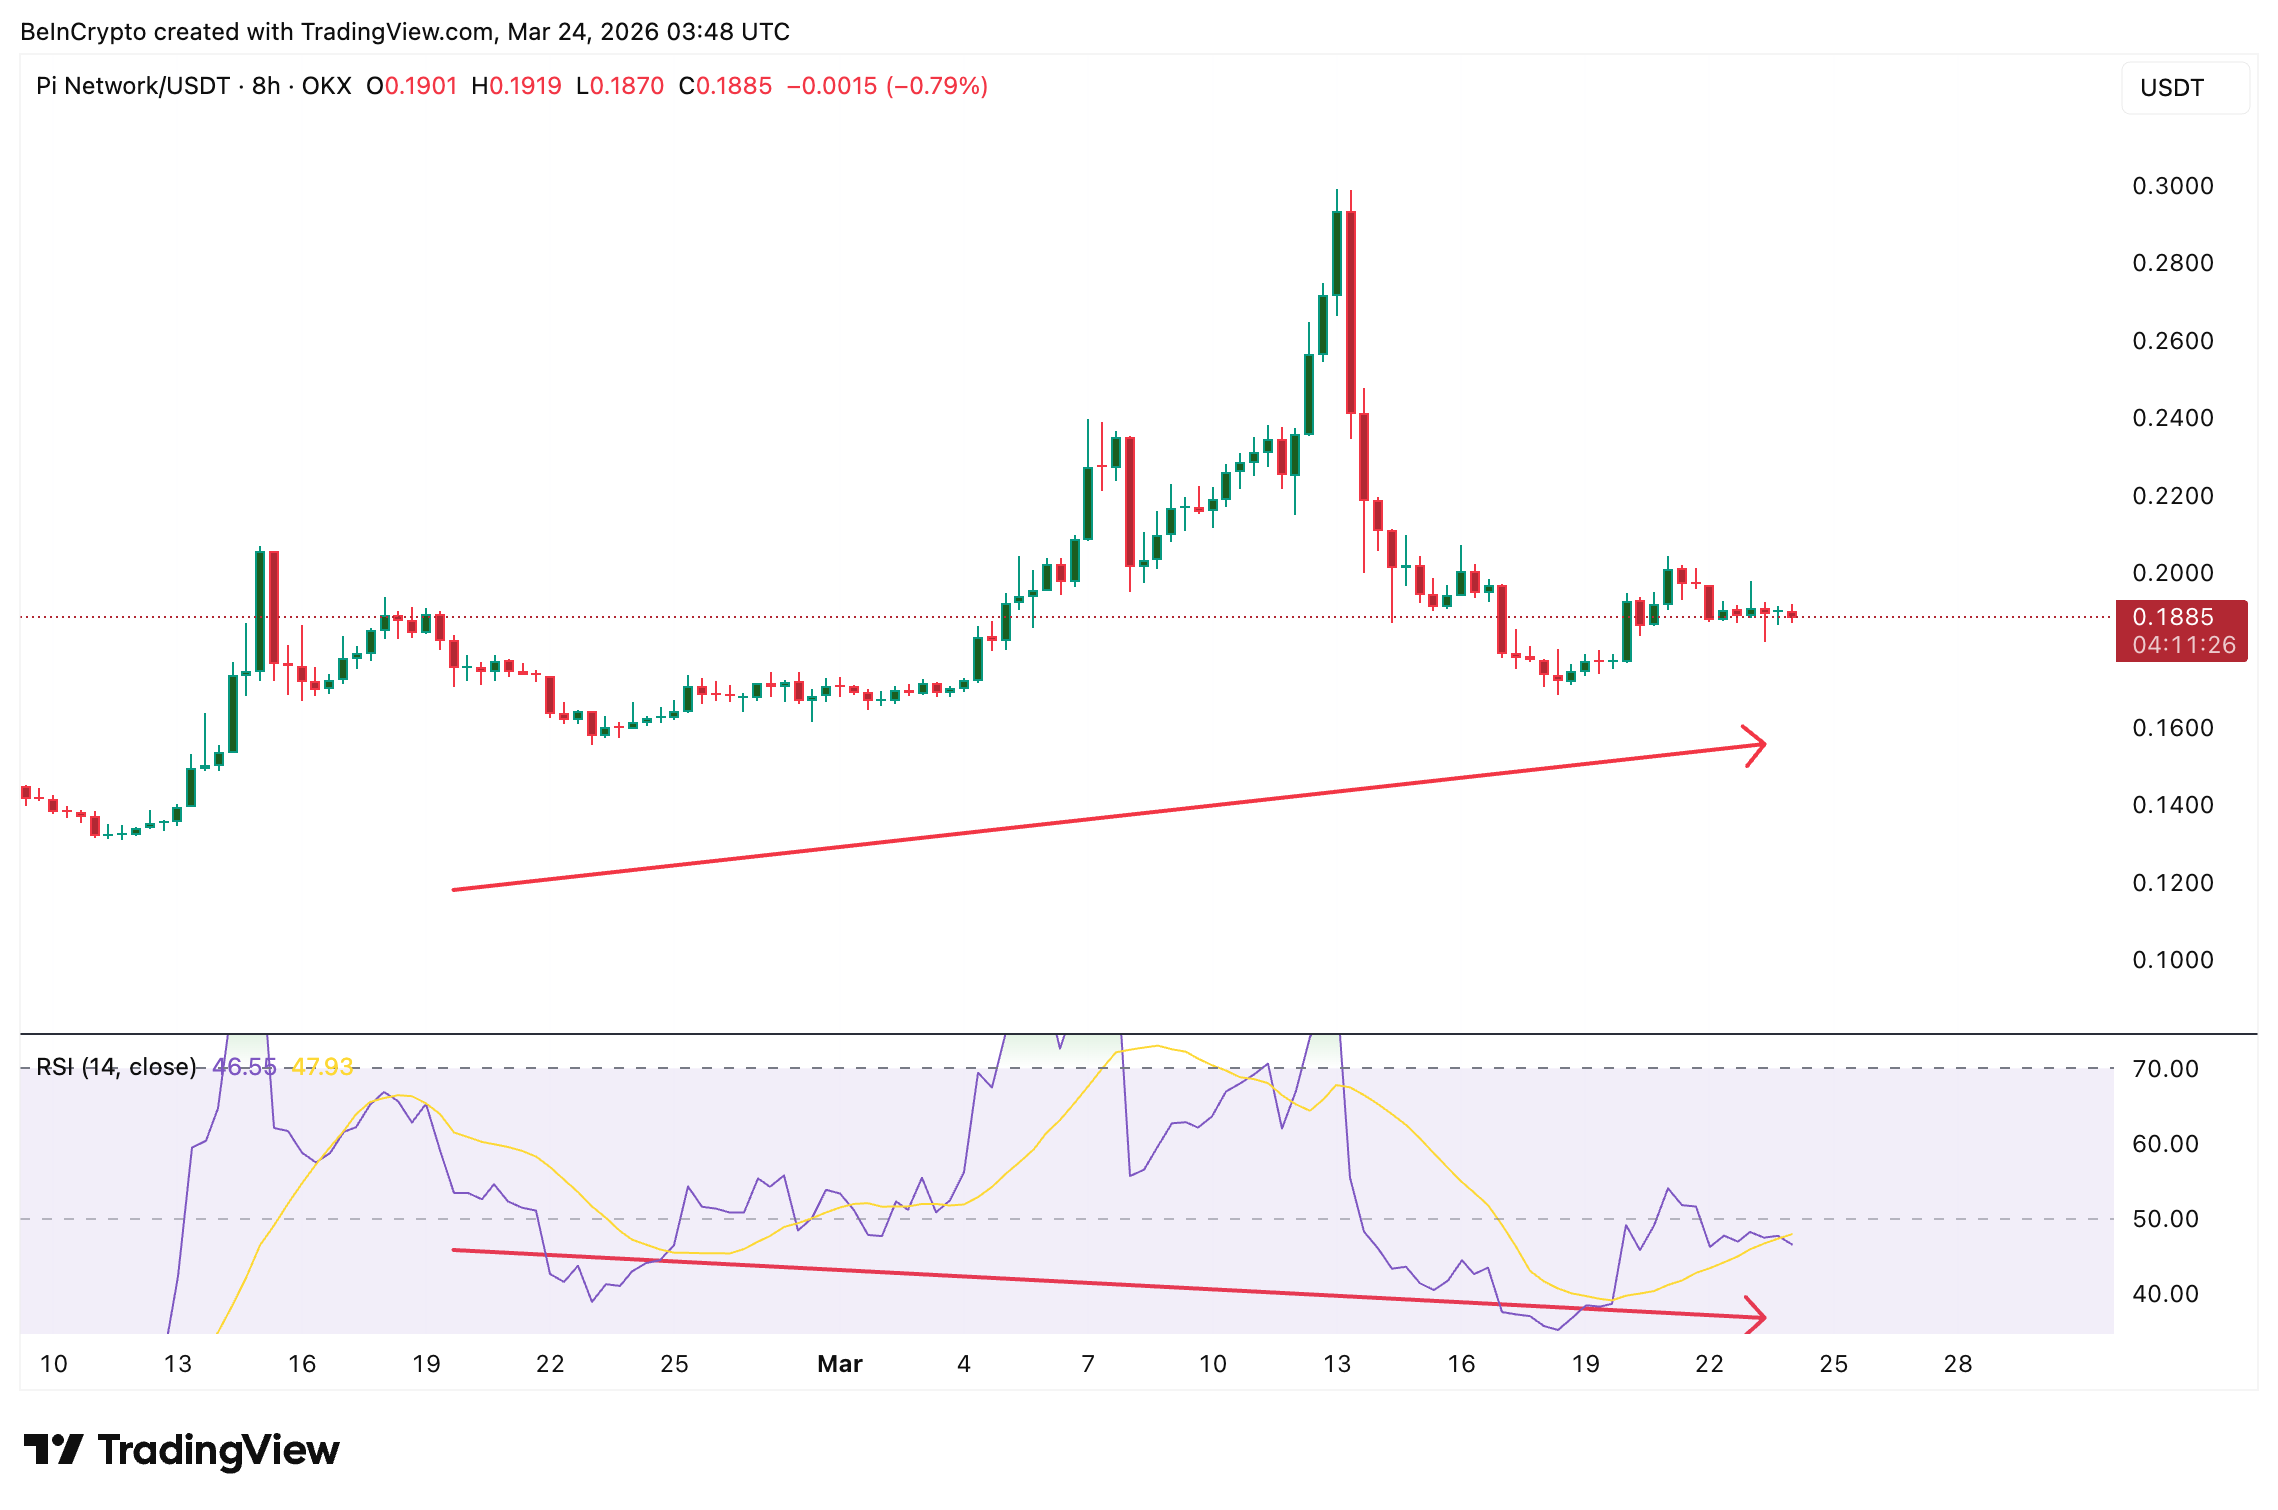 PI RSI Hidden Bullish Divergence: TradingView
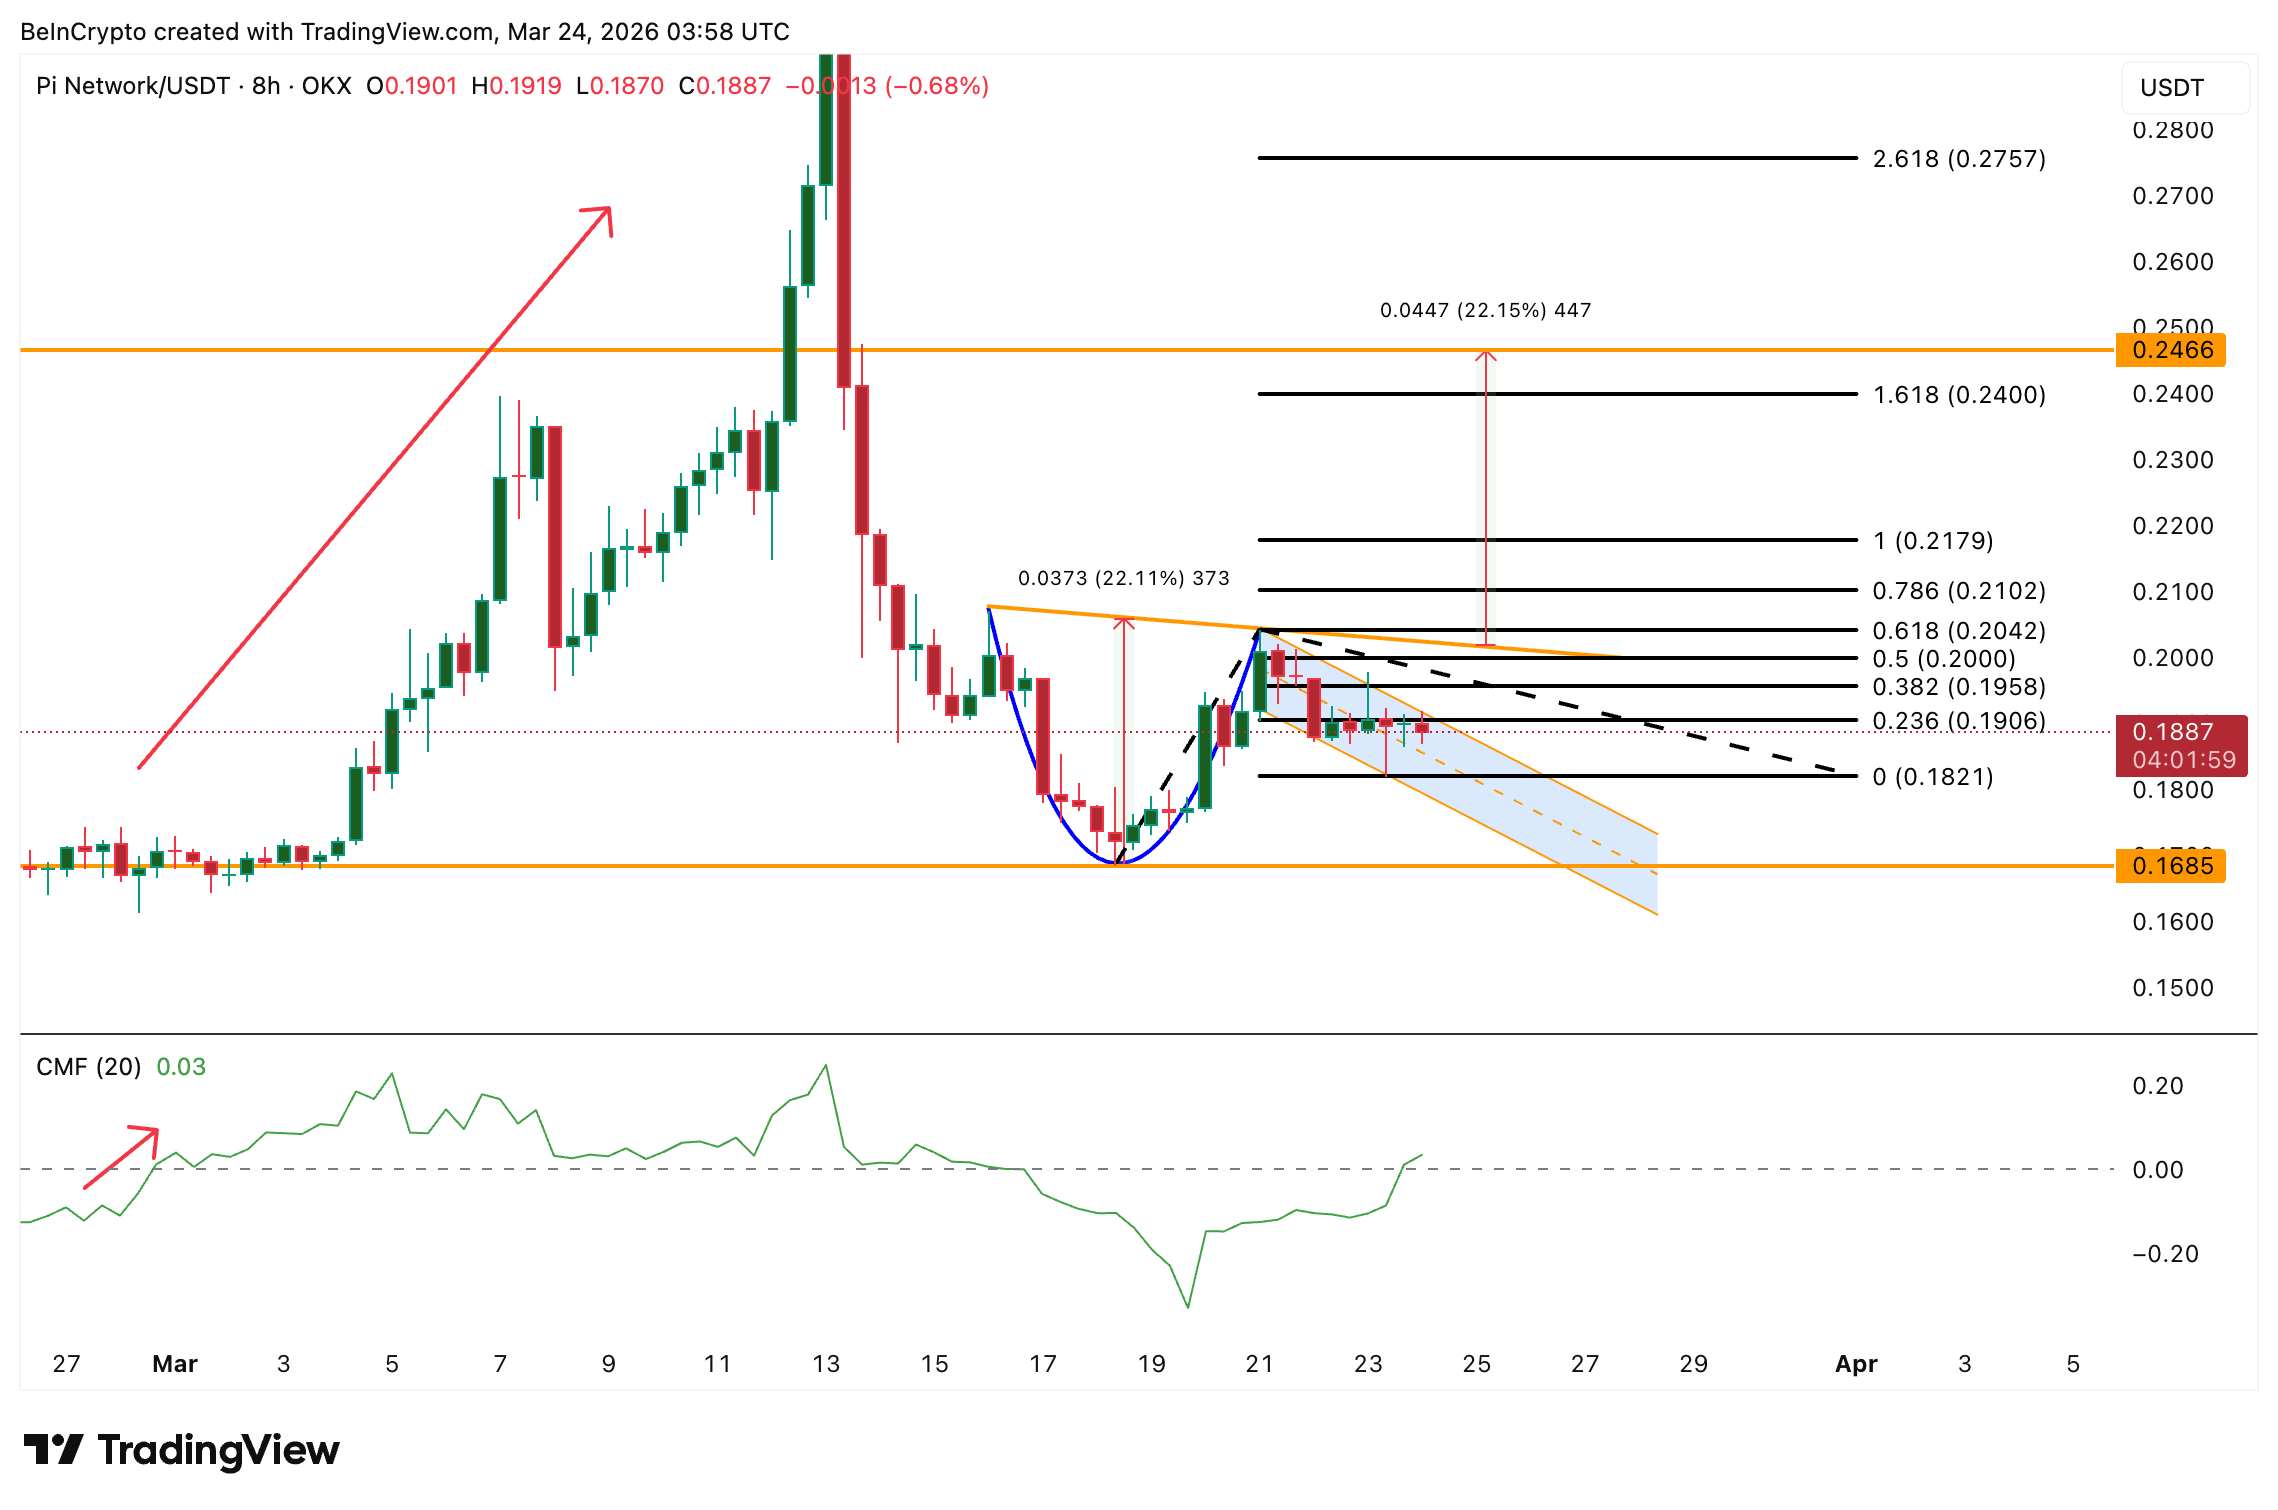
Complementing the RSI setup, a cup-and-handle pattern has been taking shape since mid-March. The cup’s rounded bottom formed between roughly March 15 and March 19, and the current price action is consolidating inside the handle. If the handle breaks upward and Pi Coin price clears the neckline, the measured move targets a 22% rally.
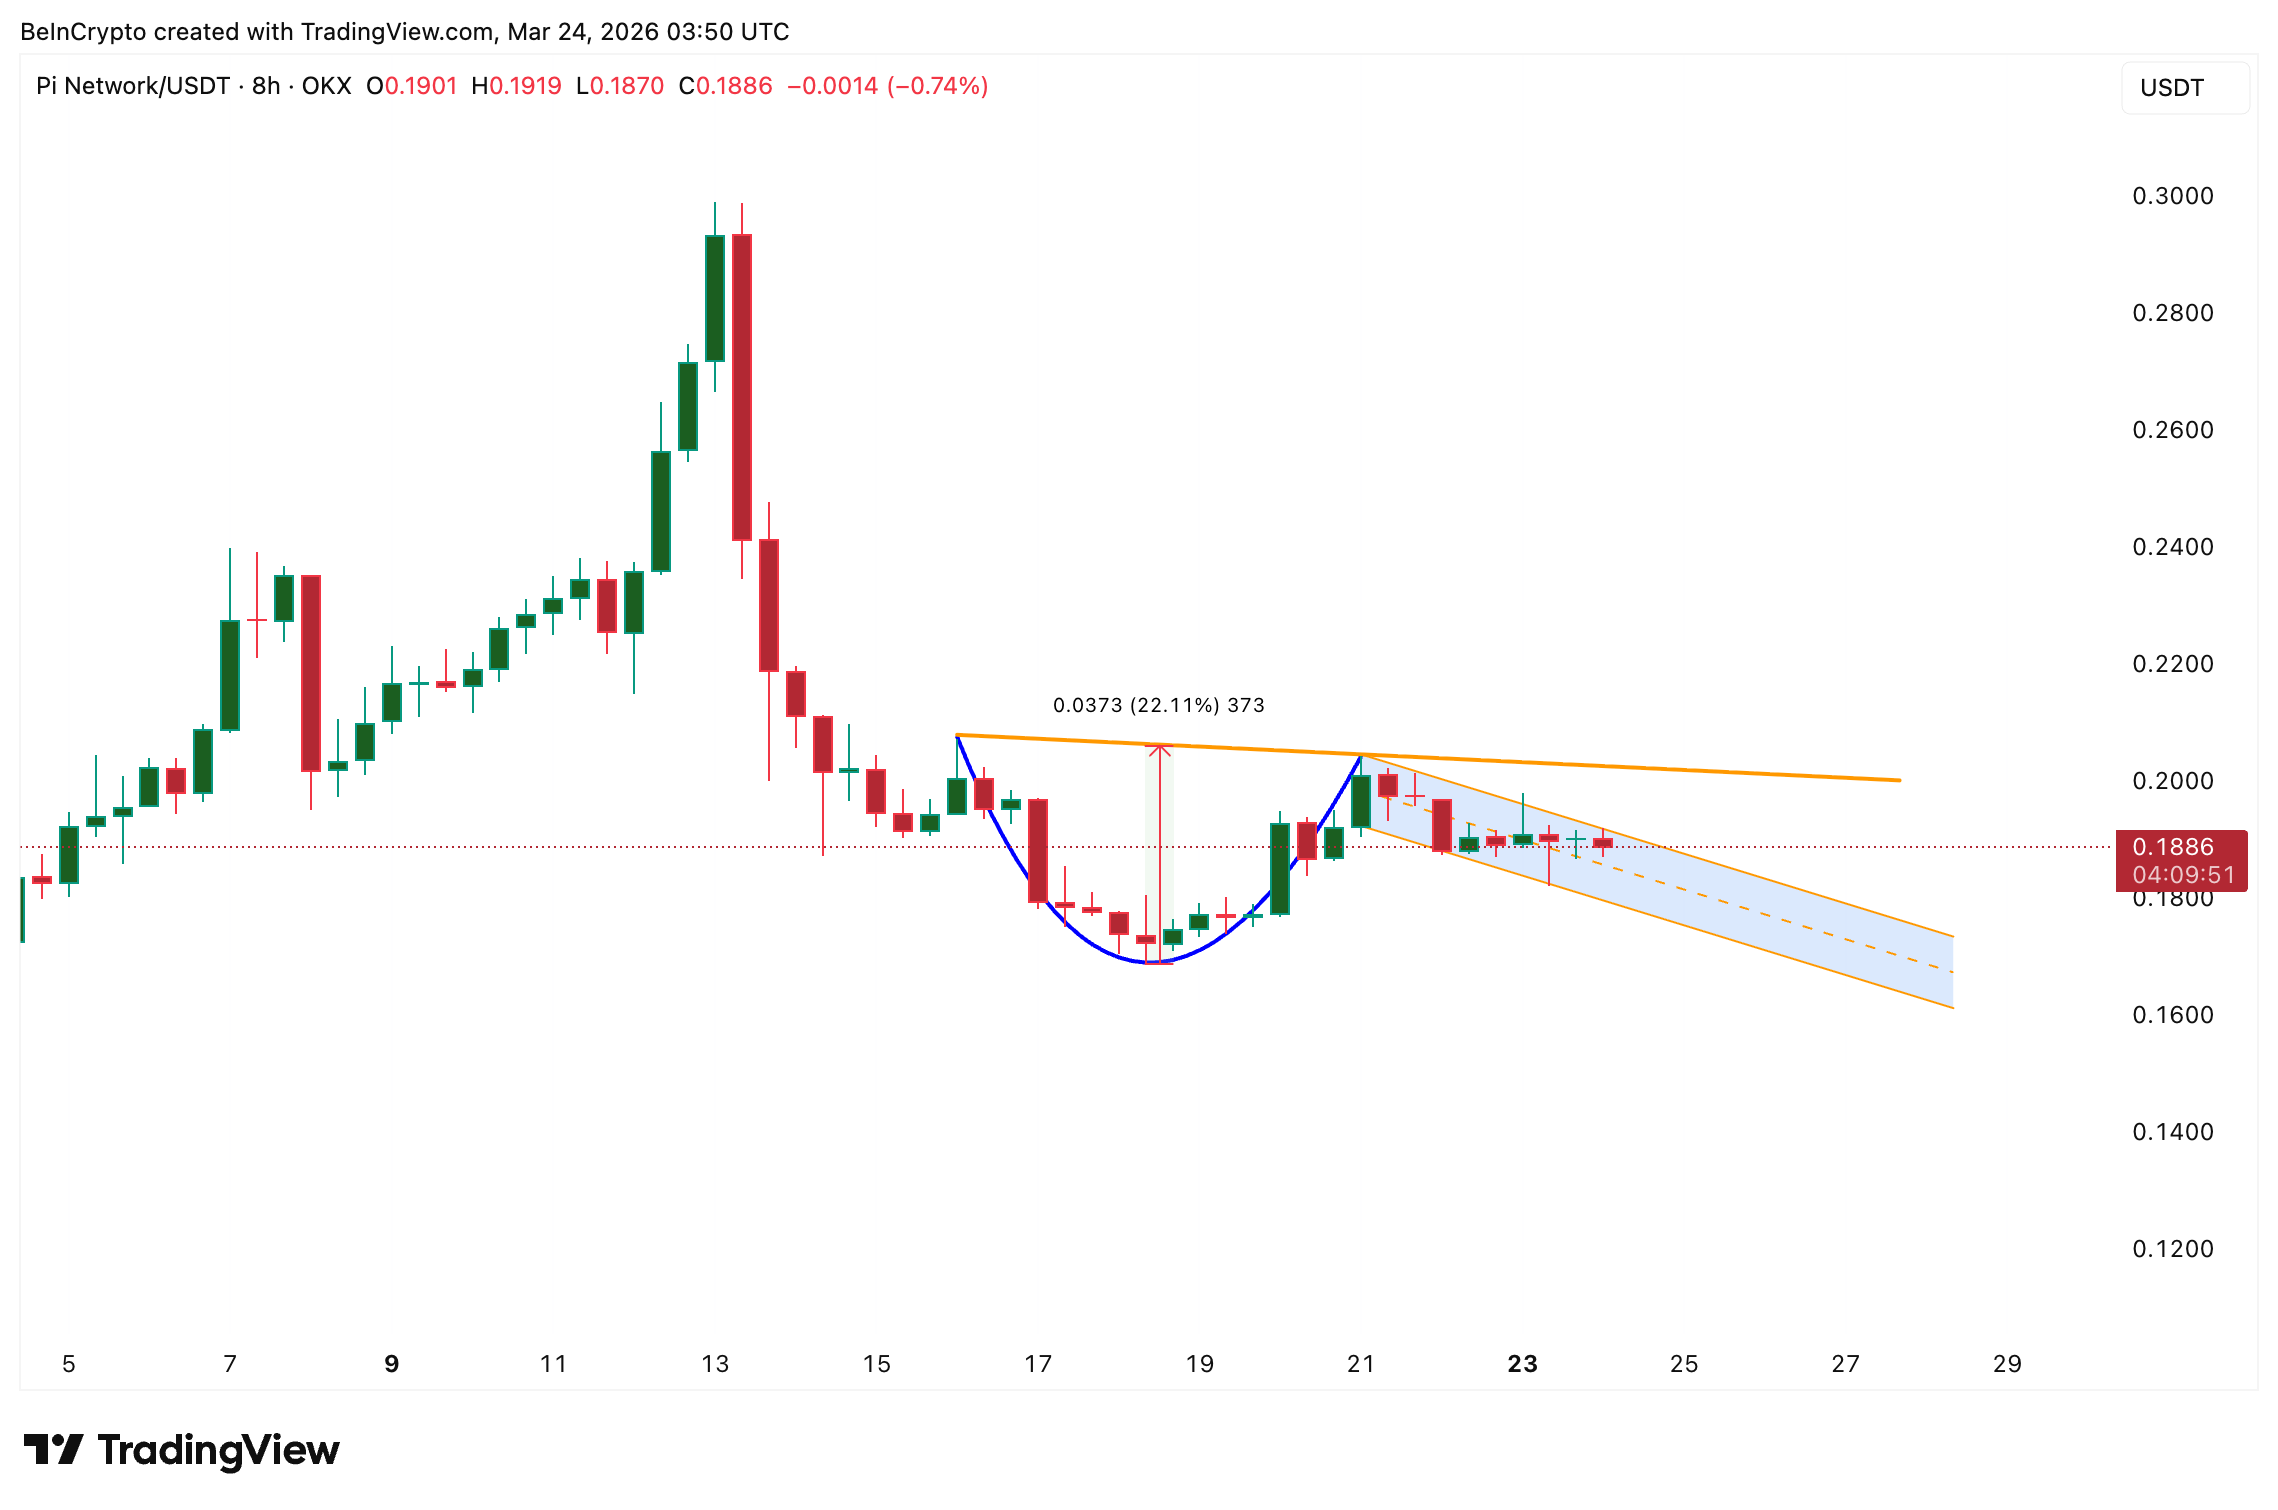 Pi Coin’s Cup-and-Handle Pattern: TradingView
Both patterns lean bullish, but the timing of any breakout depends on how the Pi Network token behaves relative to the broader market. That is where the proprietary index comes in.
A Proprietary Index Says Wait, but Big Money Is Flowing In
BeInCrypto’s Pi Isolation and Shock Index (PISI), a custom Z-score indicator that measures how strongly Pi moves independently of the broader altcoin market (TOTAL3), currently reads -0.03. That places it almost exactly at the zero line, indicating normal behavior with no strong independent momentum in either direction.
The PISI has a proven track record on this token. On March 12, when the index surged from 1.02 to a peak of 2.59 in the green zone, Pi’s price subsequently rallied roughly 40%. Conversely, on March 13, when the PISI plunged to -5.50 in the extreme zone, Pi corrected approximately 43%. The current flat reading suggests the consolidation inside the handle could persist before any decisive move.
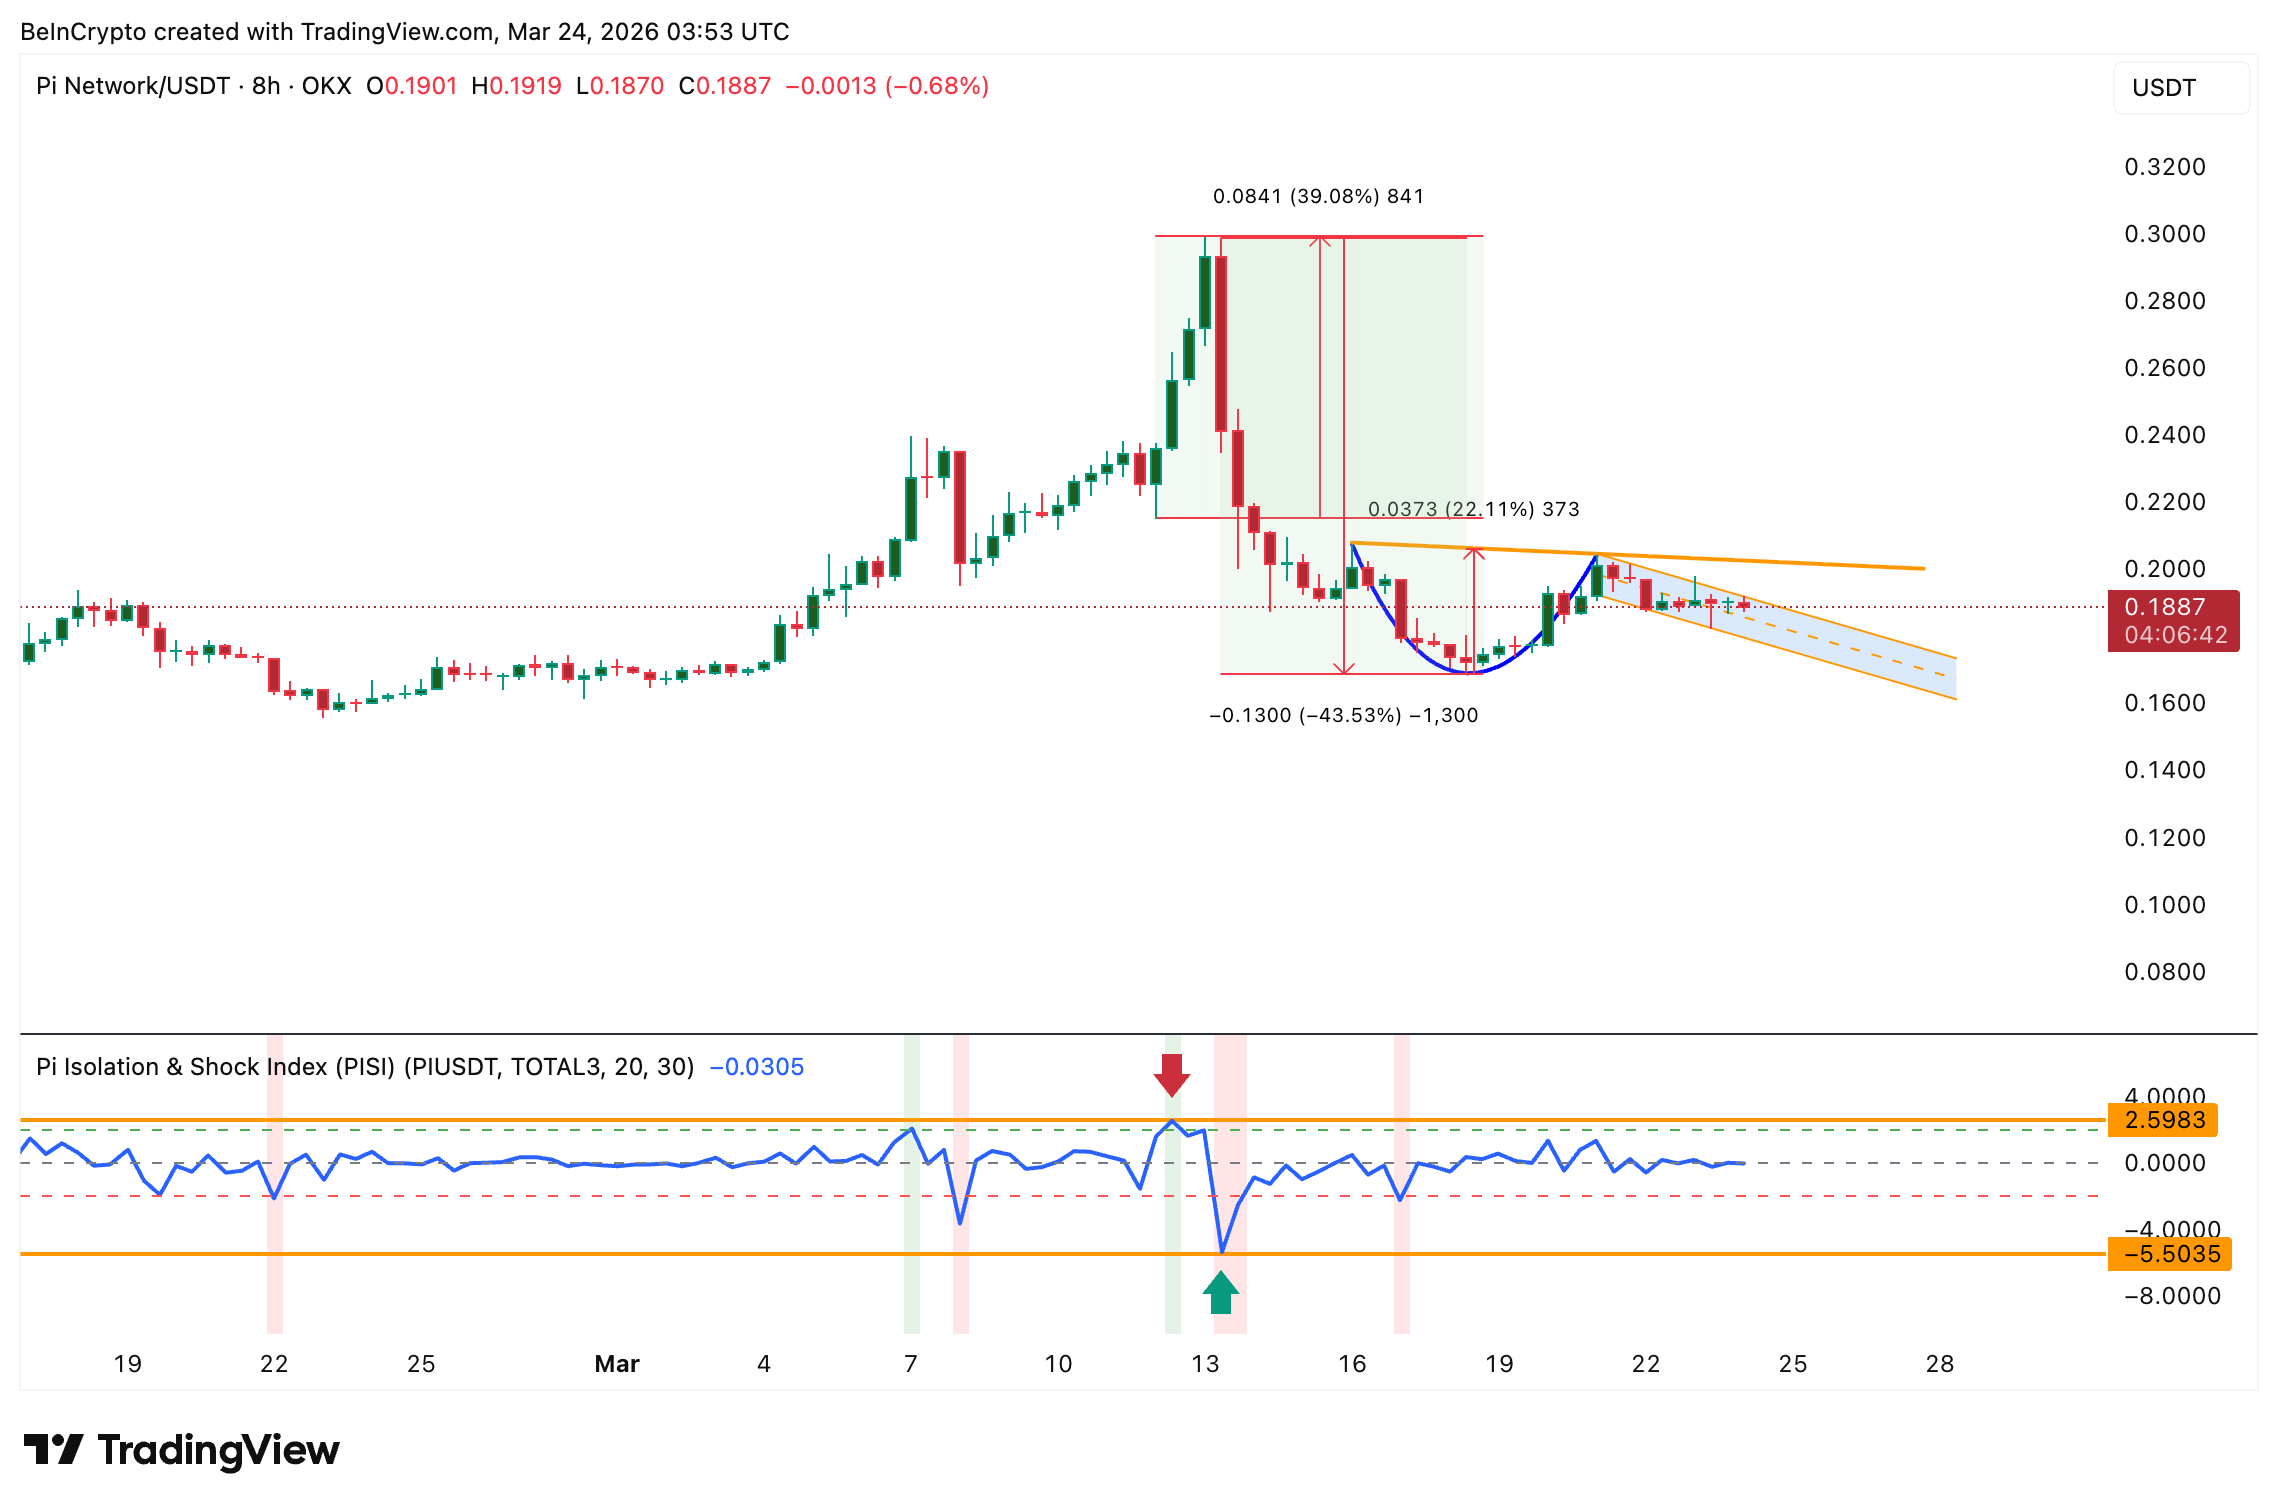 PI Isolation and Shock Index: TradingView
One reason for the muted PISI is Pi’s low correlation with Bitcoin. The one-month correlation matrix shows a reading of just 0.11 between BTC and PI. Pi Network is moving largely independently of Bitcoin, which means it is not benefiting from any Bitcoin-led momentum. Instead, Pi is tracking more closely with the altcoin market. If an altcoin rotation gains traction, Pi could get pulled along, but until then, the independence limits its upside catalyst.
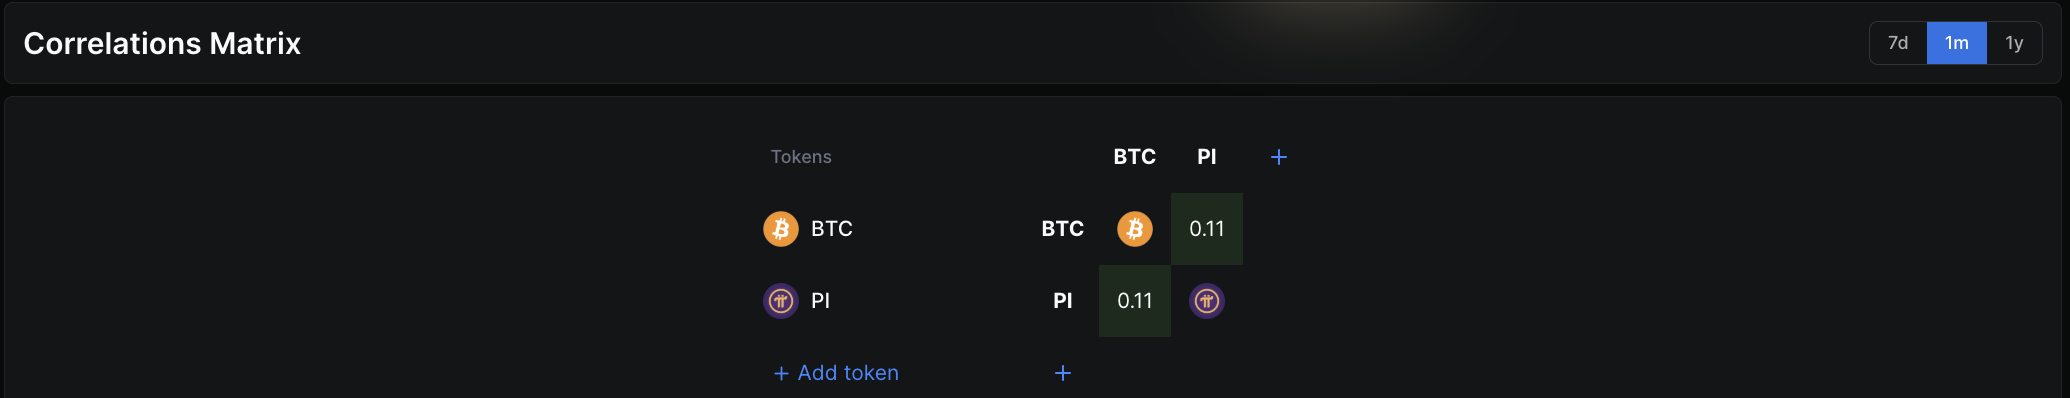 PI and BTC Correlation: DeFillama
Pi Coin’s proximity to the TOTAL3 can make it a leading tracker to gauge early altcoin rotation as well.
However, despite the muted PISI, one indicator is quietly turning bullish.
Pi Coin Price Needs $0.200 to Trigger the Setup As Big Money Flows In
The Chaikin Money Flow (CMF), a proxy for big money flows, has just crossed above zero on the 8-hour chart, reaching 0.03. The last time CMF crossed above zero was in late February, and that crossover preceded a prolonged rally for PI. A similar move now, while the cup-and-handle is forming and the RSI divergence is intact, adds weight to the bullish case. It suggests bigger participants are starting to accumulate again.
The first psychological and technical hurdle sits at $0.200, the 0.5 Fibonacci level. An 8-hour close above this zone would confirm that the handle is resolving upward. The next confirmation arrives at $0.204, the 0.618 Fib, which closely aligns with the neckline of the cup-and-handle pattern.
A break above $0.204 activates the 22% measured move, targeting $0.246. Beyond that, the 2.618 Fibonacci extension sits at $0.275.
 PI Price Analysis: TradingView
On the downside, $0.182 is the immediate floor. If the CMF slips back below zero and $0.182 breaks, the pattern weakens, and $0.168 becomes the next support. A close below $0.168 would invalidate the cup-and-handle entirely.
Currently, an 8-hour close above $0.200 is what Pi Coin price needs to turn the cup-and-handle from a developing pattern into a confirmed short-term rally.
Recommended Articles


