


Zcash Traders’ Uncertainty To Likely Be Cleared By Bitcoin Price’s Direction
Zcash (ZEC) is trading at $220, up 0.10% on the day, as the price consolidates between two Fibonacci levels following a sharp pullback from the $275 area.
The key question for ZEC traders is whether Bitcoin’s next directional move will break the current range or deepen the retreat.
ZEC-Bitcoin Correlation Recovers
The ZEC-Bitcoin correlation coefficient sits at 0.91 as of March 22. That reading is close to the February peak of near 1.0, when the two assets moved almost in lockstep.
That relationship broke down sharply between February 19 and mid-March. The coefficient dropped from near 1.0 to as low as approximately 0.05 by March 13. During that window, ZEC was trading on its own internal momentum rather than following Bitcoin.
Want more token insights like this? Sign up for Editor Harsh Notariya’s Daily Crypto Newsletter here.
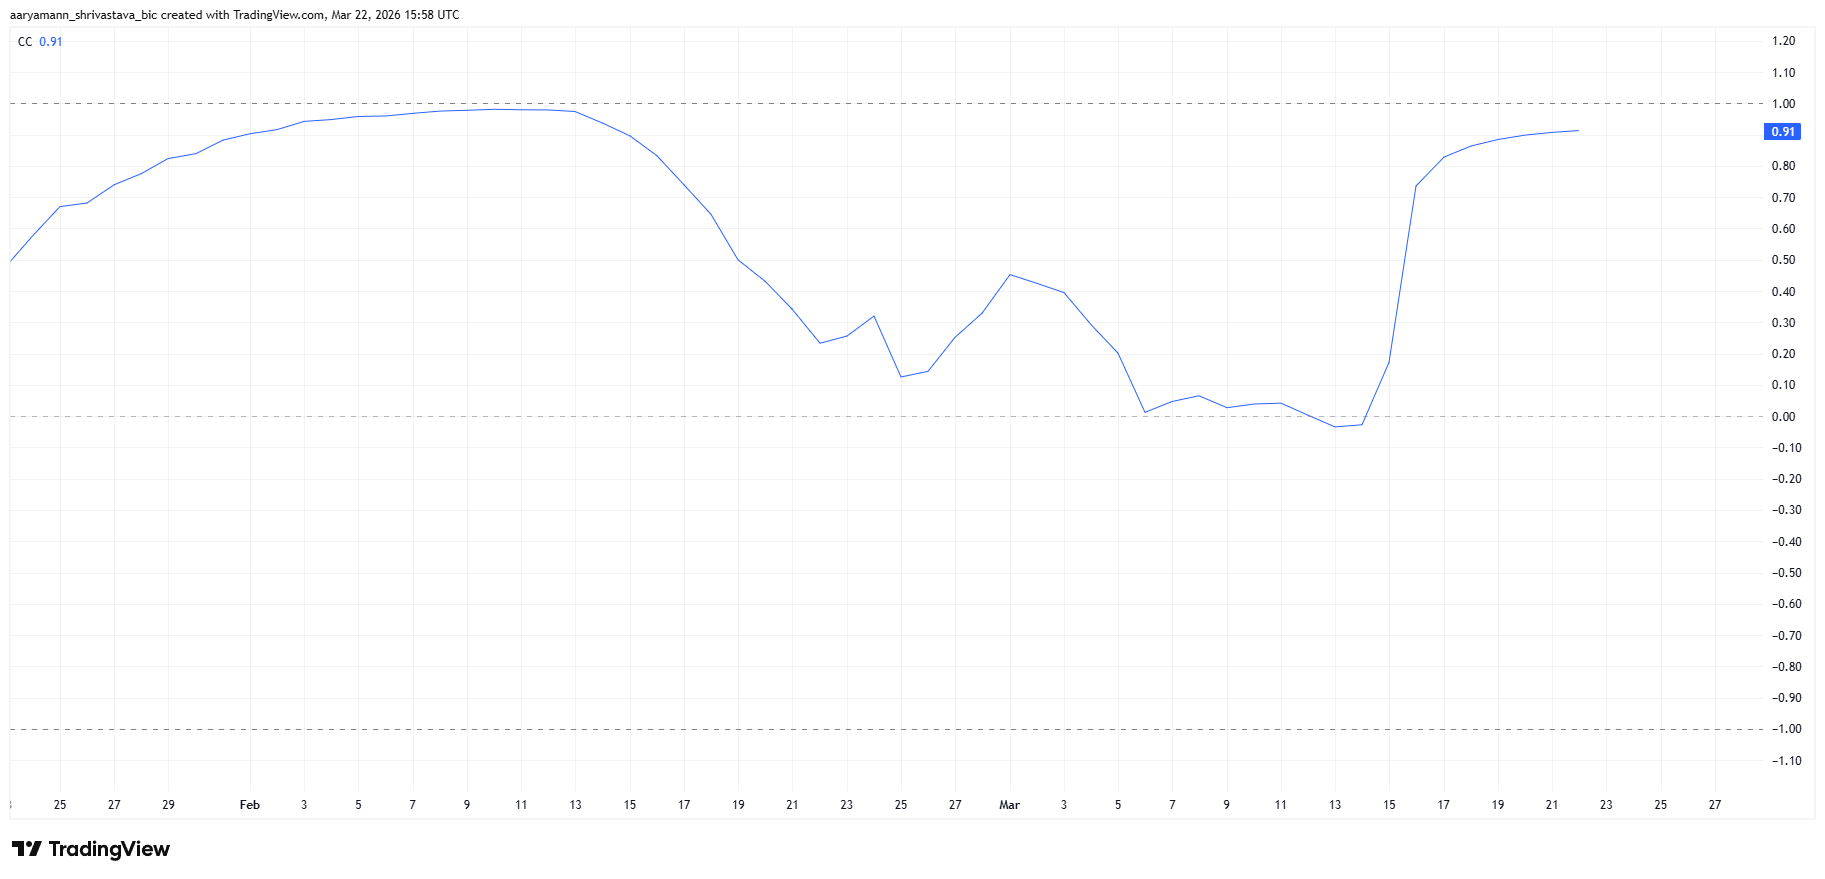 ZEC Correlation To Bitcoin. Source: TradingView
The swift recovery back to 0.91 signals that the decoupling is over. ZEC is now highly sensitive to Bitcoin’s price moves again. A Bitcoin rally of meaningful size would likely pull ZEC higher. A Bitcoin decline would amplify ZEC’s downside.
All ZEC Trades Face Equal Liquidation
The Binance ZEC/USDT liquidation map reveals a significant cluster of leveraged short positions stacked between $241 and $260. The cumulative short liquidation leverage reaches $12 million at $242 and grows to $15.39 million by $260.
The $241–$260 zone is also where yellow 50x leveraged short bars are most concentrated. A swift price move through $242 would begin triggering these positions in a cascade, adding buying pressure on top of any organic momentum.
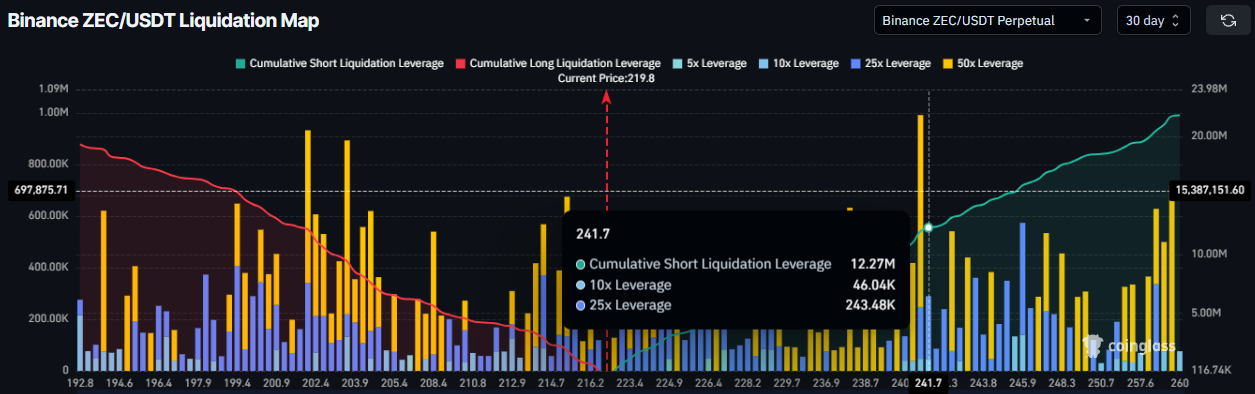 Zcash Liquidation Map. Source: Coinglass
However, the long liquidation picture below the current ZEC price is also dense. Heavy red bars sit below $220, meaning a drop through that level would accelerate selling just as quickly.
ZEC Price Recovery On The Cards
The daily chart shows ZEC trading just below the 0.382 Fibonacci retracement level at $222. That level has capped recovery attempts and now acts as the immediate resistance.
Zcash price is caught in a tight range between $208 (the 0.236 level) and $222. A daily close above $222 would open the path toward the 0.618 level at $245, a roughly 11% gain from the current price.
The 0.618 level also aligns with the start of the short liquidation cluster identified on the liquidation map. A move to $245 could therefore trigger a further squeeze toward $262, the 0.786 level.
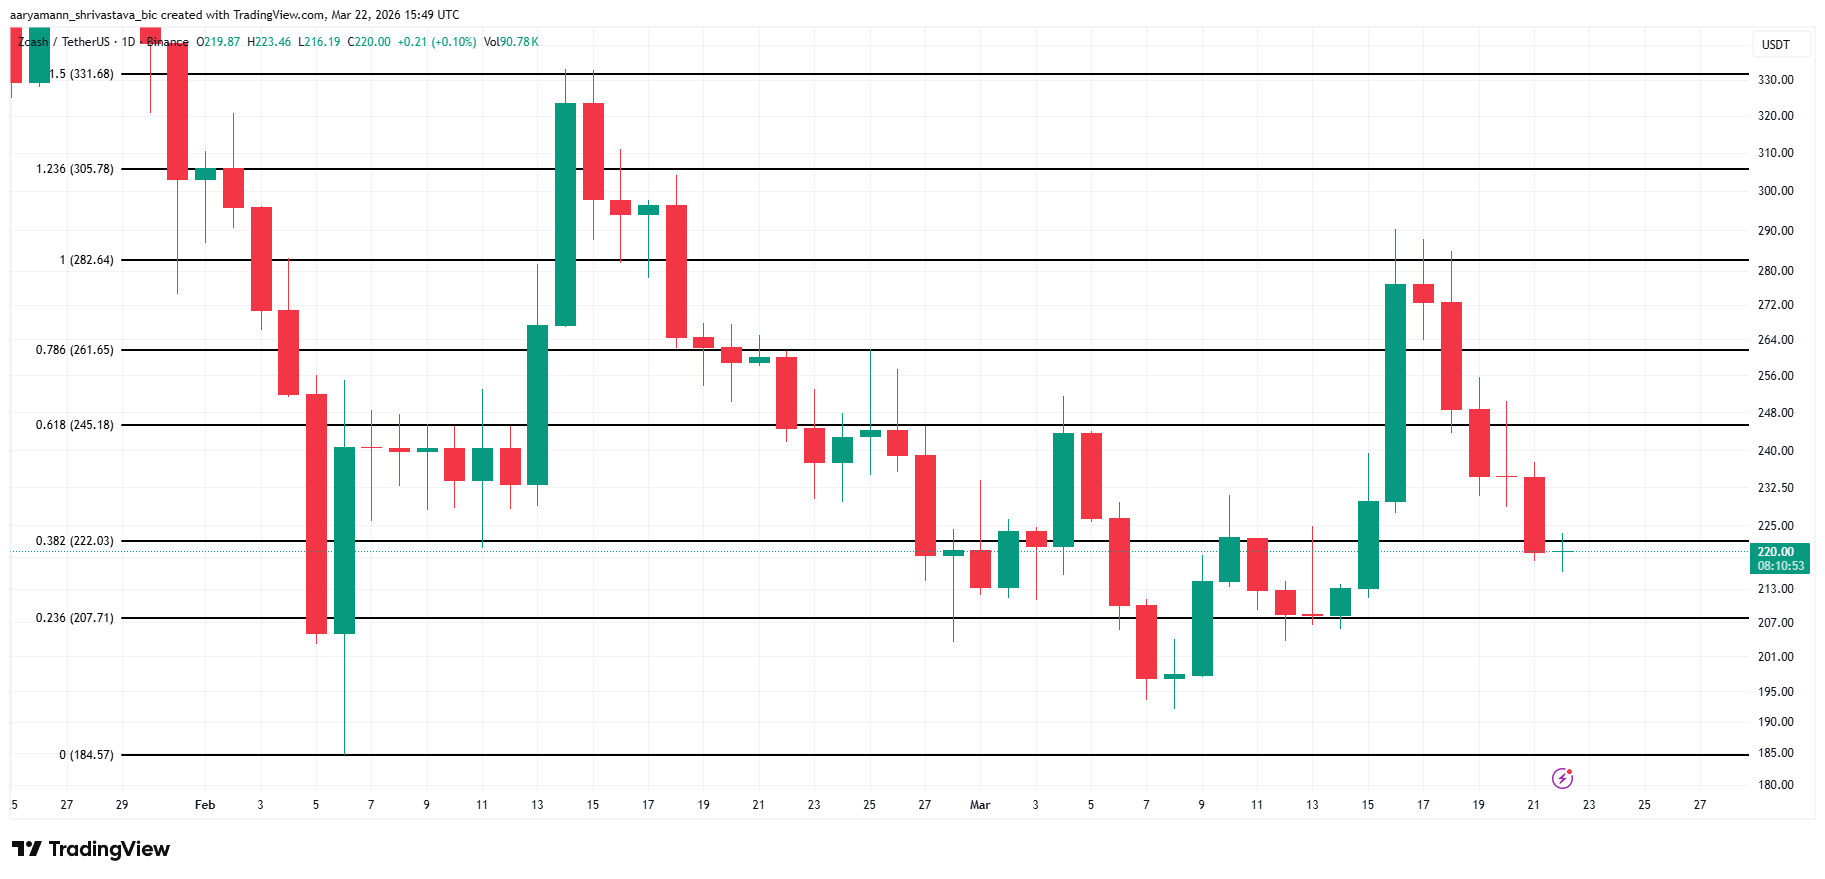 ZEC Price Analysis. Source: TradingView
On the downside, a break below $208 exposes the range low near $196–200 from early March. Given the 0.91 Bitcoin correlation, a Bitcoin drop below key support would likely be what pushes ZEC into that lower zone.
ZEC raised $25 million in seed funding in March 2026. That development adds a fundamental backdrop, but near-term price direction will likely come from Bitcoin first.
Recommended Articles


