


Pi Network Price Forecast: Recent uptrend into question as profit-taking resumes
- Pi Network posts mild gains on Tuesday after a 3% rise the previous day.
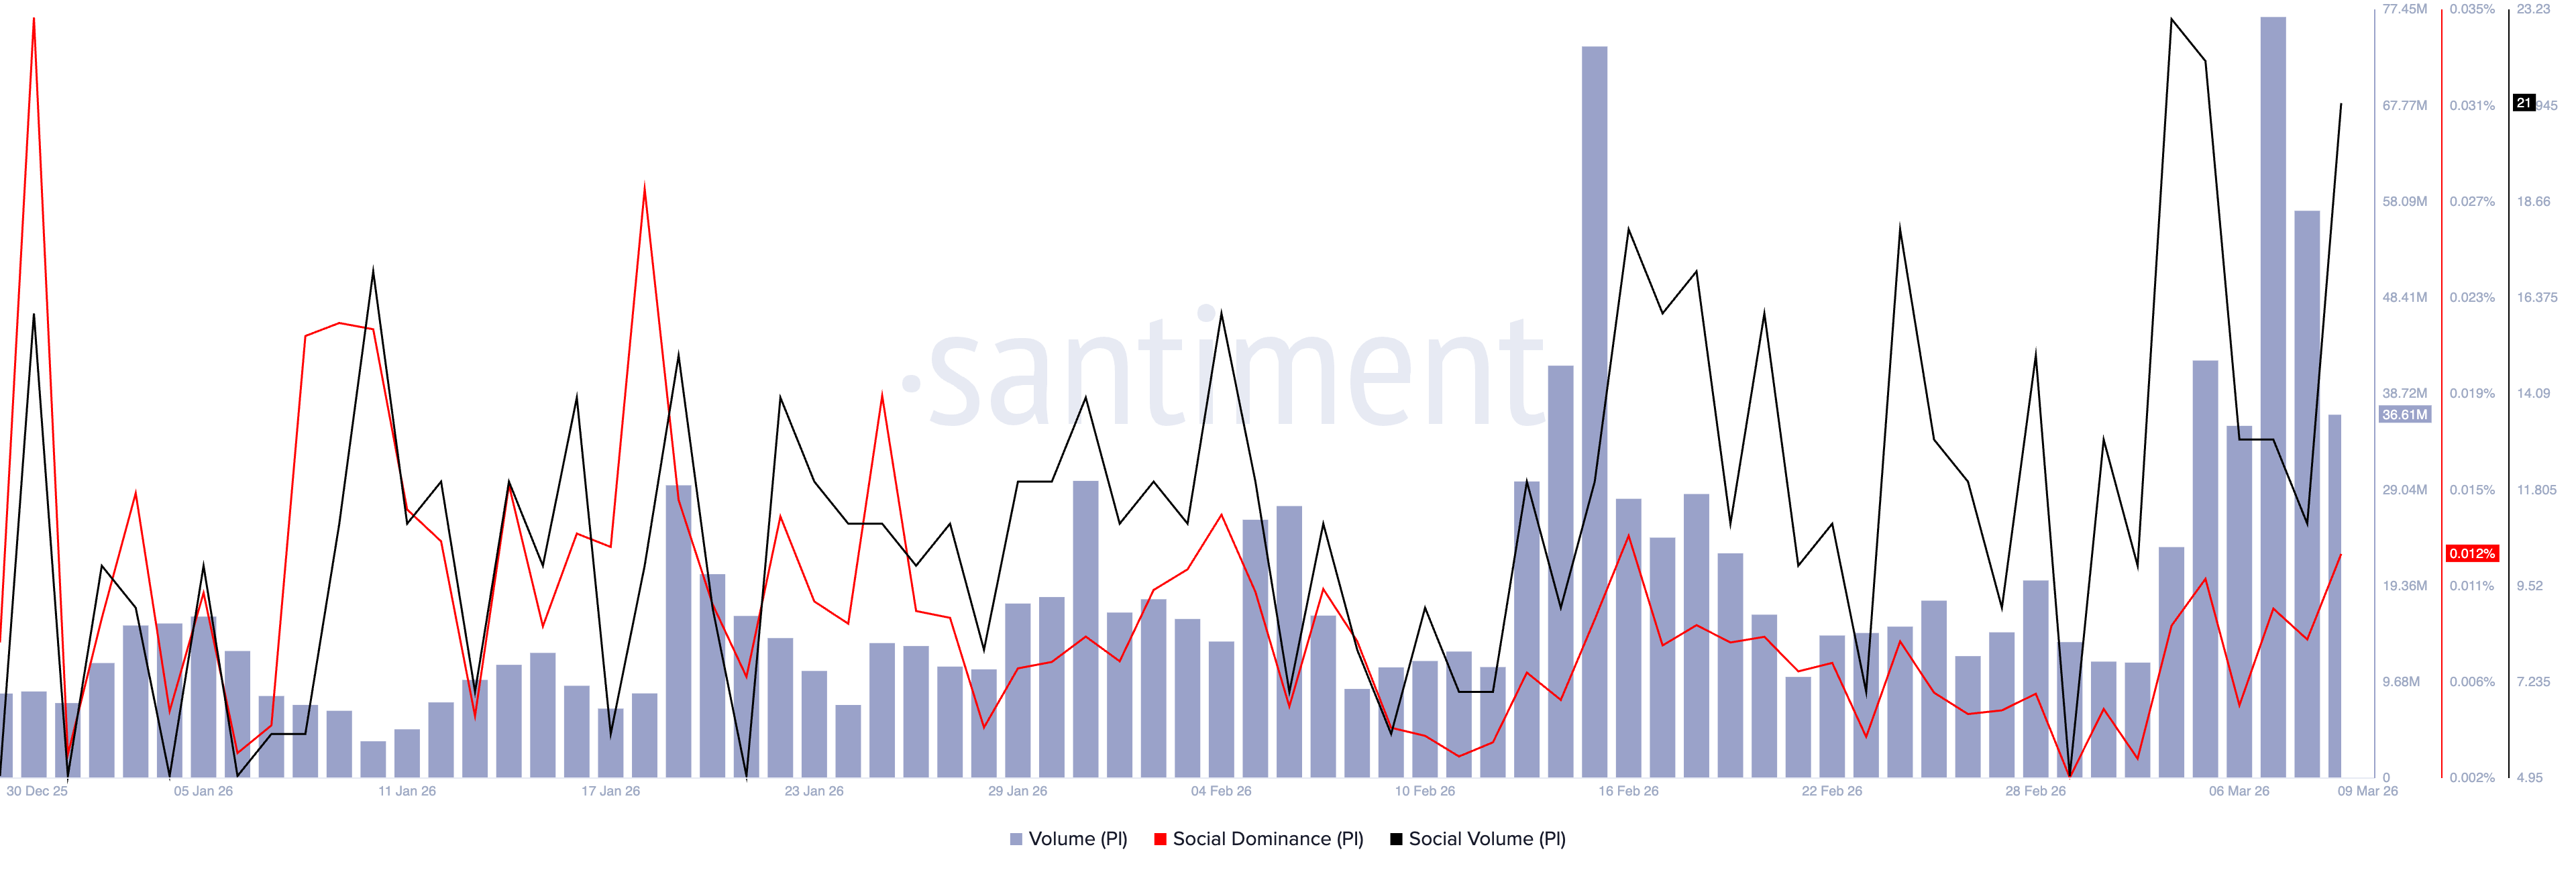
- Data show elevated trading volume and a recovery in social dominance, supporting the PI rally.
- Consistent large deposits over the last 24 hours suggest increasing chances of profit-taking.
Pi Network (PI) is up 2% at press time on Tuesday, extending Monday’s 3% gains. Data shows a surge in social buzz around the Pi Network, aligning with more than 25% gains so far in March. However, the large deposits on the exchanges increase the risk of profit-taking among investors.
The technical outlook for PI remains cautiously bullish, as the recovery lacks momentum following Sunday’s 10% pullback.
Large deposits on CEXs are weighing down PI recovery
The social buzz around Pi Network correlates directly with its spot price. Santiment data shows social volume rising to 21 on Monday, indicating a surge in PI mentions in social documents.
Compared to the social volume of the top 100 cryptocurrencies, the PI social dominance stands at 0.012%, indicating increased whispering about Pi Network in the market, consistent with the recent rally. The rise in social discussions for a crypto often signals increased retail interest and a potential local top.
Meanwhile, the large deposits on PI-supporting Centralized Exchanges (CEXs) amount to 3.91 million PI tokens over the last 24 hours, building on the 3.34 million PI tokens inflows, as previously reported by FXStreet on Monday.
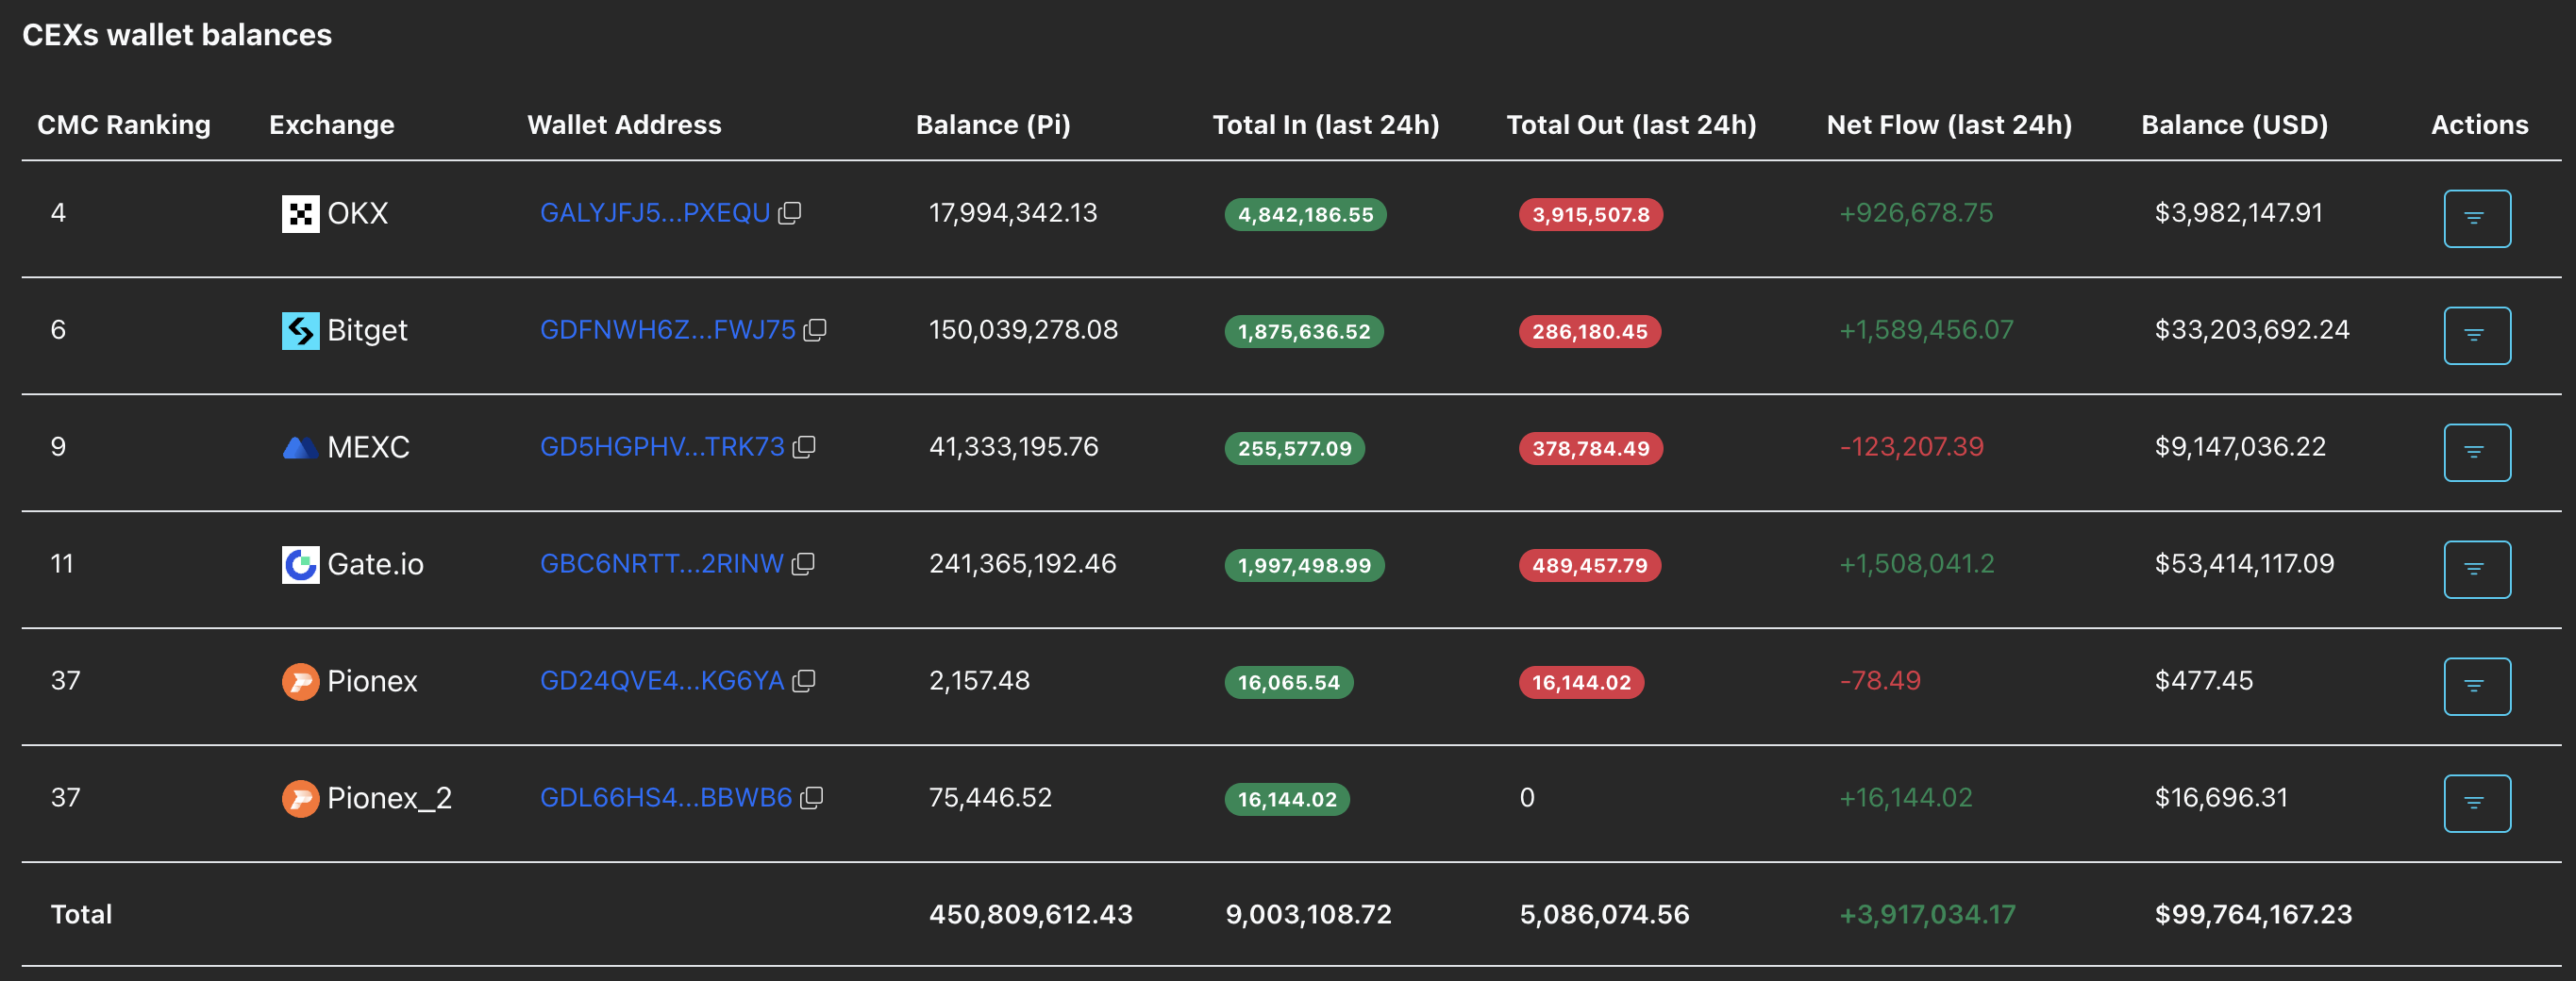
A surge in CEXs' PI reserves reflects increased available supply pressure, adding to the risk of a local top.
Will Pi Network extend its rally to the 200-day EMA?
Pi Network trades above $0.2200 at press time on Tuesday amid a cautiously bullish near-term bias, as the trendline breakout rally struggles to extend higher after the 10% drop on Sunday. The immediate resistance for PI lies at Saturday's high of $0.2396, and a decisive close above it could pave the way for a move toward the 200-day Exponential Moving Average (EMA) at $0.2847.
The cluster of EMAs is improving, with the 50-day EMA rising toward the 100-day EMA for a potential Golden Cross pattern while price trades above both, hinting at an emerging upside trend. However, the 200-day EMA remains above the spot price with a downward-sloping trend, signalling a prevailing bearish bias.
The technical indicators suggest that the trend momentum supports this neutral-to-bullish stance. The Relative Strength Index (RSI) is at 66 on the daily chart, still pointing upwards after exiting the overbought zone on Sunday, suggesting persistent buying pressure. At the same time, the Moving Average Convergence Divergence (MACD) stays above its signal and zero lines, indicating sustained but moderating bullish pressure.
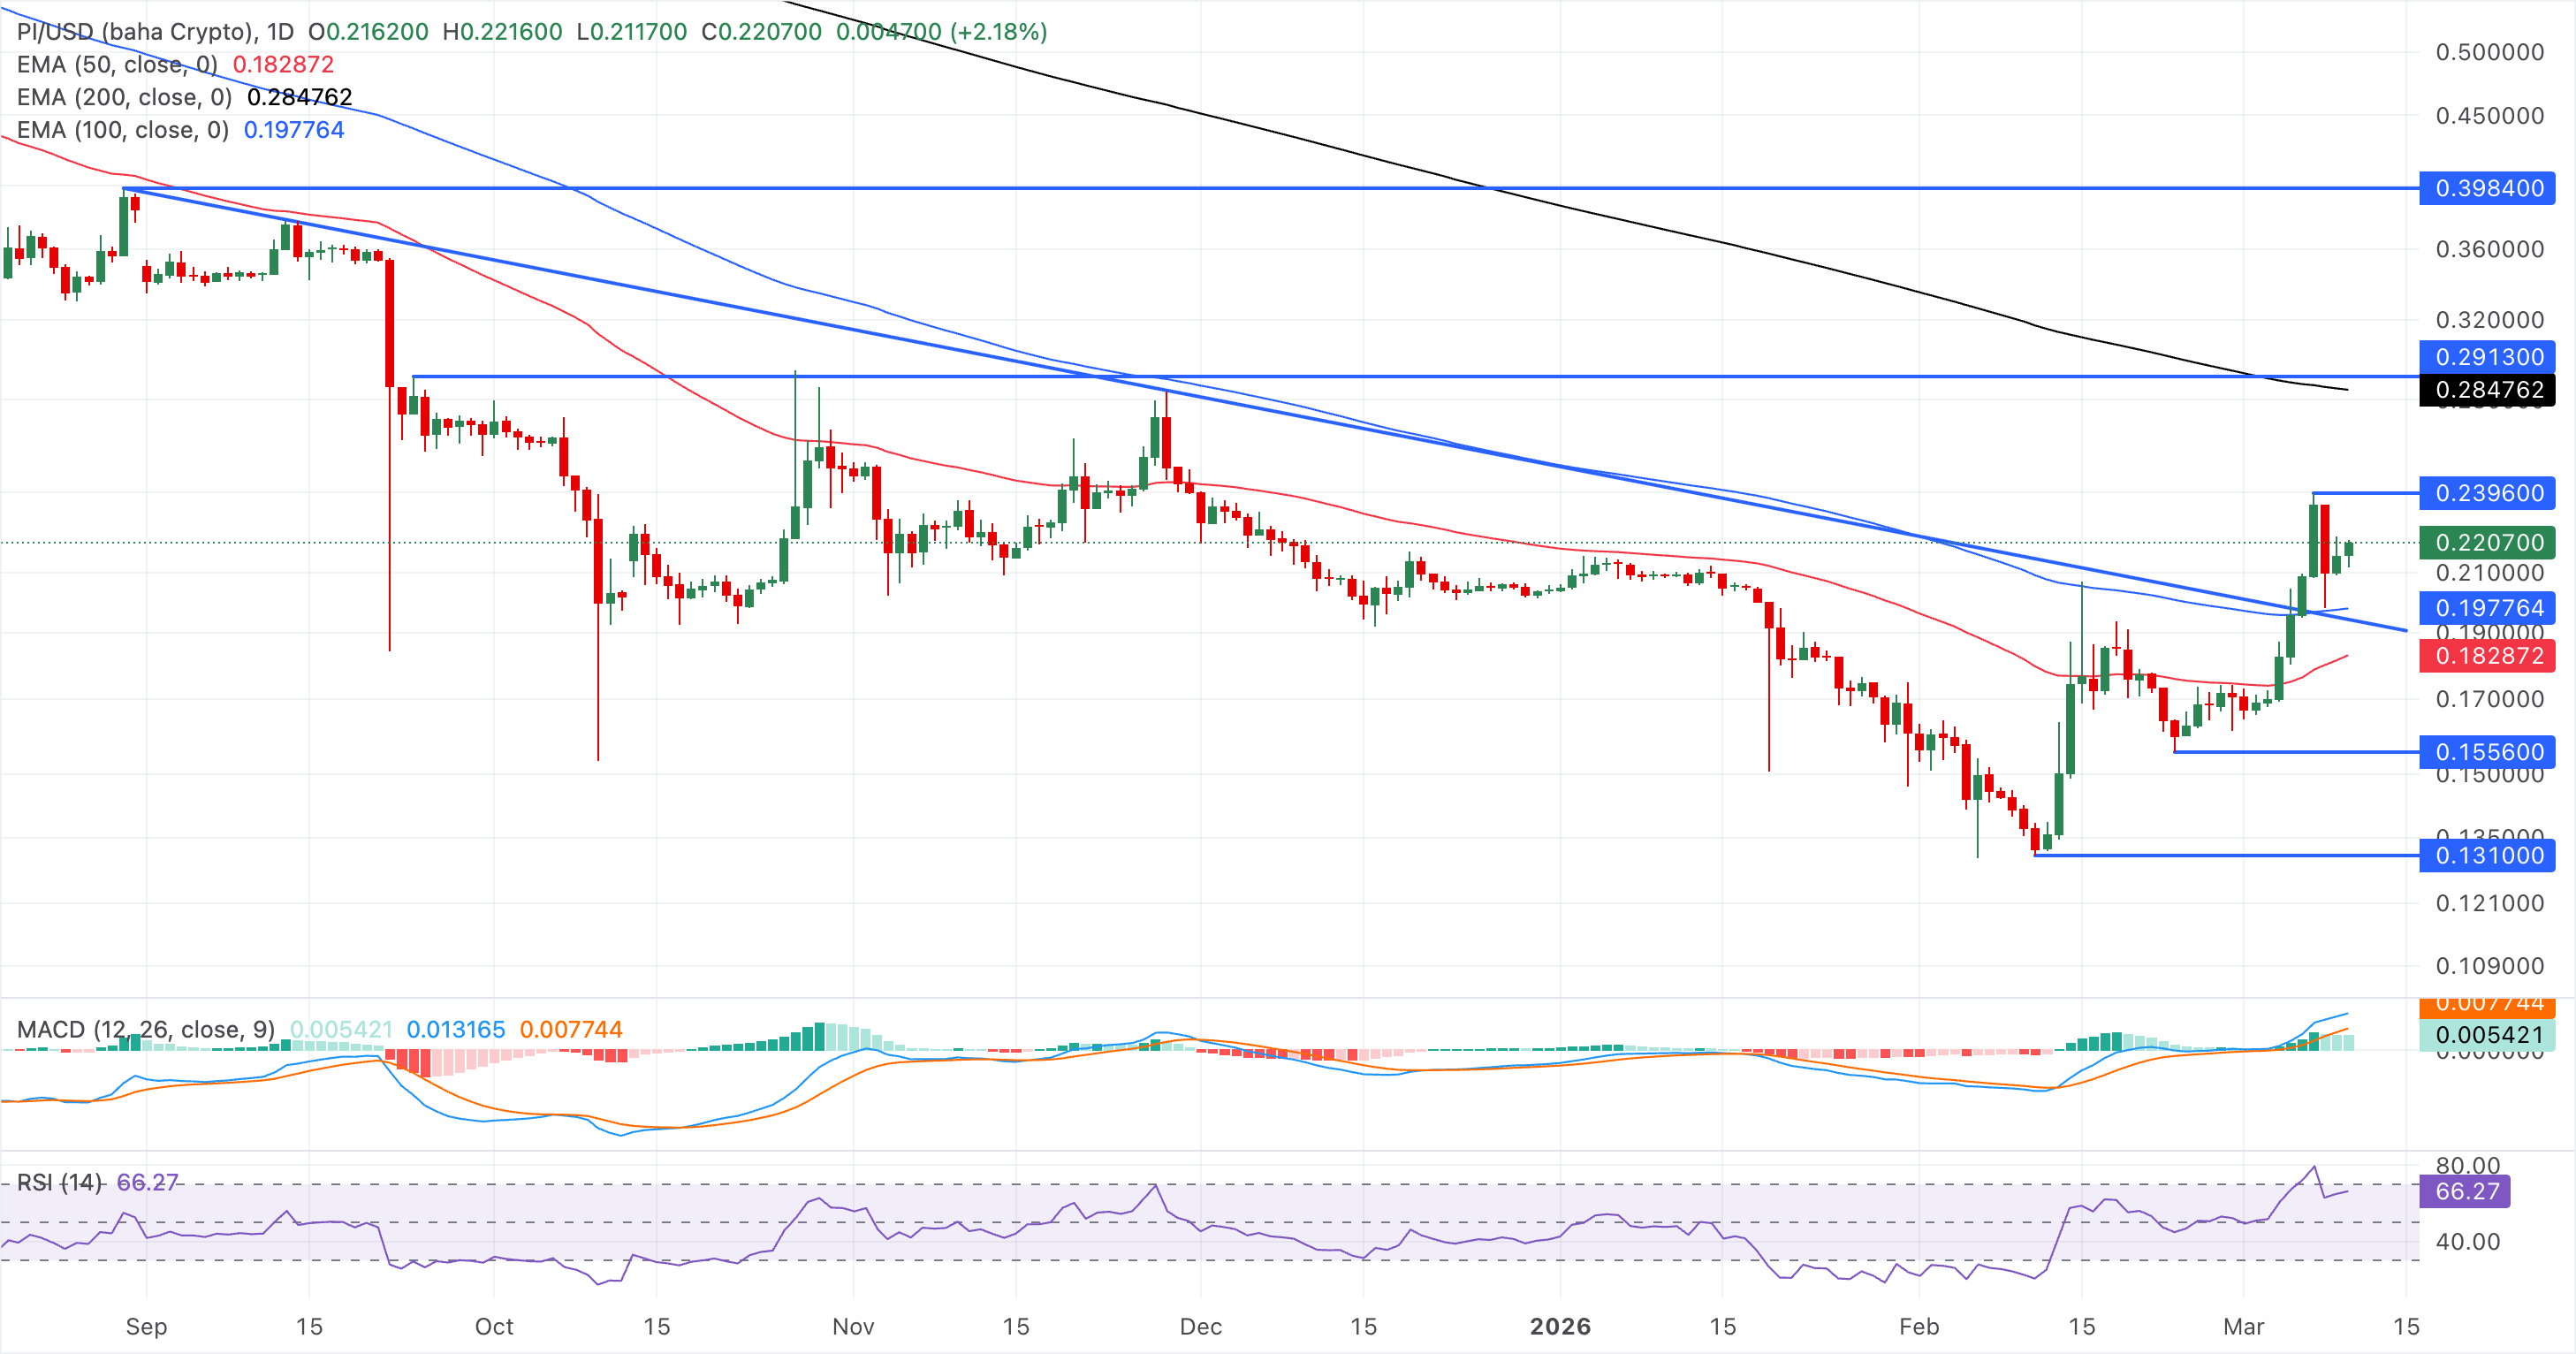
Looking down, the crucial support for PI is the 100-day EMA at $0.1977, close to the $0.2000 psychological level. A deeper pullback below this moving average would expose the 50-day EMA at $0.1828.
(The technical analysis of this story was written with the help of an AI tool.)
Recommended Articles


