


Bittensor Price Forecast: TAO faces major resistance near $200 amid rising bullish activity
- Bittensor is extending gains on Monday, with bulls eyeing above $200.
- Derivatives data shows over 10% increase in TAO futures Open Interest, suggesting a surge in positional buildup.
- The technical outlook signals a major hurdle near $200, where a declining trendline converges with the 50-day EMA.
Bittensor (TAO) edges higher by 8% at press time on Monday, inching closer to the $200 mark. Derivatives data show a surge in TAO futures Open Interest, reflecting the market's anticipation of further recovery. The technical outlook for TAO is mixed as the rise in bullish momentum faces headwinds near $200.
Derivatives data point to improving whale, retail sentiment
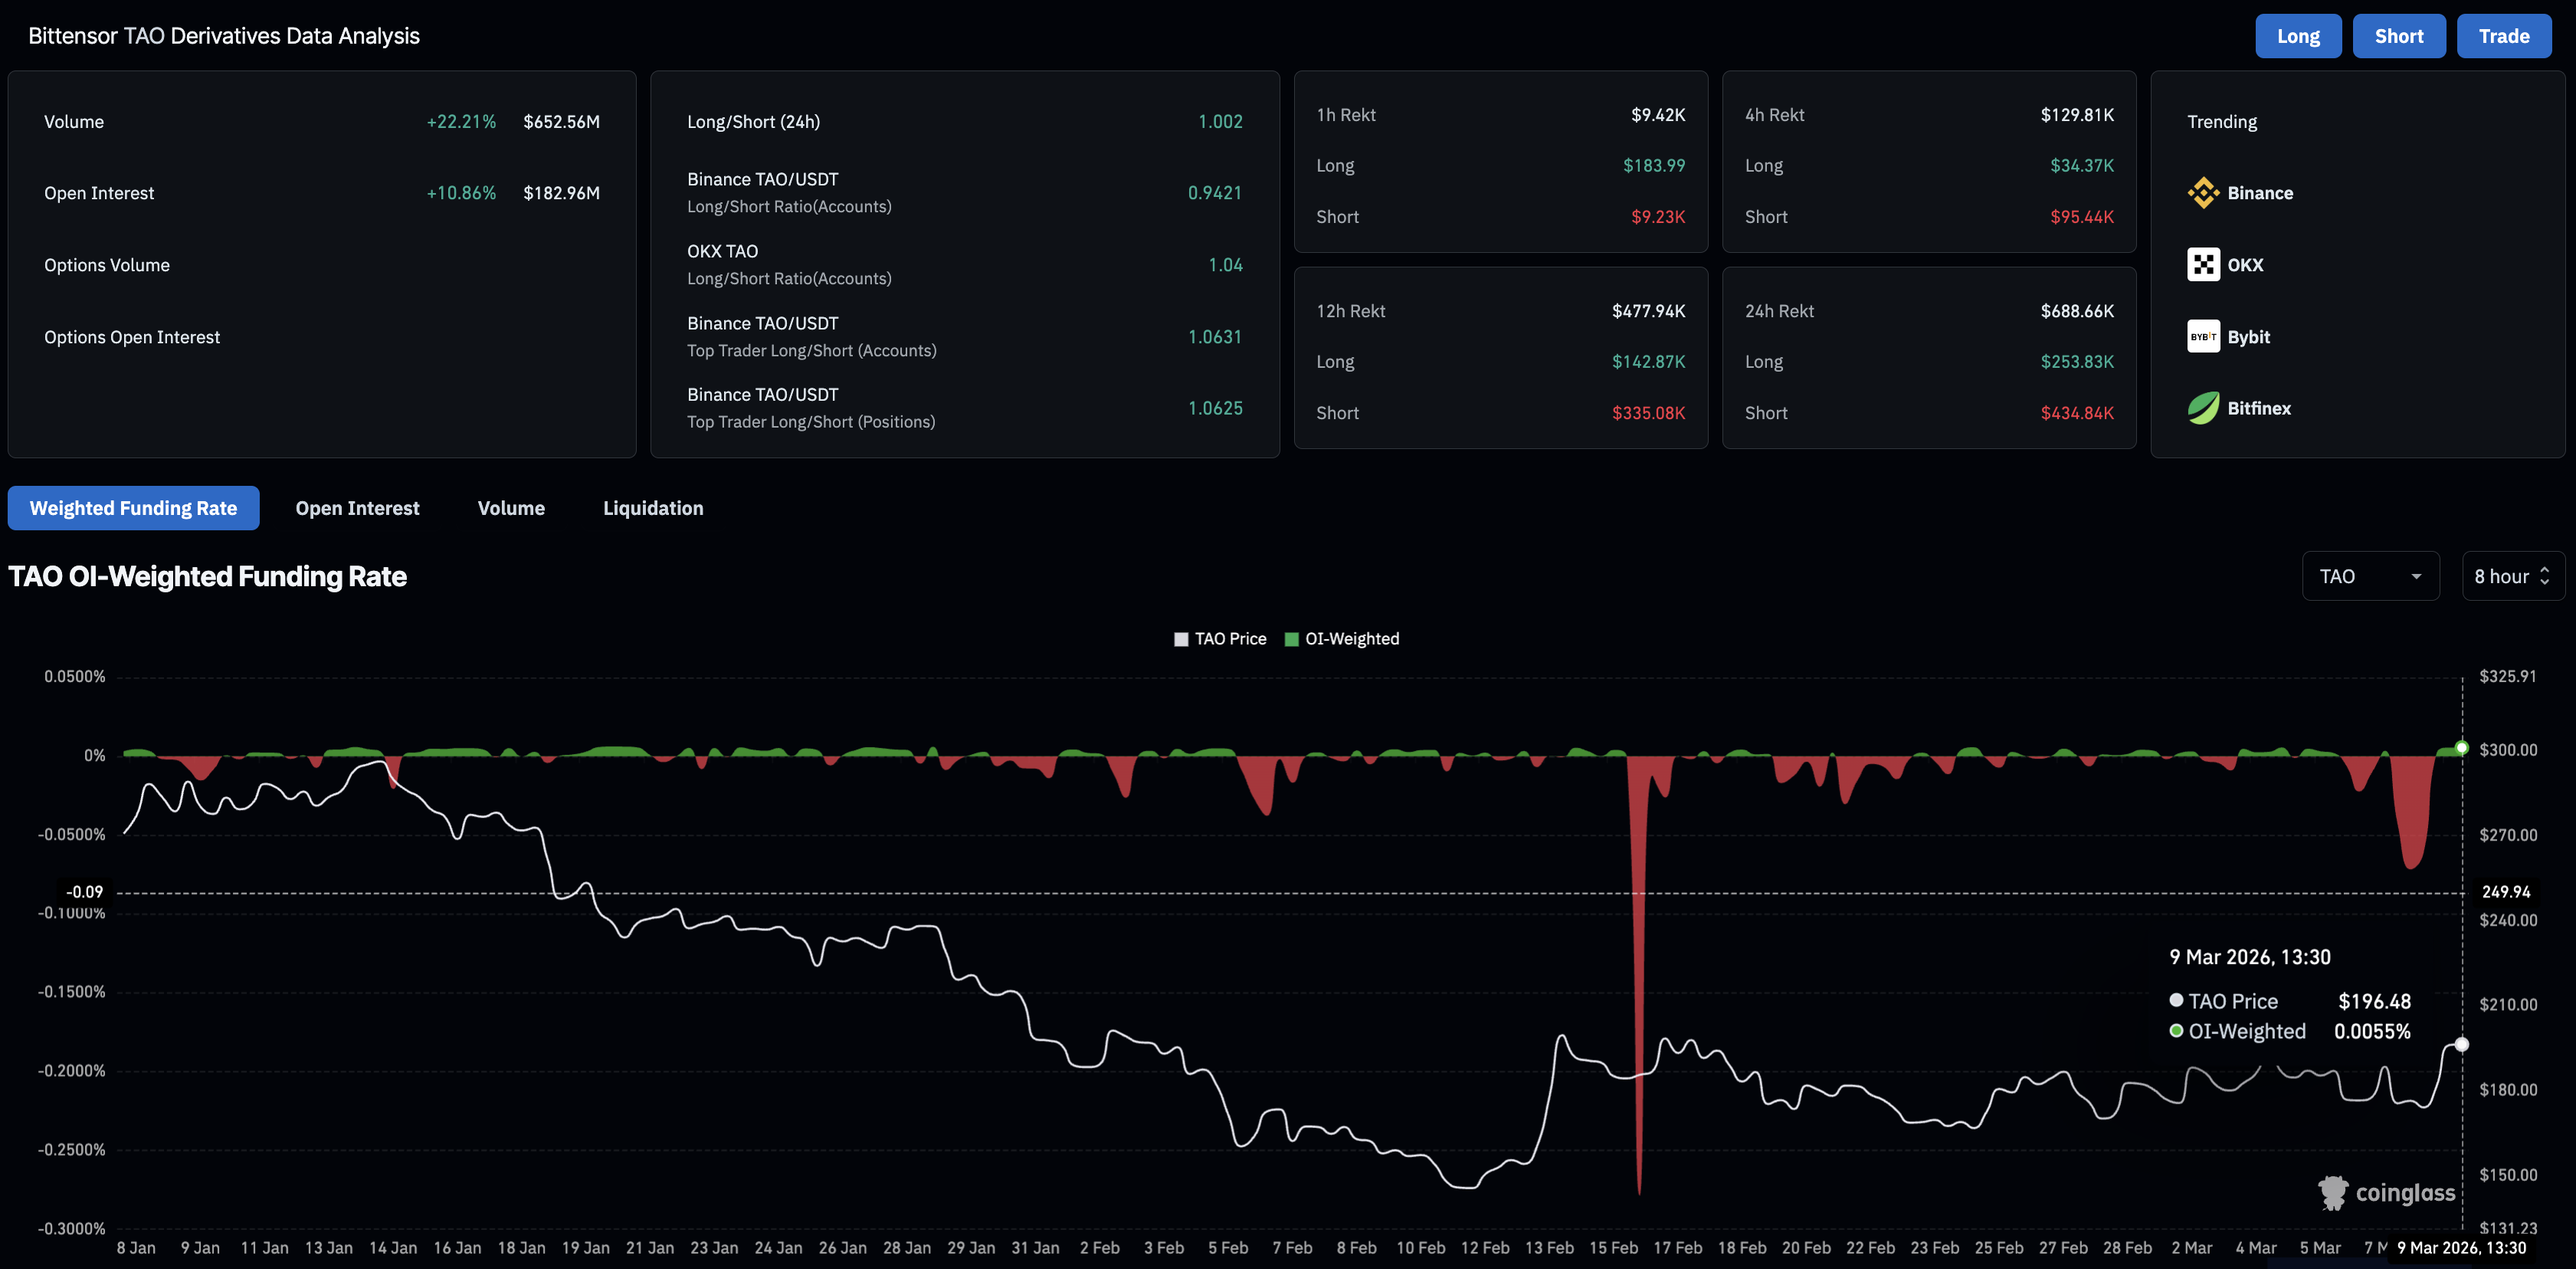
Bittensor is gaining retail interest amid its short-term recovery toward $200. CoinGlass data shows the TAO futures Open Interest (OI) is at $182.96 million, up 10.86% in the last 24 hours, reflecting increased retail demand for the AI token. Typically, a surge in OI supporting a short-term recovery increases the upside potential.
Additionally, the OI-weighted funding rate for TAO is at 0.0055%, up from -0.717% on Sunday, reflecting a significant increase in bullish interest among traders. A consistent increase in OI and funding rate would cement a bullish hold on TAO.
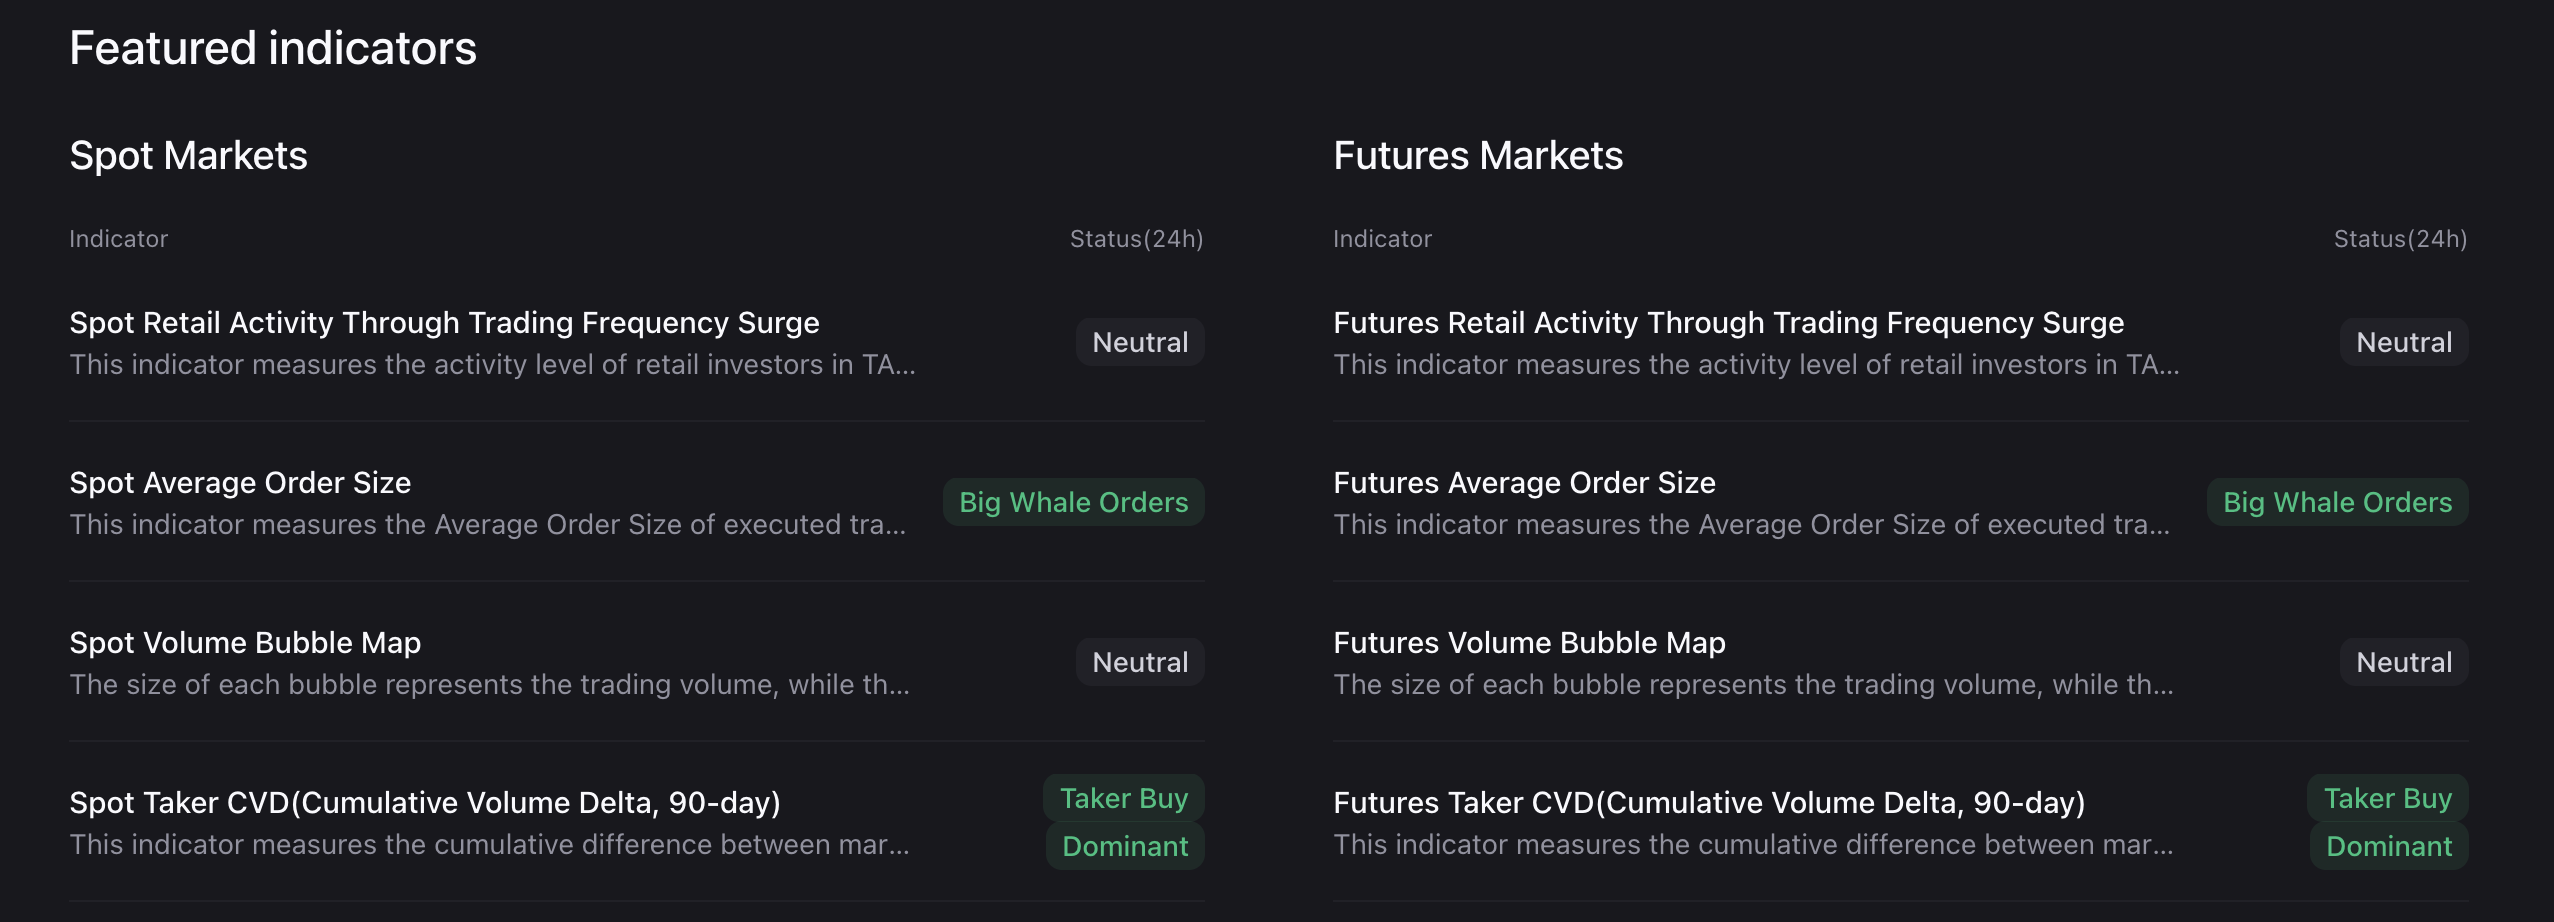
Meanwhile, CryptoQuant data shows that the average order size of executed trades in TAO spot and futures indicates rising interest from large wallet investors, often called whales. Similarly, the difference between market buy and sell volumes over the last three months is positive and increasing, suggesting stronger demand absorbing supply.
Technical outlook: Will Bittensor rise above $200?
Bittensor extends recovery on Monday, approaching the 50-day Exponential Moving Average (EMA) at $196. The AI token shows an upward short-term trend within a broadly descending channel on the daily logarithmic chart, connecting the November 1 and January 14 highs.
TAO faces headwinds from the pattern’s descending trendline near $200, close to the 50-day EMA. A decisive close above this psychological level could expose the 100-day EMA at $227, followed by the November 22 low at $263, which is close to the 200-day EMA at $269.
The technical indicators on the daily chart maintain a cautiously bullish bias. The Moving Average Convergence and Divergence (MACD) indicator rises toward the zero line as positive histogram persists, sustaining a buy signal. Meanwhile, the Relative Strength Index (RSI) at 56 crosses above the midline, signaling a shift in momentum to buyers and further upside before reaching overbought territory. The AI token could extend its rally above $200 if the momentum indicators continue to rise.
On the downside, immediate support for TAO is at the February 6 swing low at $142. If the AI token clears below this level, it could extend the decline to the $100 psychological level.
(The technical analysis of this story was written with the help of an AI tool.)
Recommended Articles


