


HBAR Breaks Down as Hedera TVL Explodes 50% — What’s the Market Seeing?
A major Made In USA coin is flashing fresh downside risk even as activity across its network grows rapidly. The token is already down about 11% year-to-date and roughly 58% over the past year.
Now, a bearish chart pattern has appeared just as capital locked on the network jumps nearly 50%, creating a rare clash between improving fundamentals and weakening price action.
Bearish Breakdown Appears Even as Network Capital Expands
The project in question is Hedera, with a native token named HBAR.
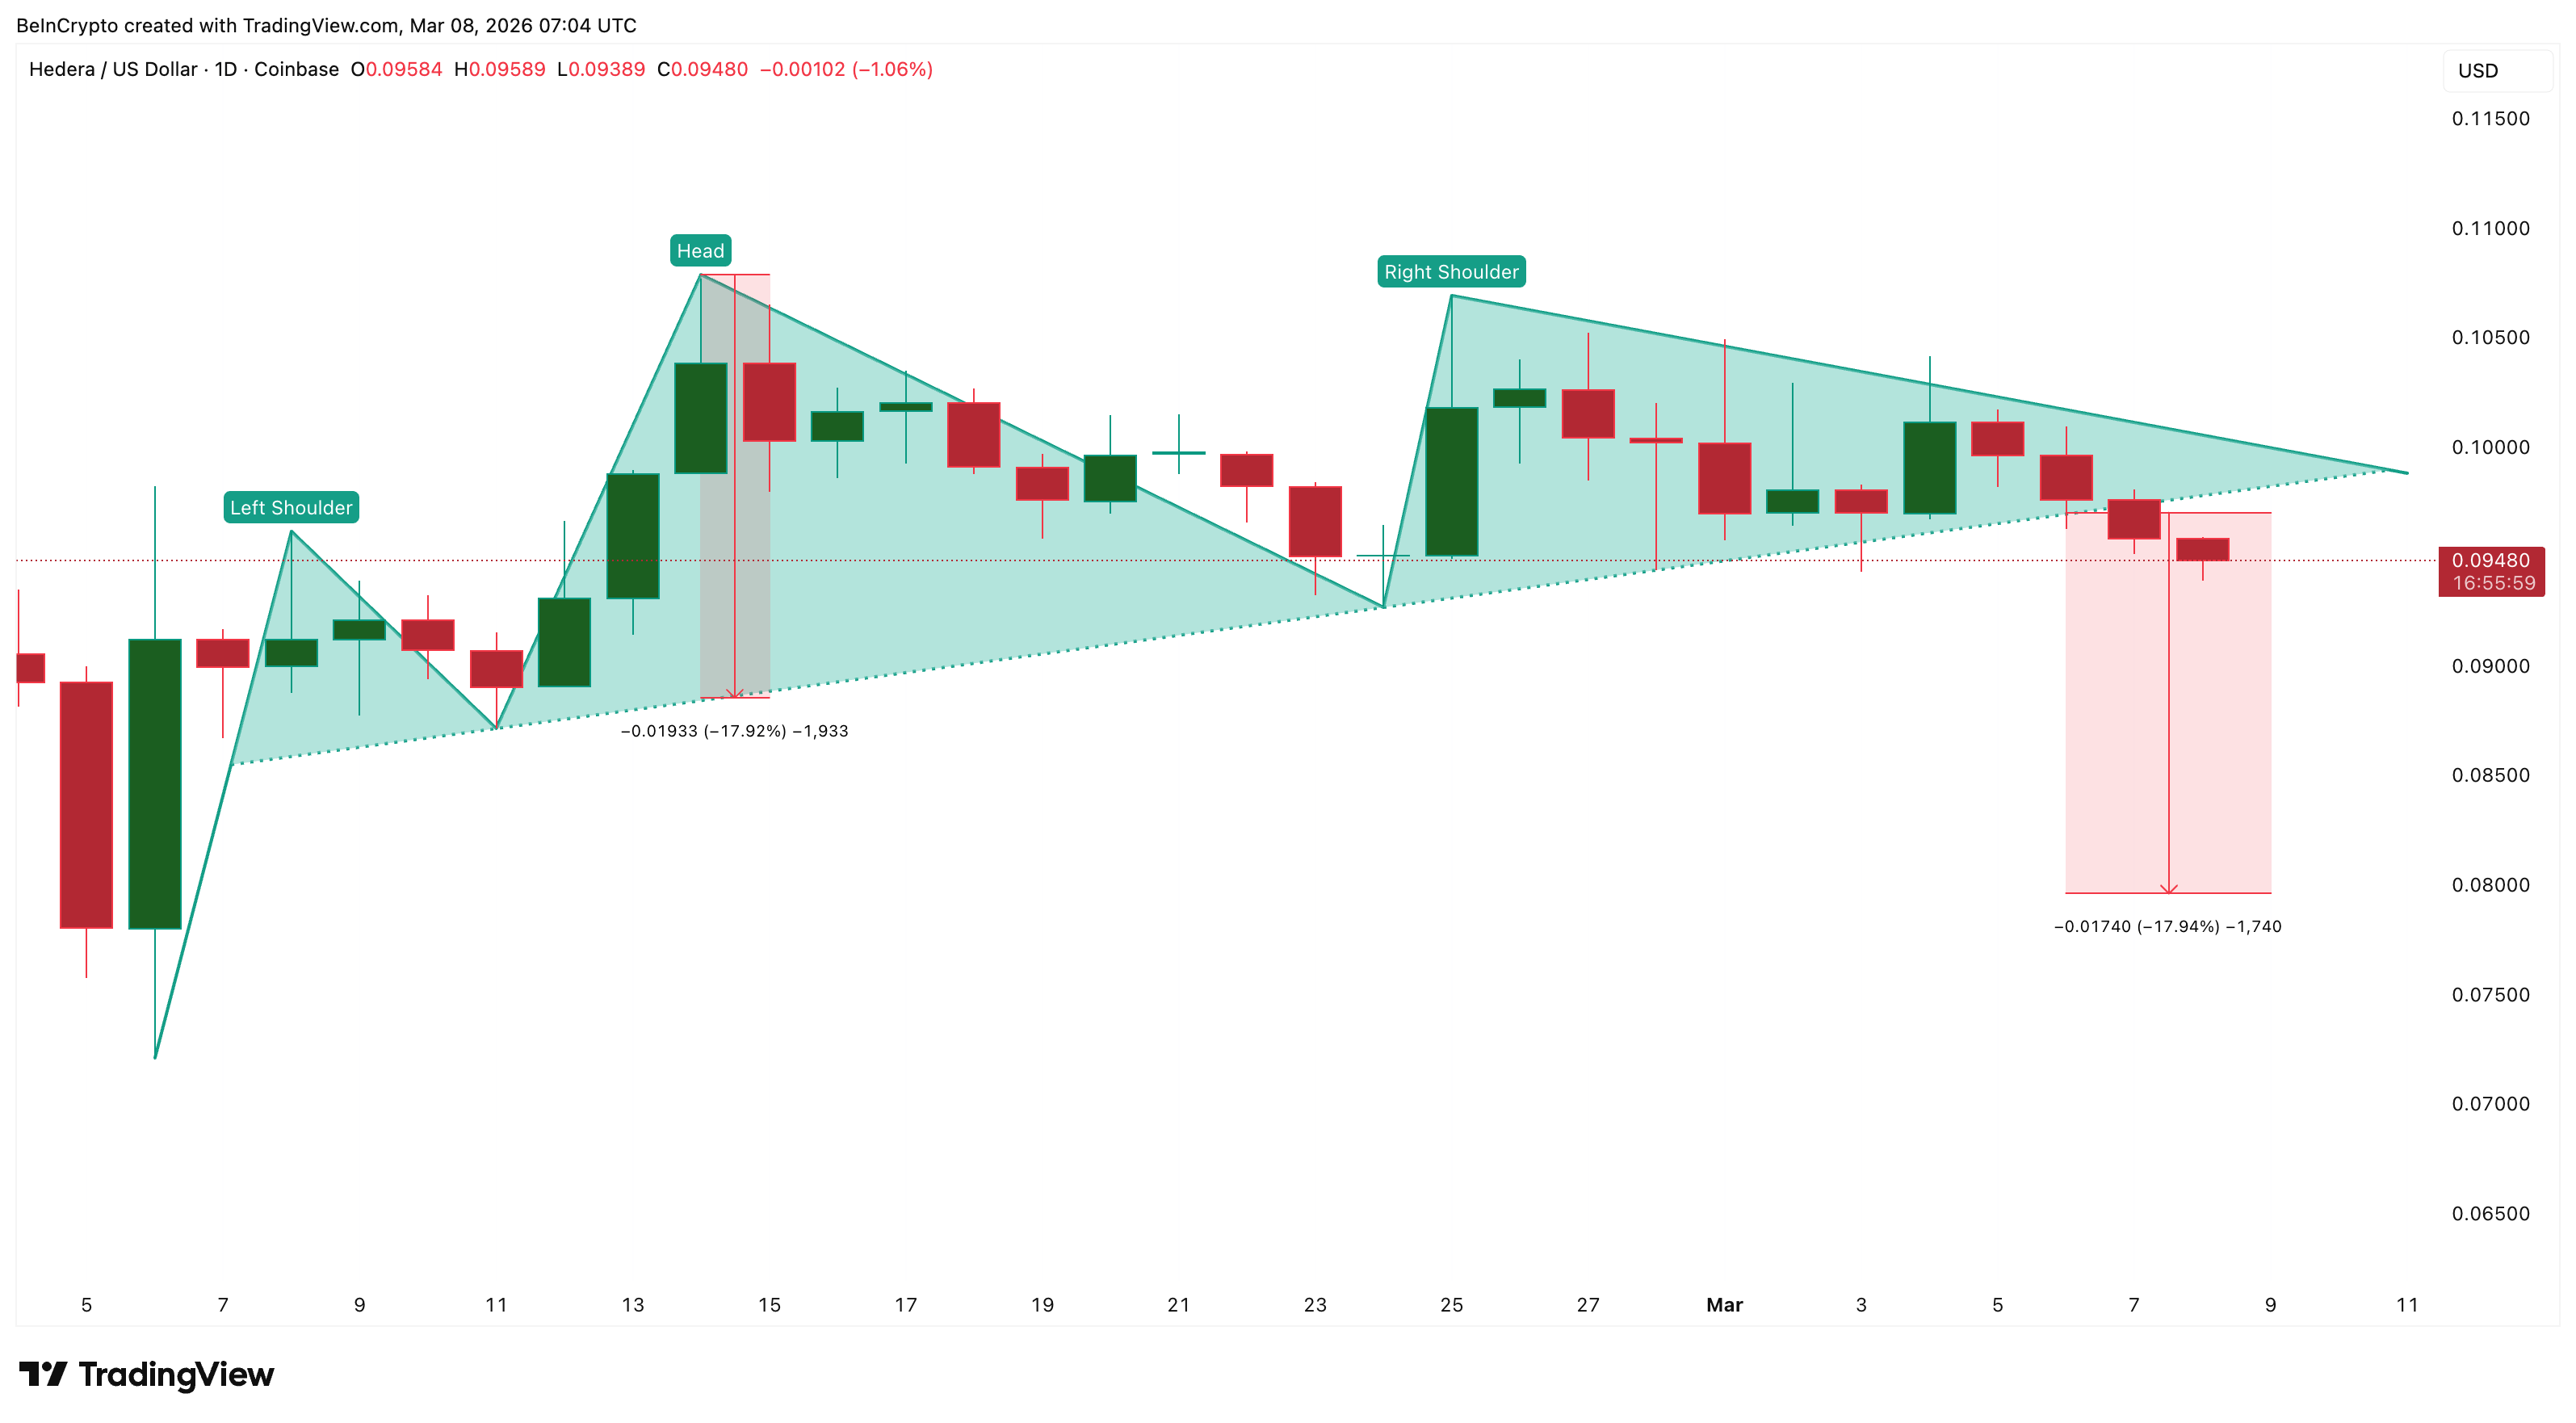
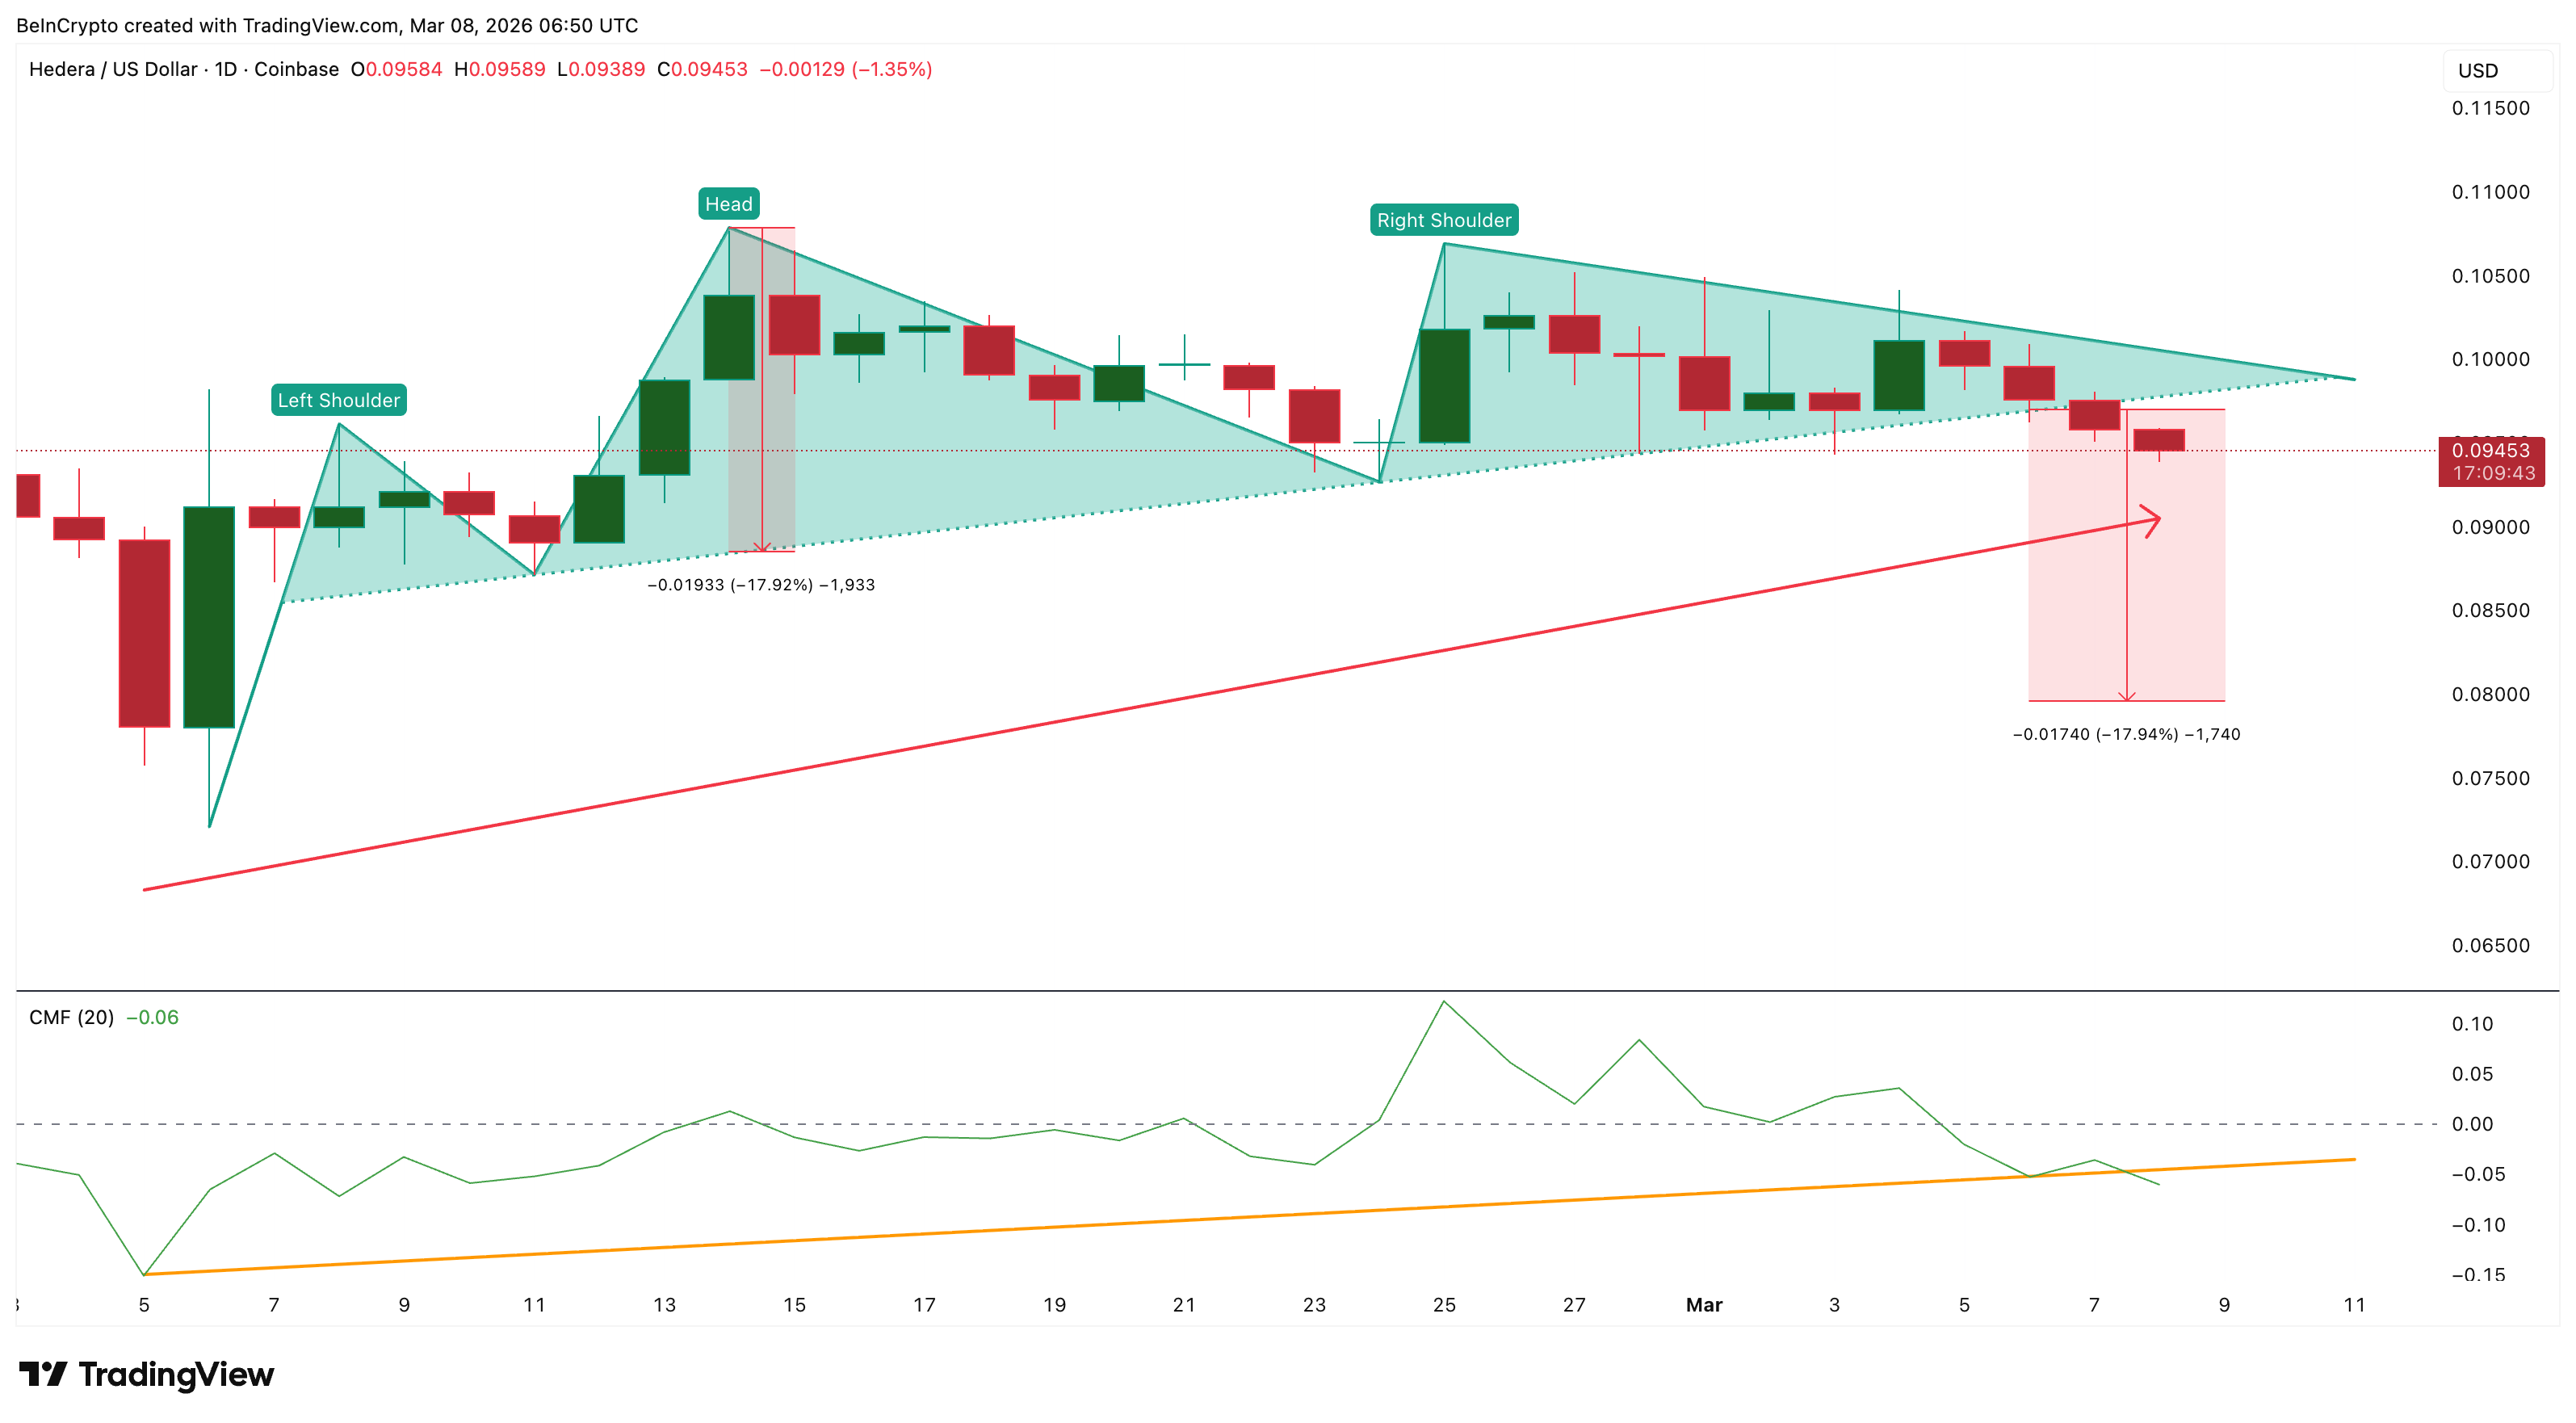
Recently, HBAR slipped below the neckline of a head-and-shoulders pattern, a technical formation that often signals trend reversals. This breakdown occurred on March 7 and immediately exposed the asset to further downside risk.
What makes the move unusual is that the weakness appeared just as Hedera’s network metrics improved sharply.
Want more token insights like this? Sign up for Editor Harsh Notariya’s Daily Crypto Newsletter here.
 HBAR Price Structure: TradingView
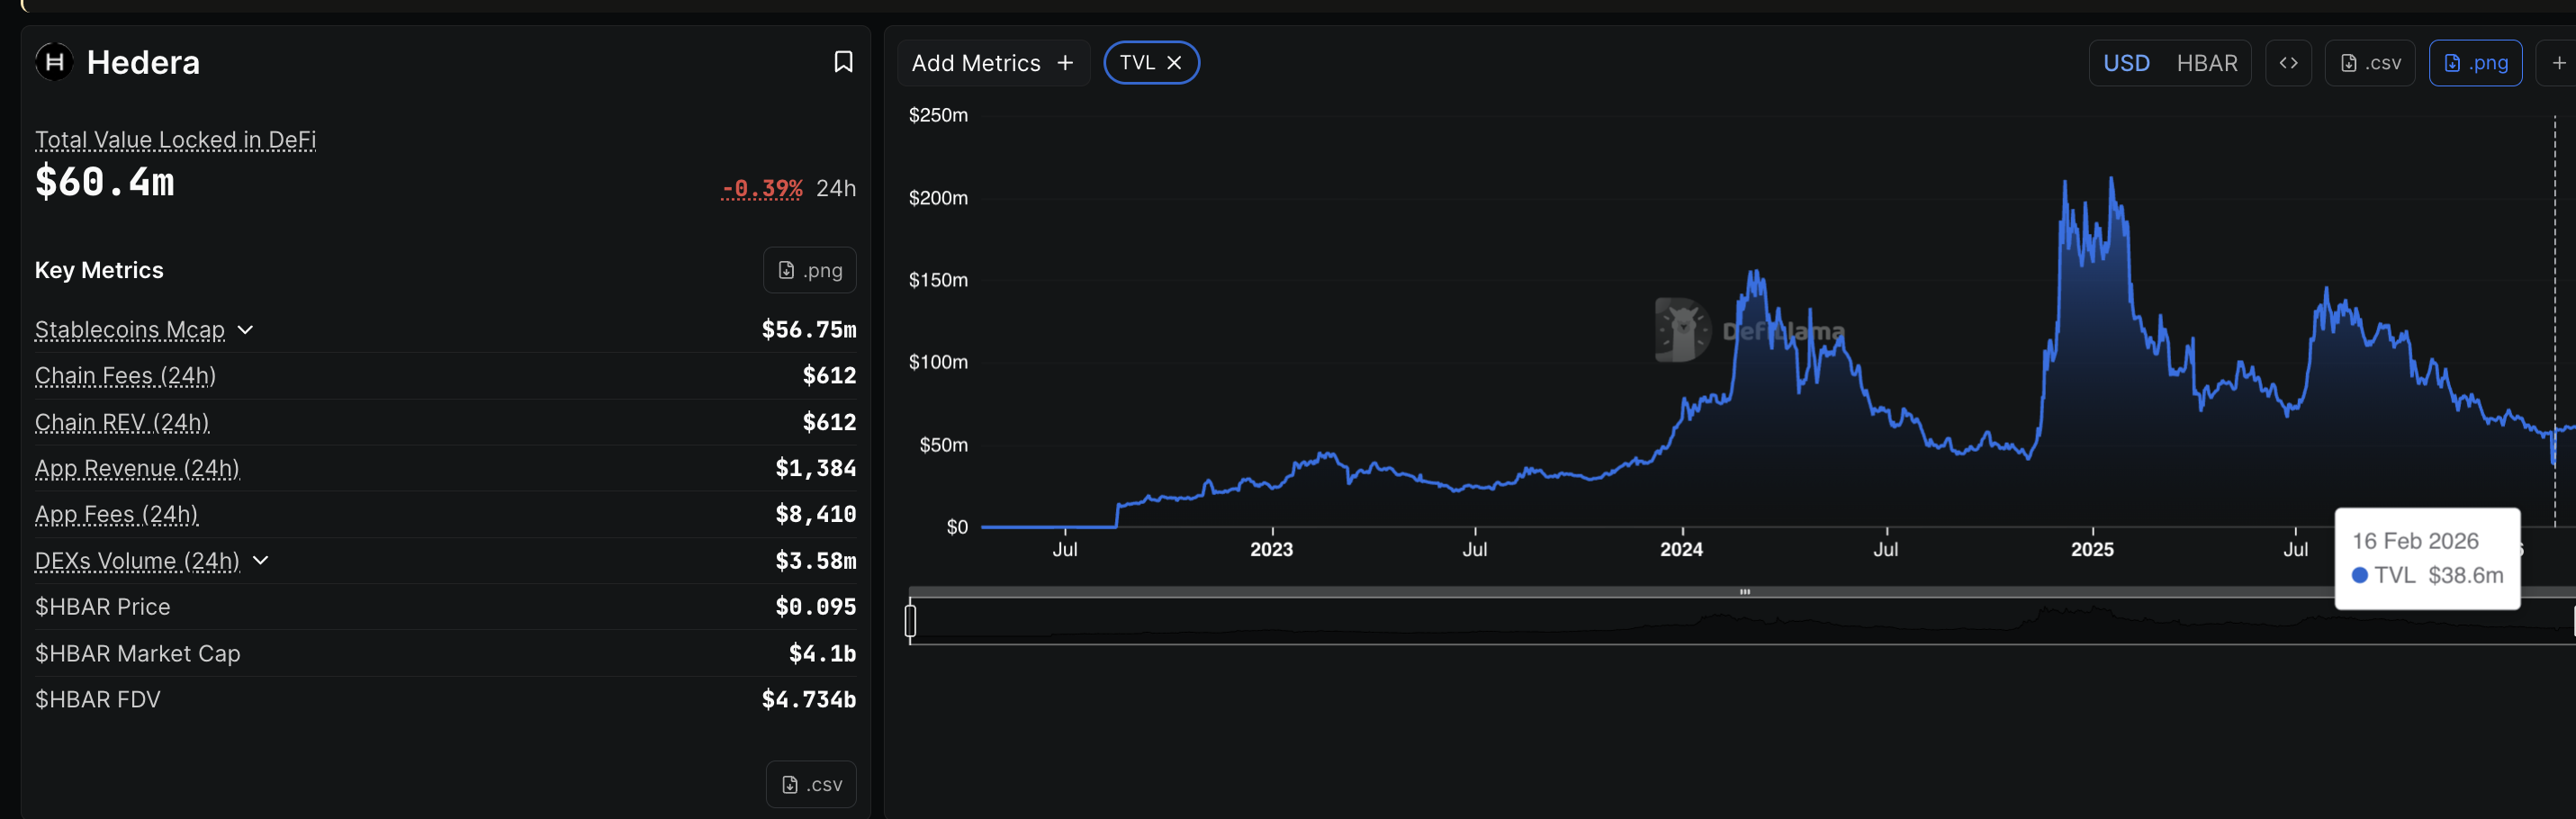
According to DeFiLlama data, the network’s Total Value Locked (TVL)—the total value of assets deposited in decentralized applications—has climbed from roughly $38.6 million on February 16 to about $60.4 million at press time. That represents over a 50% increase in just a few weeks for this Made in USA project.
Normally, rising TVL suggests growing network usage and stronger investor confidence. More capital entering decentralized applications usually supports the price of the underlying token.
 Made In USA Project’s DeFi Outperformance: Defillama
But HBAR’s chart is telling a different story.
Instead of strengthening alongside the rising TVL, the token is weakening technically. This divergence suggests the market is currently prioritizing technical structure over improving fundamentals, which often happens during broader bearish phases.
While the chart breakdown signals risk, momentum indicators show that some traders are still trying to buy the dip.
Dip Buyers Continue Accumulating HBAR
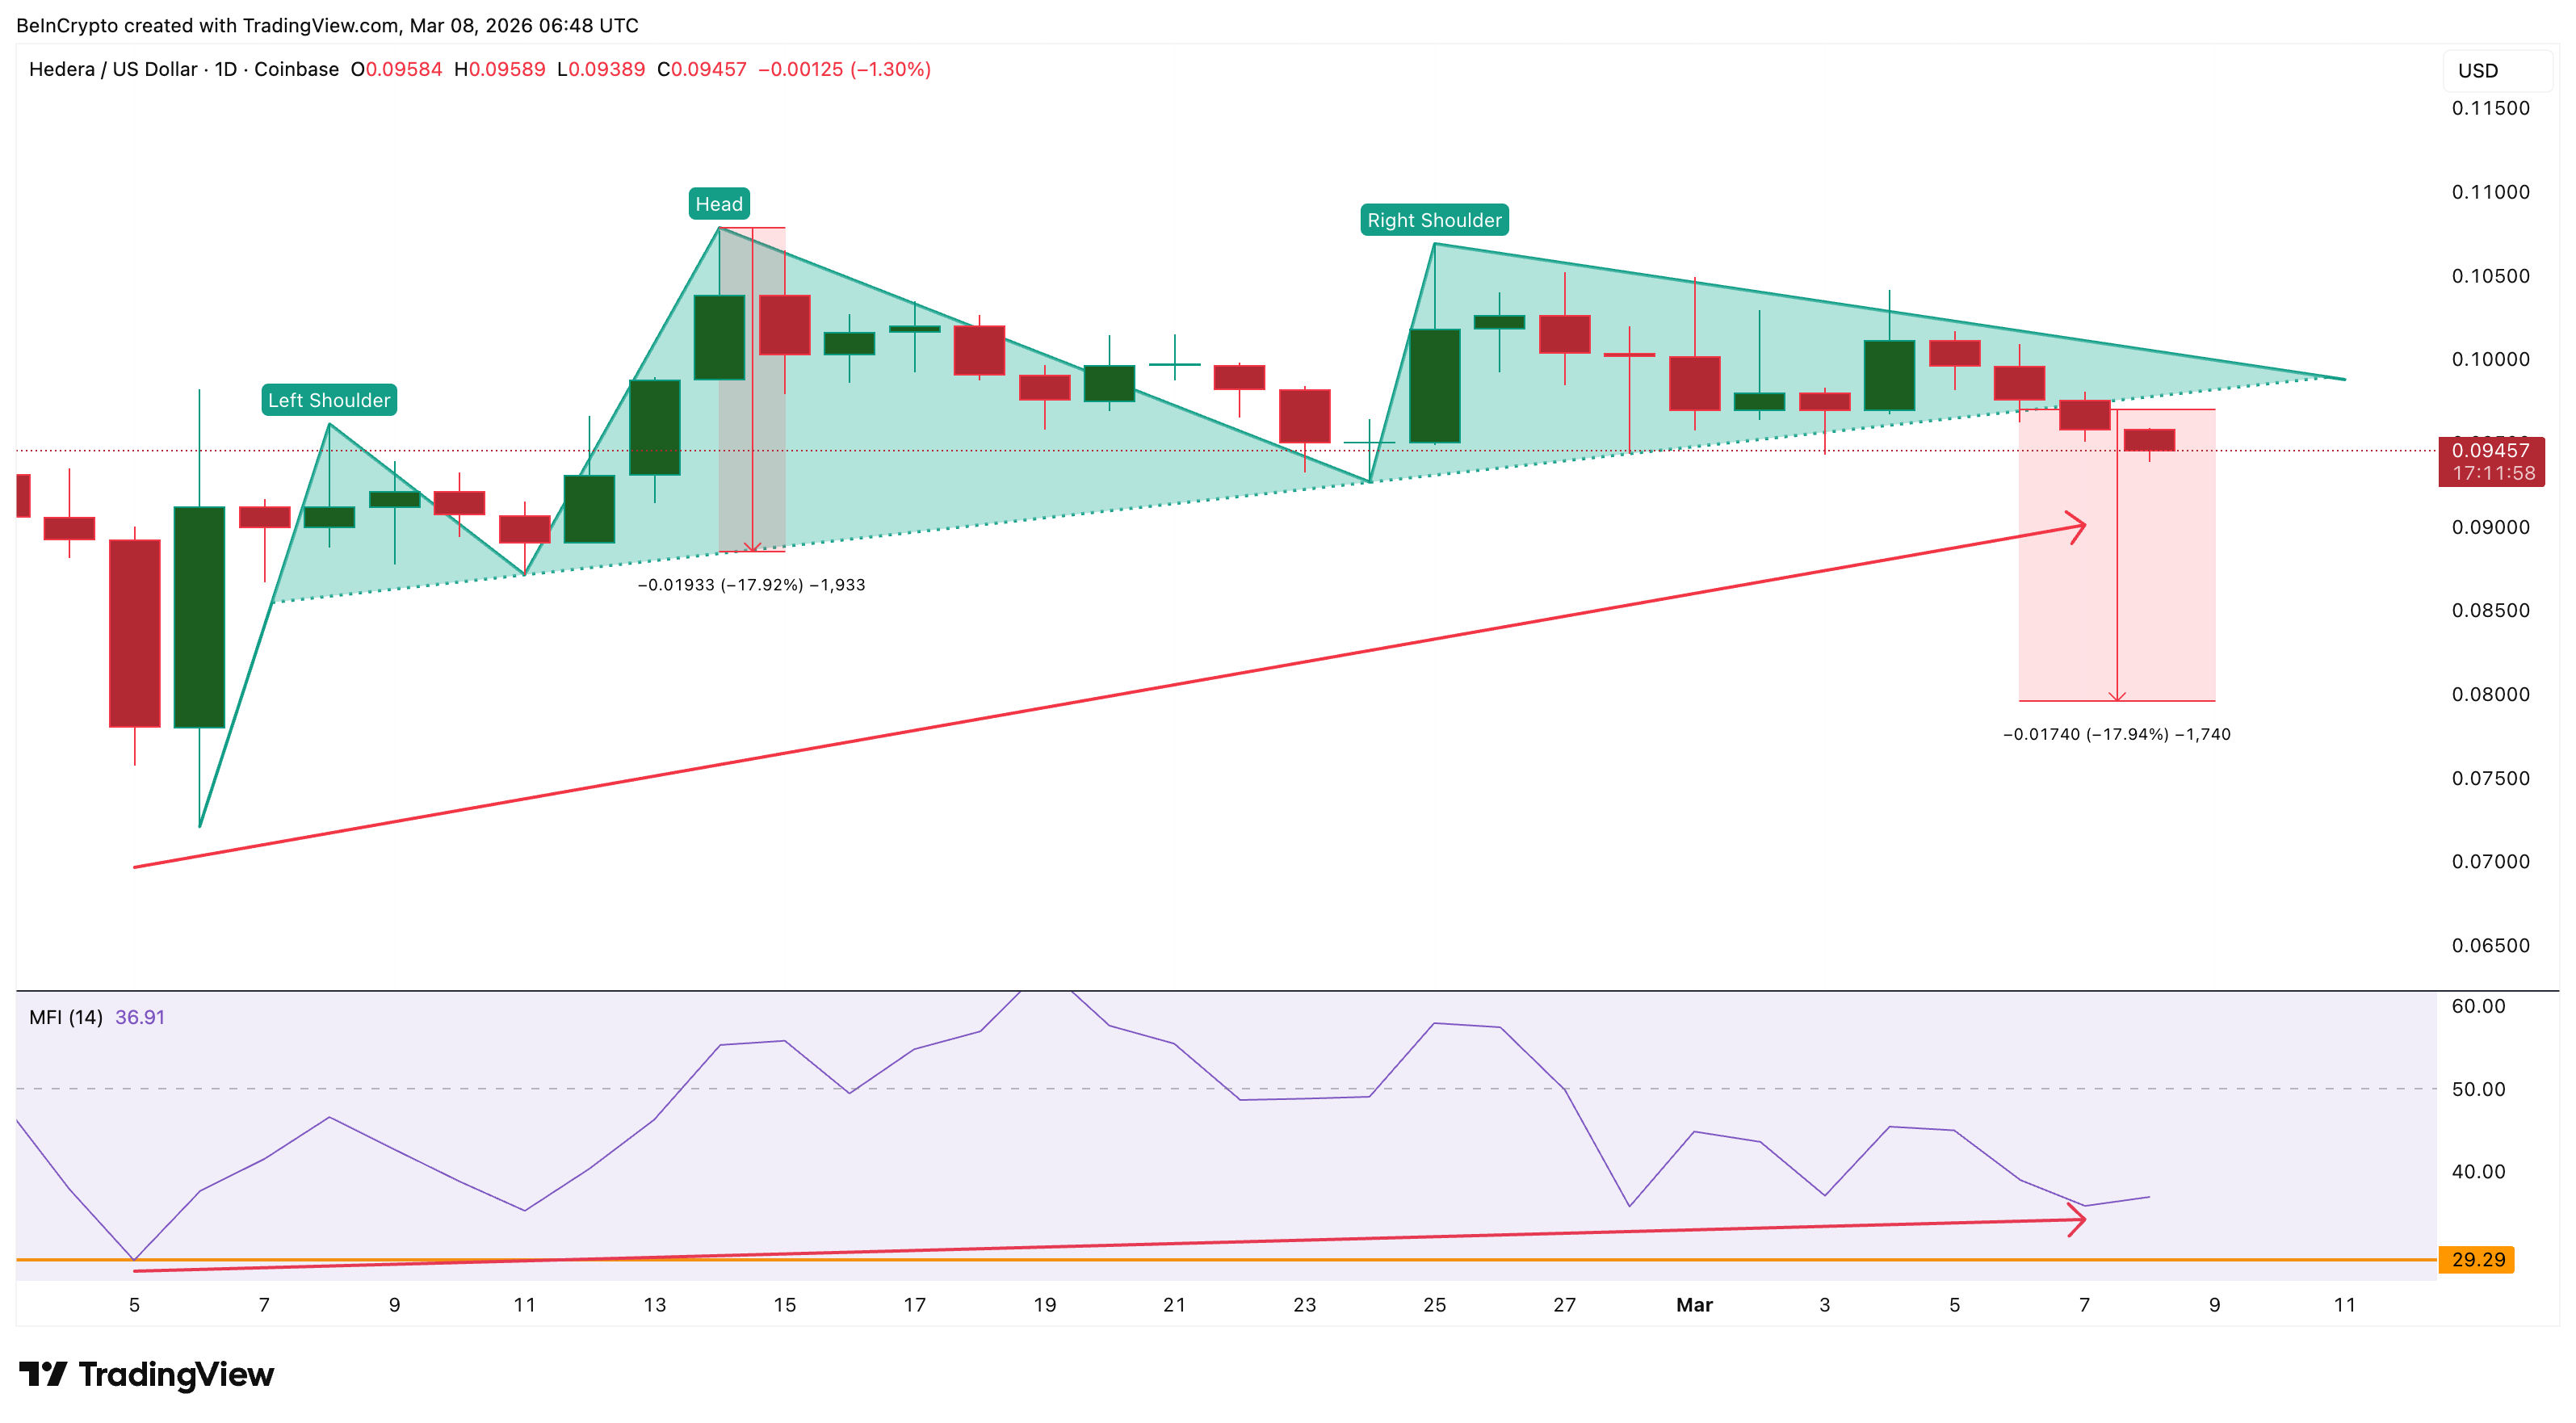
Despite the bearish pattern, retail traders linked to this Made in USA coin appear to be stepping into the market. One signal pointing to this behavior comes from the Money Flow Index (MFI). The MFI measures buying and selling pressure by combining price movement with trading volume. Traders often interpret it as a proxy for dip-buying activity, because rising MFI usually indicates buyers stepping in during pullbacks.
Between February 5 and March 7, HBAR’s price gradually trended higher. During the same period, the MFI also formed a rising trend, showing that traders were consistently buying the dips.
 Dip Buyers In Play: TradingView
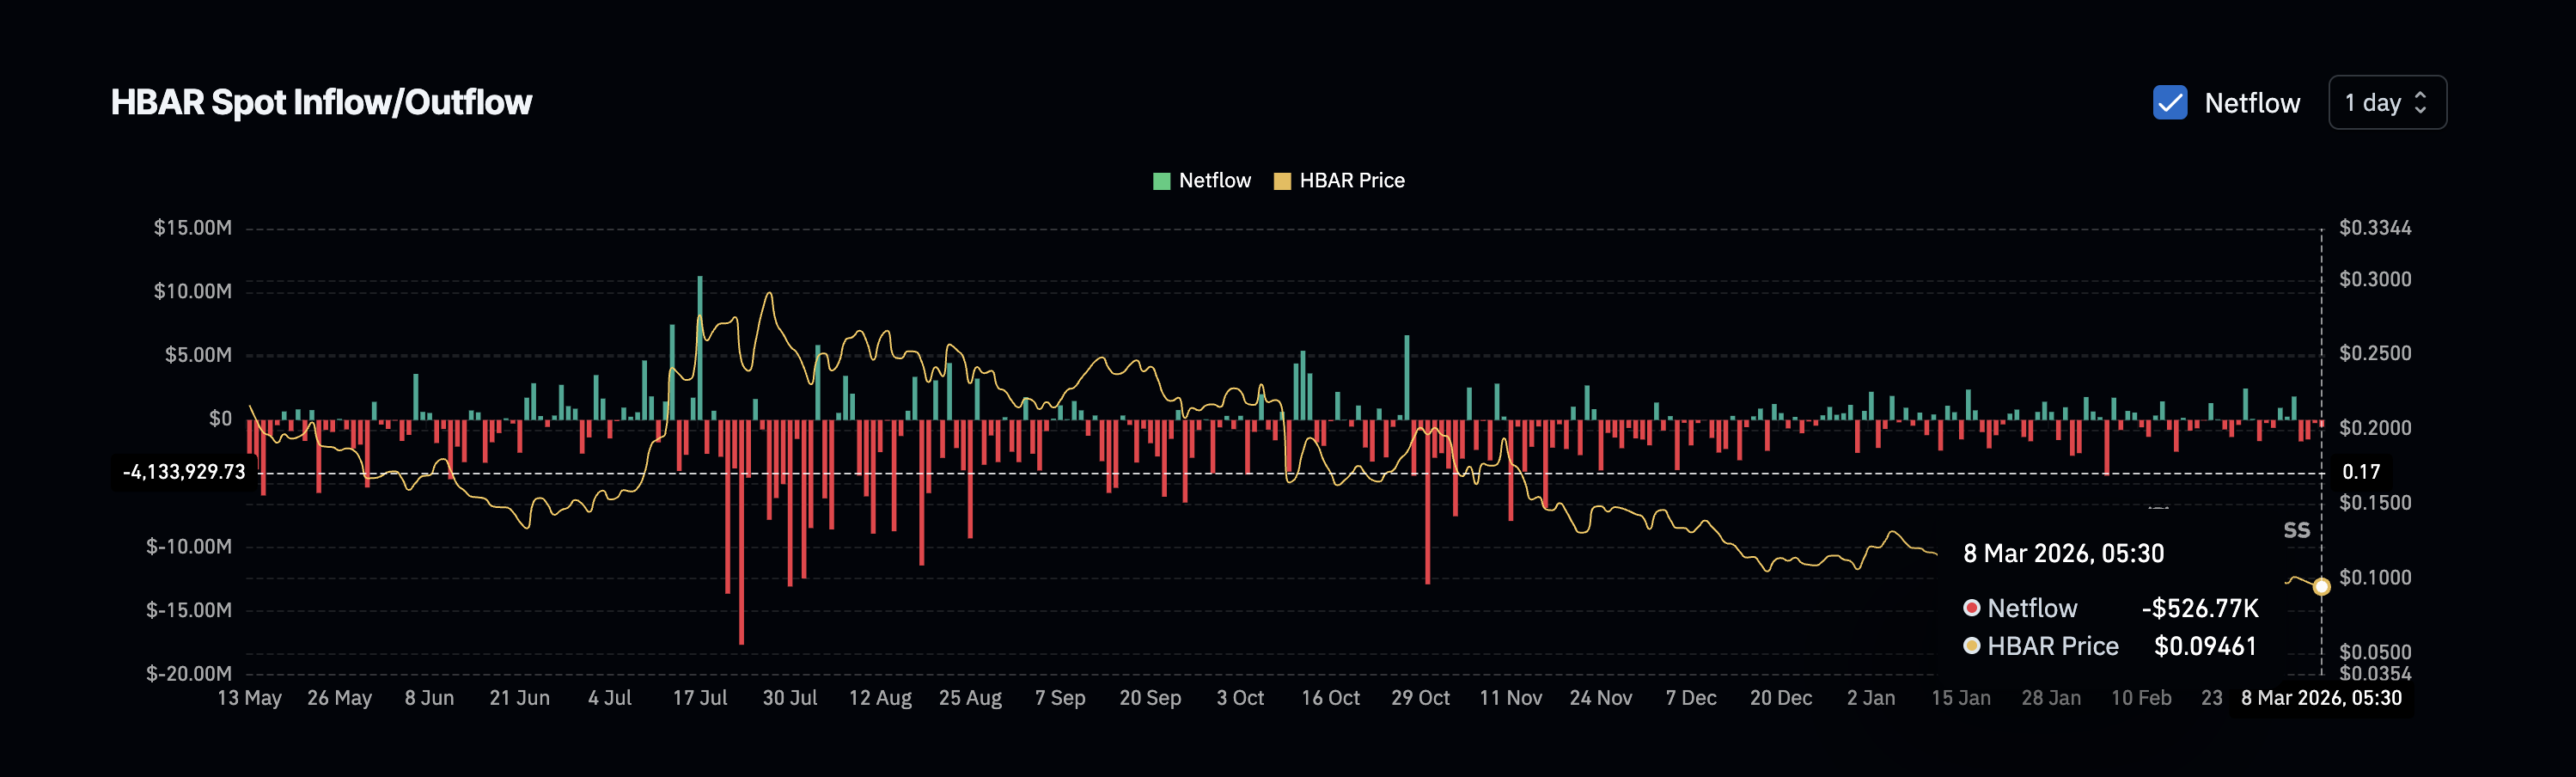
Near-term exchange flow data reinforces this signal. Since March 5 (despite price weakness), this Made in USA coin has recorded persistent exchange outflows, meaning tokens have been leaving exchanges rather than moving onto them.
Even after the head-and-shoulders breakdown on March 7, this pattern did not reverse. The latest recorded outflow shows roughly $526,770 worth of HBAR leaving exchanges, suggesting that some traders are still accumulating despite the weakening technical structure.
 HBAR Buyers Active: Coinglass
Taken together, the rising MFI and continued exchange outflows indicate that retail traders are still attempting to buy the dip or even guess the bottom for this Made in USA coin. However, retail buying alone does not necessarily stabilize a market. Larger capital flows often determine whether a trend ultimately reverses or continues downward.
That is where the next signal becomes critical.
Capital Outflows and Price Structure Now Align
The Chaikin Money Flow (CMF) indicator provides insight into how larger capital is behaving. CMF tracks whether capital is entering or leaving an asset by combining price movement with volume. Traders often use it as a proxy for large-investor activity.
Recently, CMF fell below the zero line, which signals that capital outflows have begun to outweigh retail inflows. At the same time, the indicator also broke below an ascending trendline that had supported the market since early February. That trendline previously represented steady inflows helping support HBAR’s price.
Once CMF breaks such a structure, it often suggests that larger capital is stepping away from the market, even if retail traders continue buying. However, CMF overall continues to rise with the price, which shows the big money outflows aren’t as aggressive, yet.
 Big Money Flow Weakens: TradingView
Yet, this creates a weak setup. Retail dip buyers remain active, but the broader flow of capital is weakening (already moving out), which increases the risk that the technical breakdown continues playing out.
The HBAR price structure reflects this risk clearly.
Following the neckline break, the head-and-shoulders pattern projects a potential move toward $0.079. From the neckline, this represents roughly an 18% downside move, while from current levels near $0.094, the remaining risk is about 15%.
For bullish momentum to return, HBAR would need to reclaim the $0.101 level, which has repeatedly rejected price advances since late February. A stronger recovery would require a break above $0.106, while the entire bearish pattern becomes invalid above $0.107.
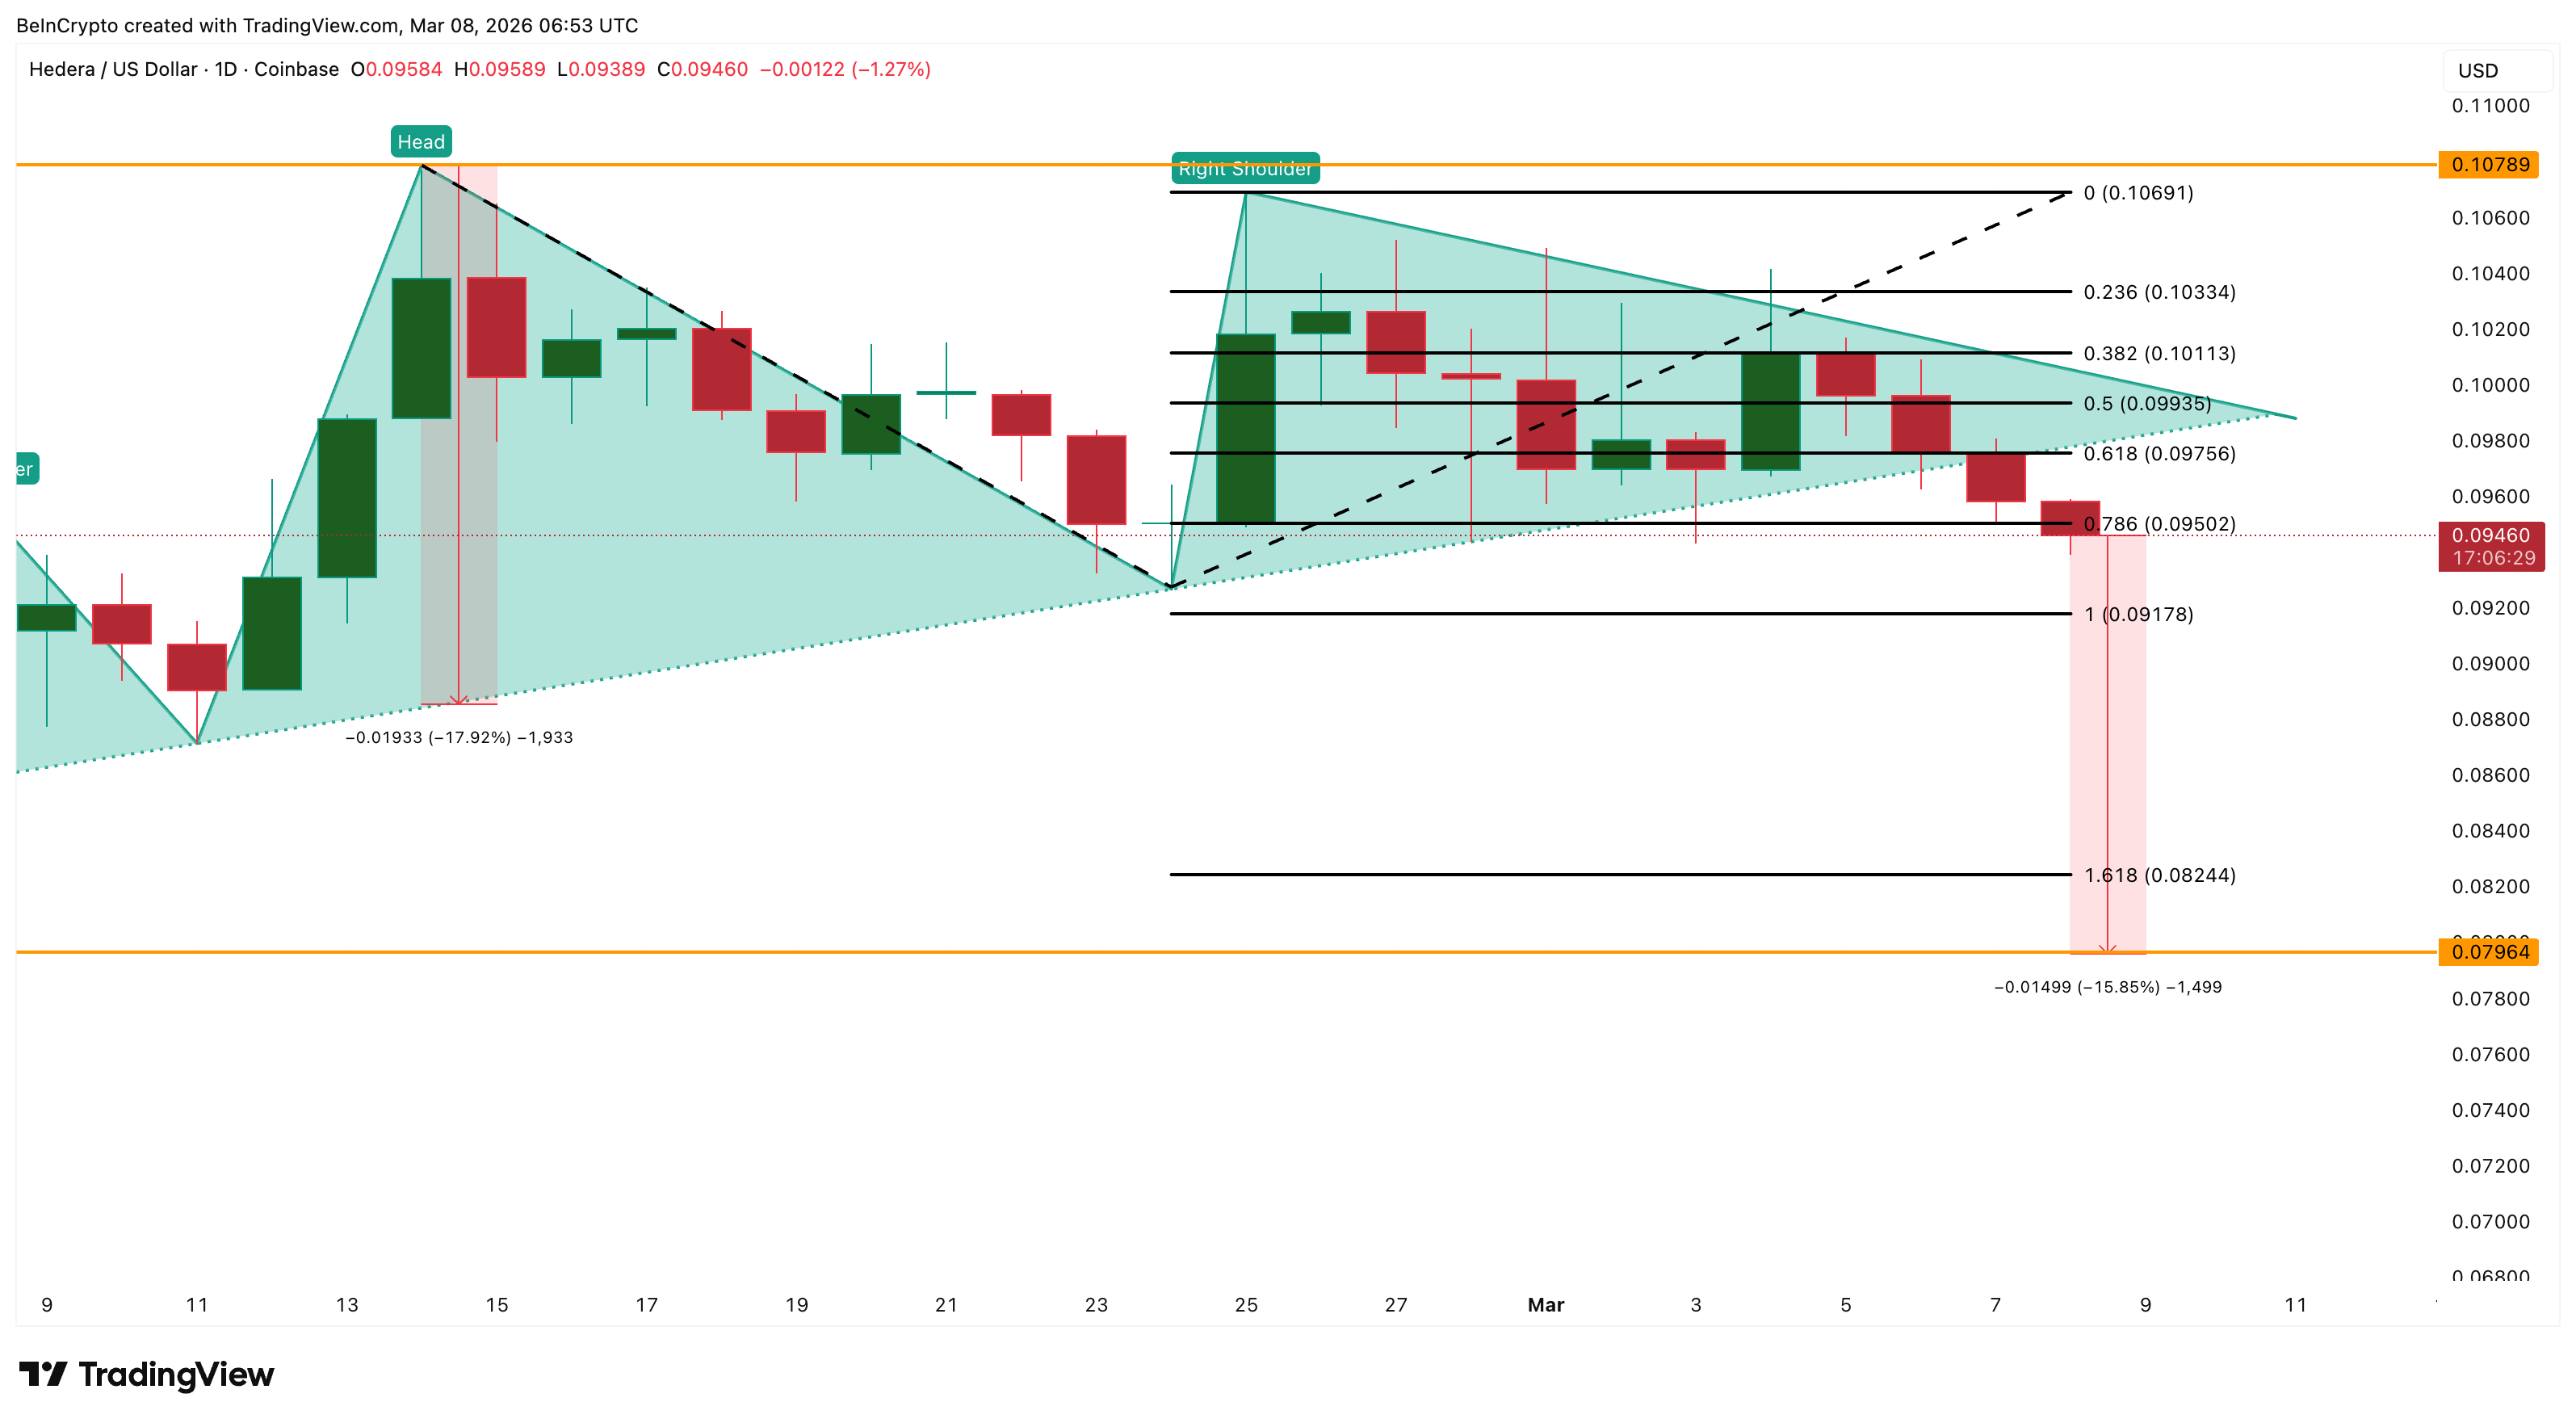 HBAR Price Analysis: TradingView
If the token fails to reclaim $0.095 quickly, the downside structure remains intact. In that case, the next support zones appear near $0.091 and $0.082, before the full head-and-shoulders target around $0.079 comes into focus.
Recommended Articles


