


Hedera’s Pullback Strengthens Breakout Hope — Can HBAR Price Make a 50% Jump?
Hedera (HBAR) price is up about 1% in the past 24 hours, extending a recovery that has quietly gained strength. Over the past seven days, the Hedera price has climbed 11.3%, showing steady buyer interest returning.
While the monthly and quarterly performance remains negative, recent price behavior suggests something more bullish. The Hedera price may be setting up for a breakout attempt. Charts, momentum signals, and investor activity now explain why a pullback, seen between February 14 and February 15 could strengthen Hedera’s breakout outlook.
Bull Flag Holds Firm — Pullback May Be Preparing the Breakout
HBAR price recently seems to be forming a bullish flag-and-pole pattern on the 12-hour chart. A bull flag forms after a strong upward move (the pole), followed by a controlled pullback that allows the market to stabilize before continuing higher. In this case, the initial rally pushed HBAR price up nearly 50% between Feb. 6 and Feb. 14. After reaching its recent high, the price corrected about 9%.
This decline remained inside the flag structure, which is critical for maintaining the bullish setup.
Instead of breaking lower, the price stabilized and began consolidating. HBAR now trades near $0.101, which sits close to the upper boundary of the flag.
Want more token insights like this? Sign up for Editor Harsh Notariya’s Daily Crypto Newsletter here.
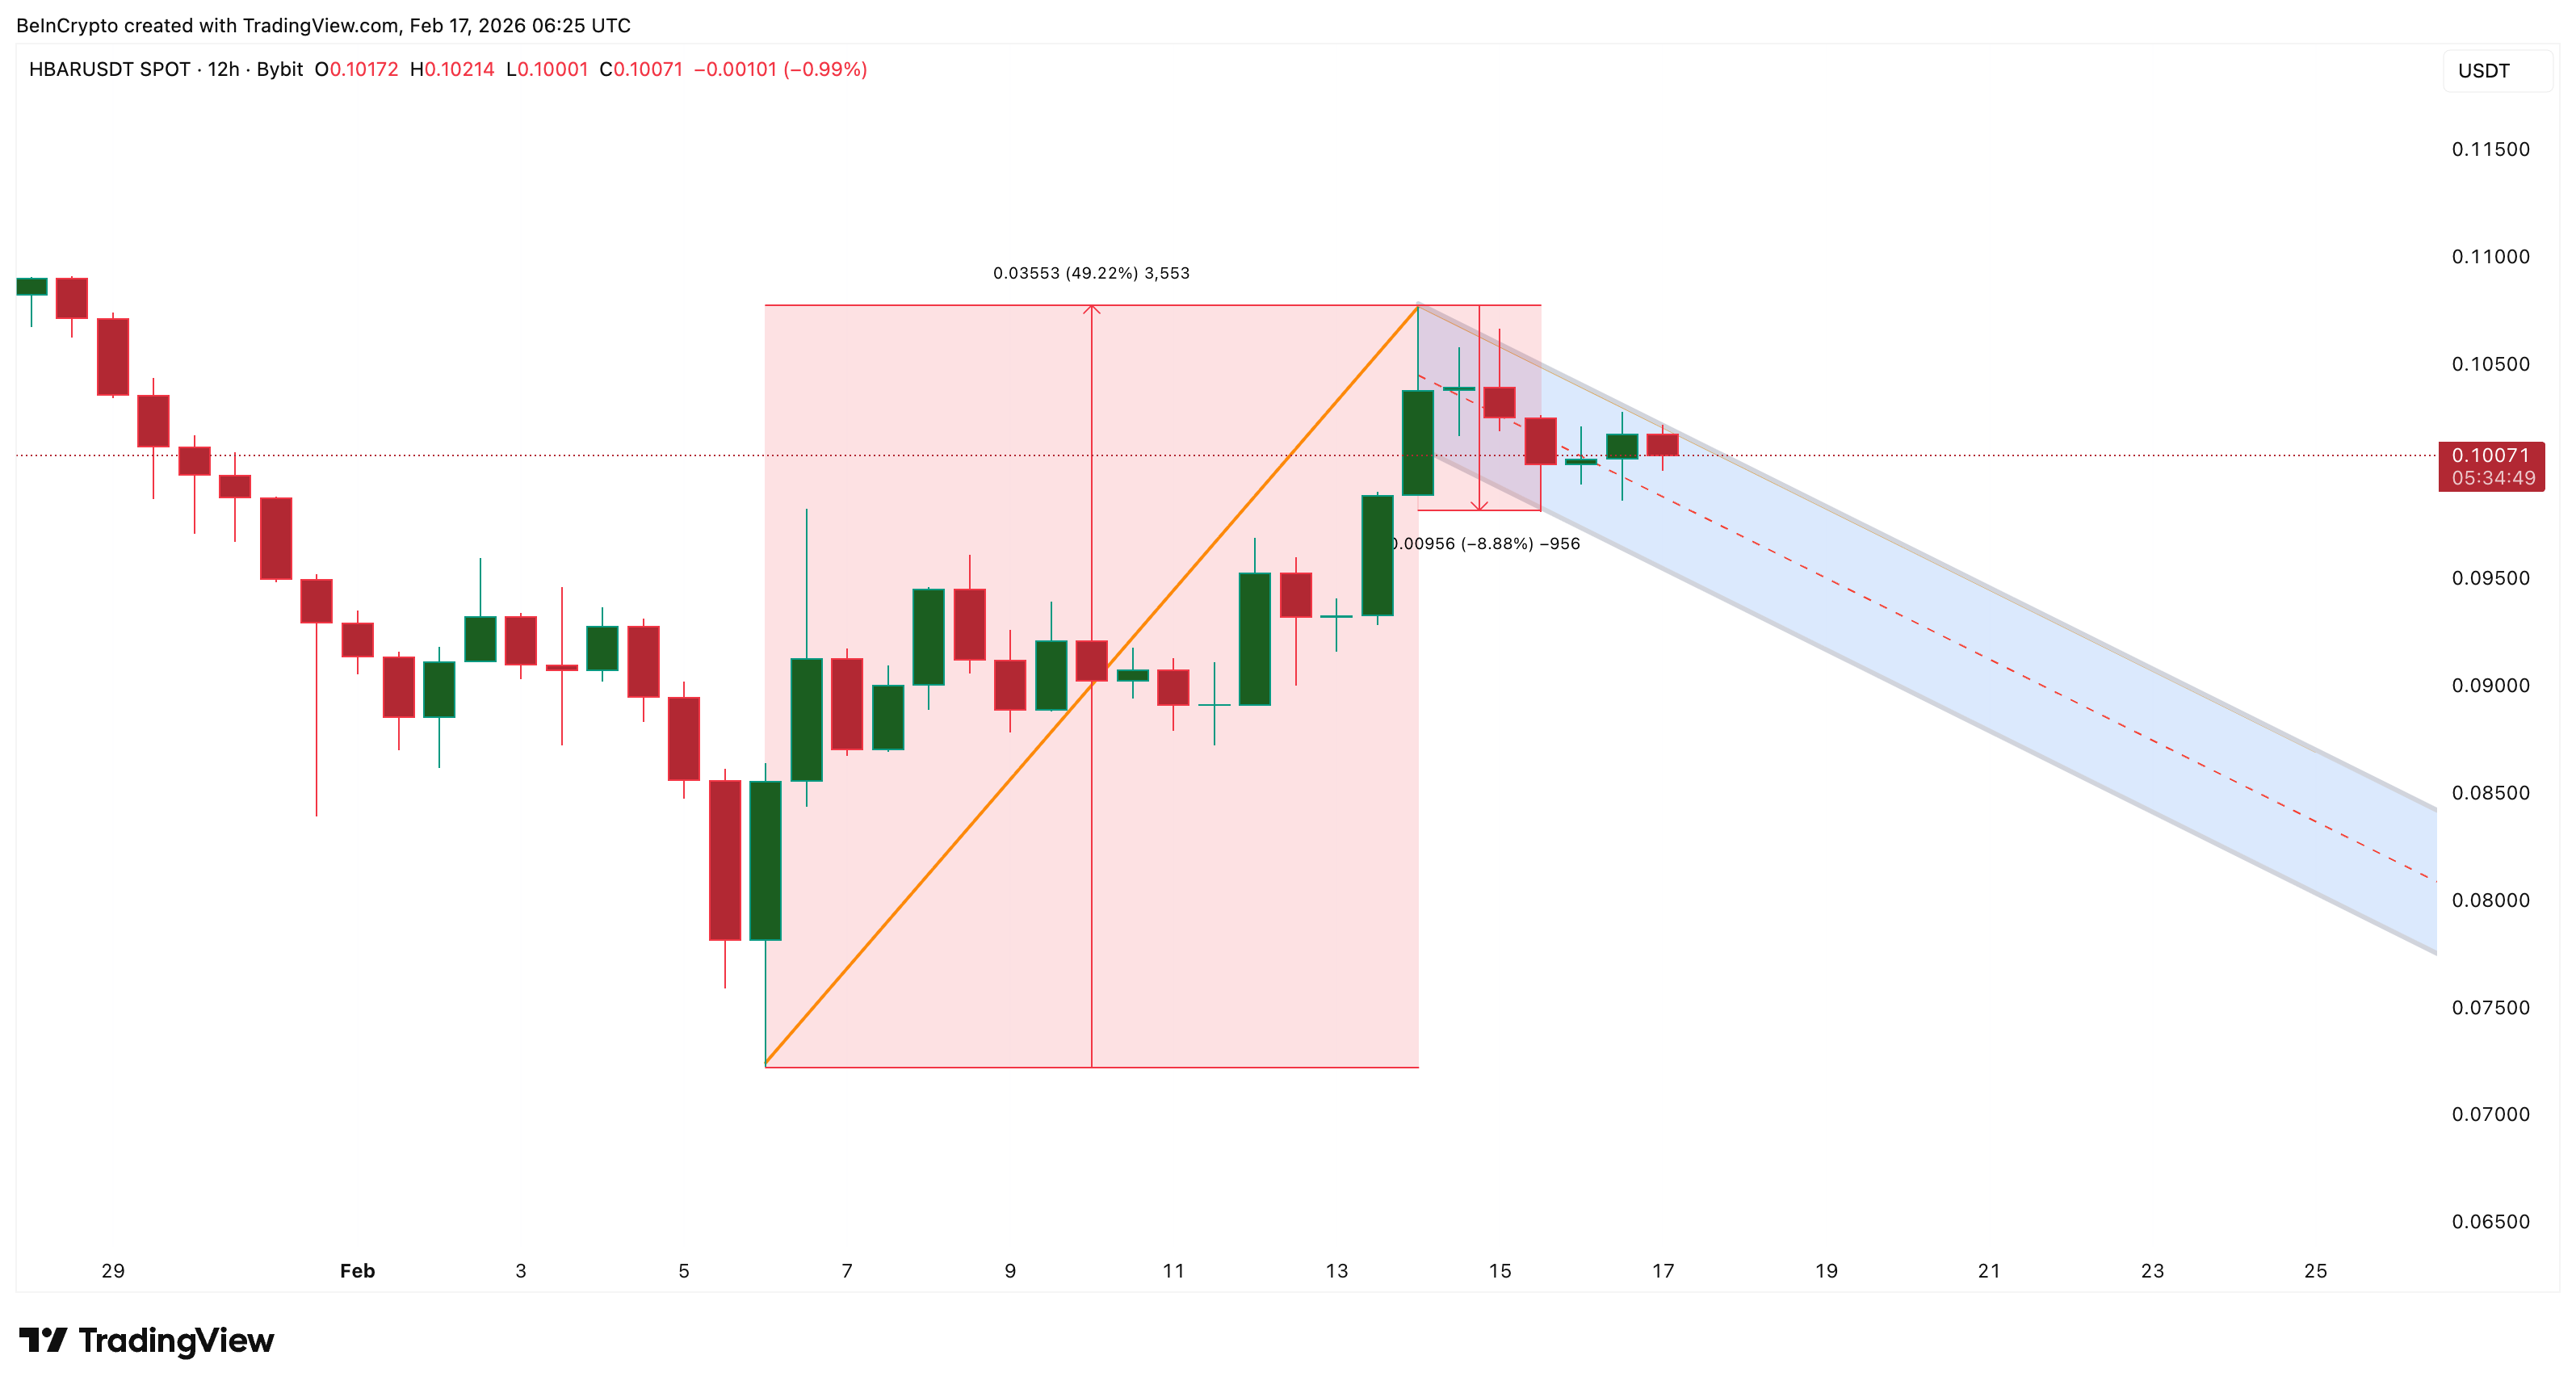 HBAR Holds The Flag: TradingView
This level acts as the breakout trigger. If price moves above this zone, the next leg of the rally could begin. However, a price pattern alone is not enough to confirm a breakout. Momentum and investor behavior must also support the move.
Bullish Divergence and Strong Dip Buying Show Buyers Regaining Control
Momentum indicators show that selling pressure weakened during the pullback. The Relative Strength Index (RSI), a momentum indicator that measures buying and selling strength, formed a bullish divergence.
Between Jan. 25 and Feb. 15, the HBAR price made a lower low (stabilizing near a key support level), meaning the price dropped to a weaker level. But during the same period, RSI made a higher low, which shows sellers were losing strength even as the price declined. This pattern signals that buyers were slowly gaining control.
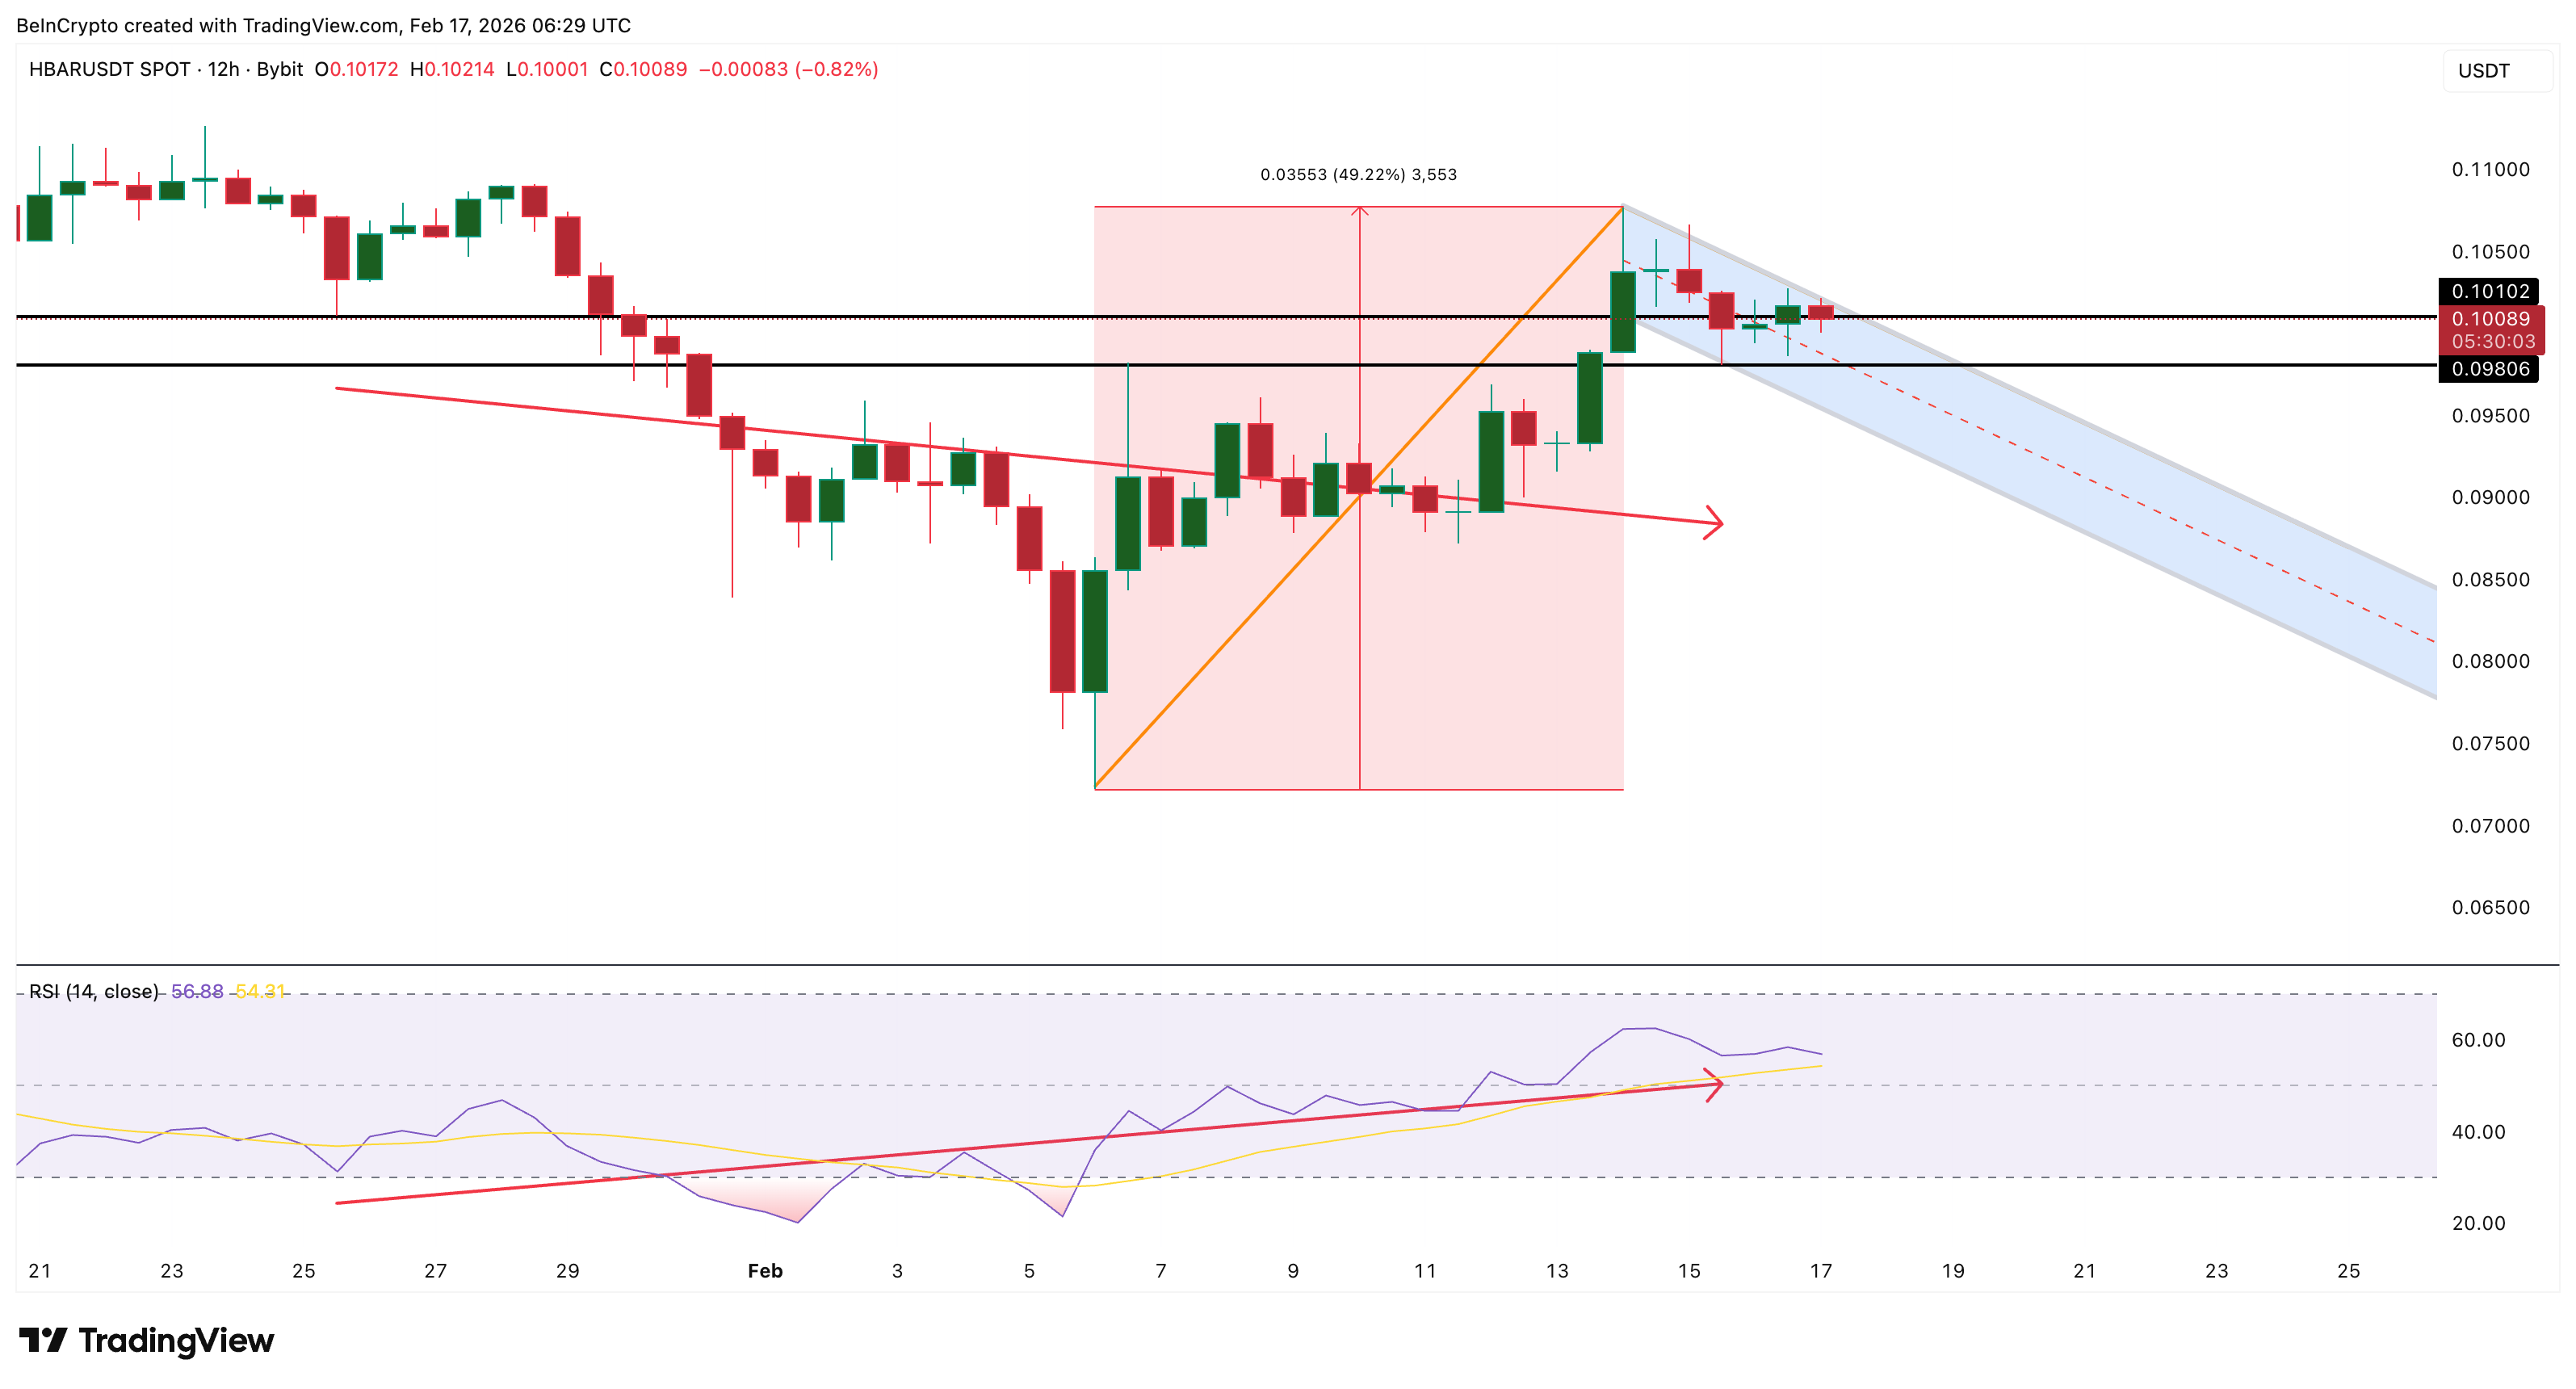 Bullish Divergence: TradingView
This signal appeared as HBAR touched the $0.098 support level, confirming strong buyer presence at this zone.
Exchange flow data supports this trend. Exchange netflow tracks how many coins move into or out of exchanges. When coins leave exchanges, it usually signals accumulation because investors move assets into private wallets instead of preparing to sell.
On Feb. 15, HBAR recorded $2.49 million in exchange outflows, the highest outflow in over a week, when the prices stabilized around $0.098.
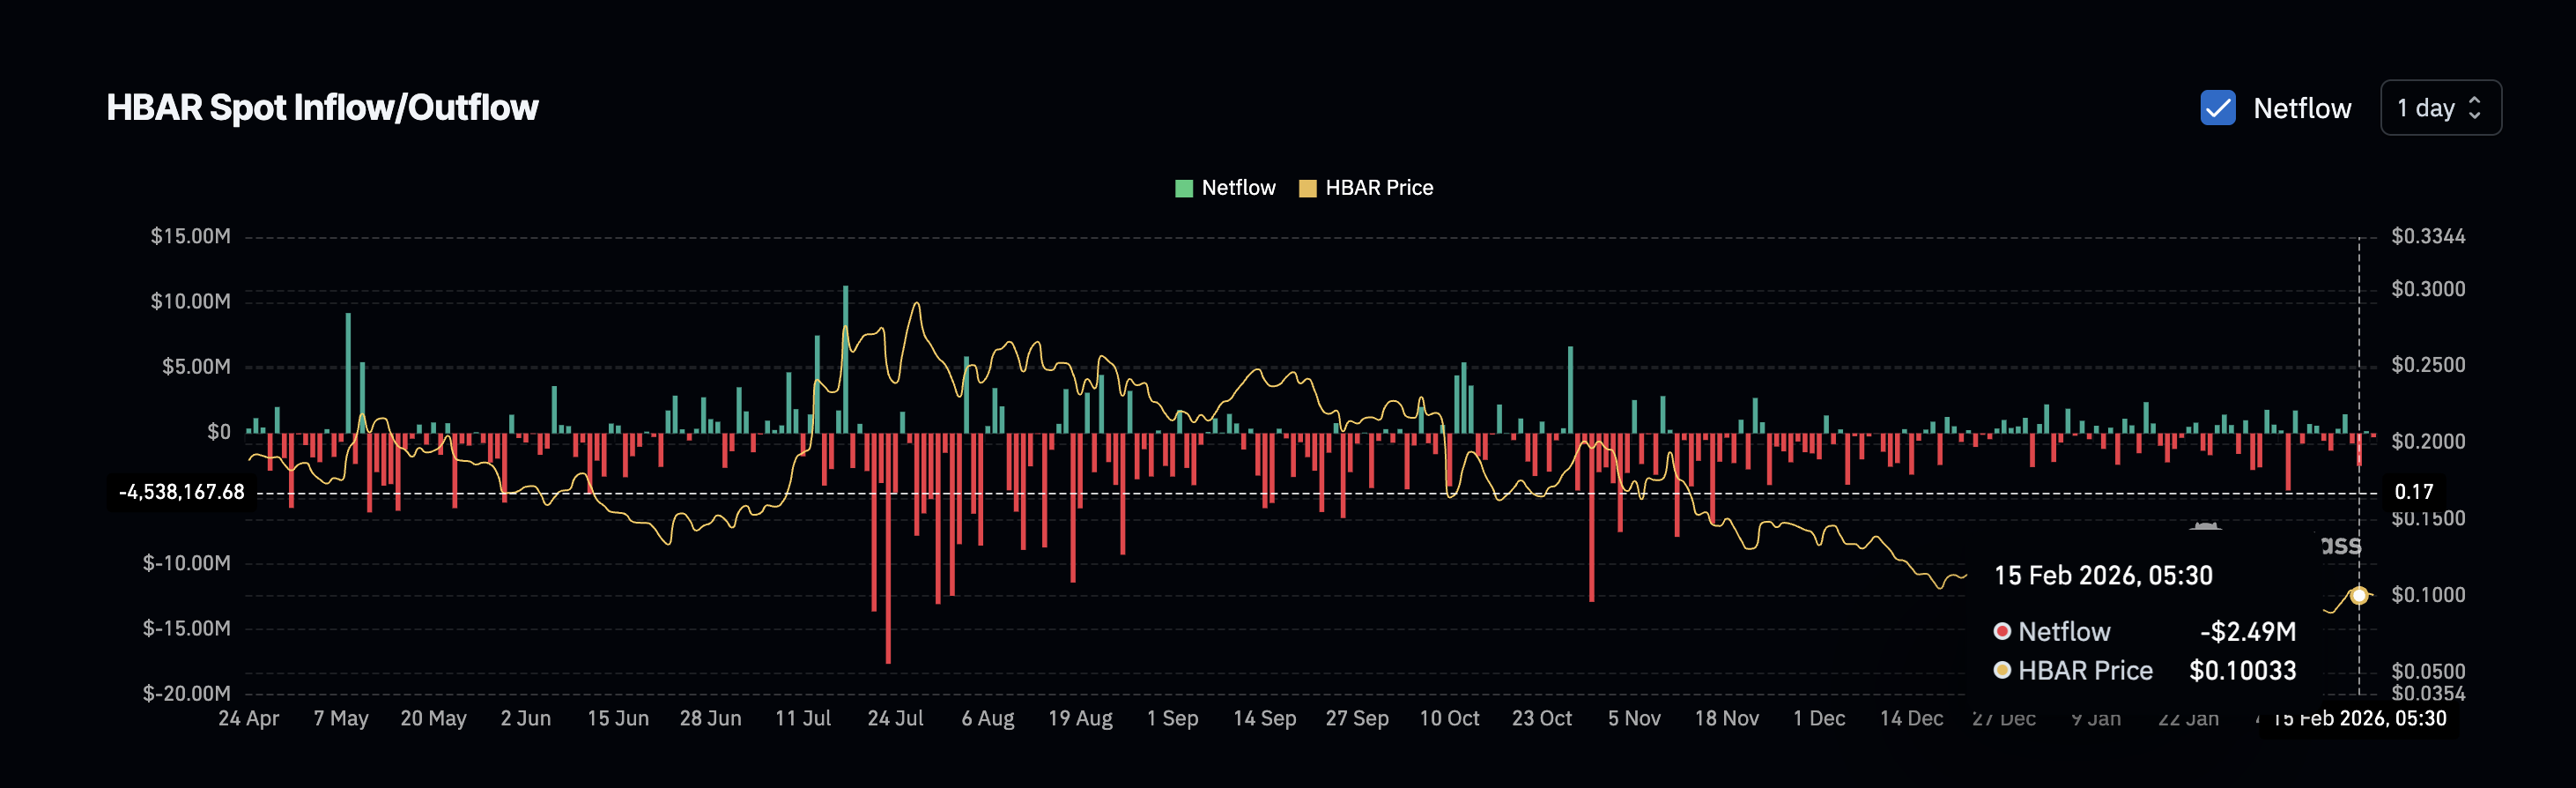 Dip Buyers Come In: Coinglass
This shows investors were possibly buying the dip instead of selling, helping stabilize the price and maintain the breakout structure. With momentum and accumulation now aligning, the final confirmation depends on whether investor strength continues near resistance.
Smart Money and Buyer Strength Remain Intact — Could Trigger a 50% Hedera Price Rally
Other key indicators show that buyers still support the trend. The Bull Bear Power indicator, which measures whether buyers or sellers dominate the market, remained positive during the pullback. This confirms buyers stayed in control despite the correction.
The Smart Money Index also remains above its signal line. This indicator tracks the activity of experienced investors, and when it stays above the signal line, it shows that larger investors remain active and invested.
This continued support becomes critical near breakout levels. The key breakout level now sits at $0.101. If HBAR price breaks above this level with strength, the bull flag pattern could activate and push HBAR price toward $0.150, representing nearly a 50% rally. Key resistance levels to that target sit at $0.120 and $0.133, respectively.
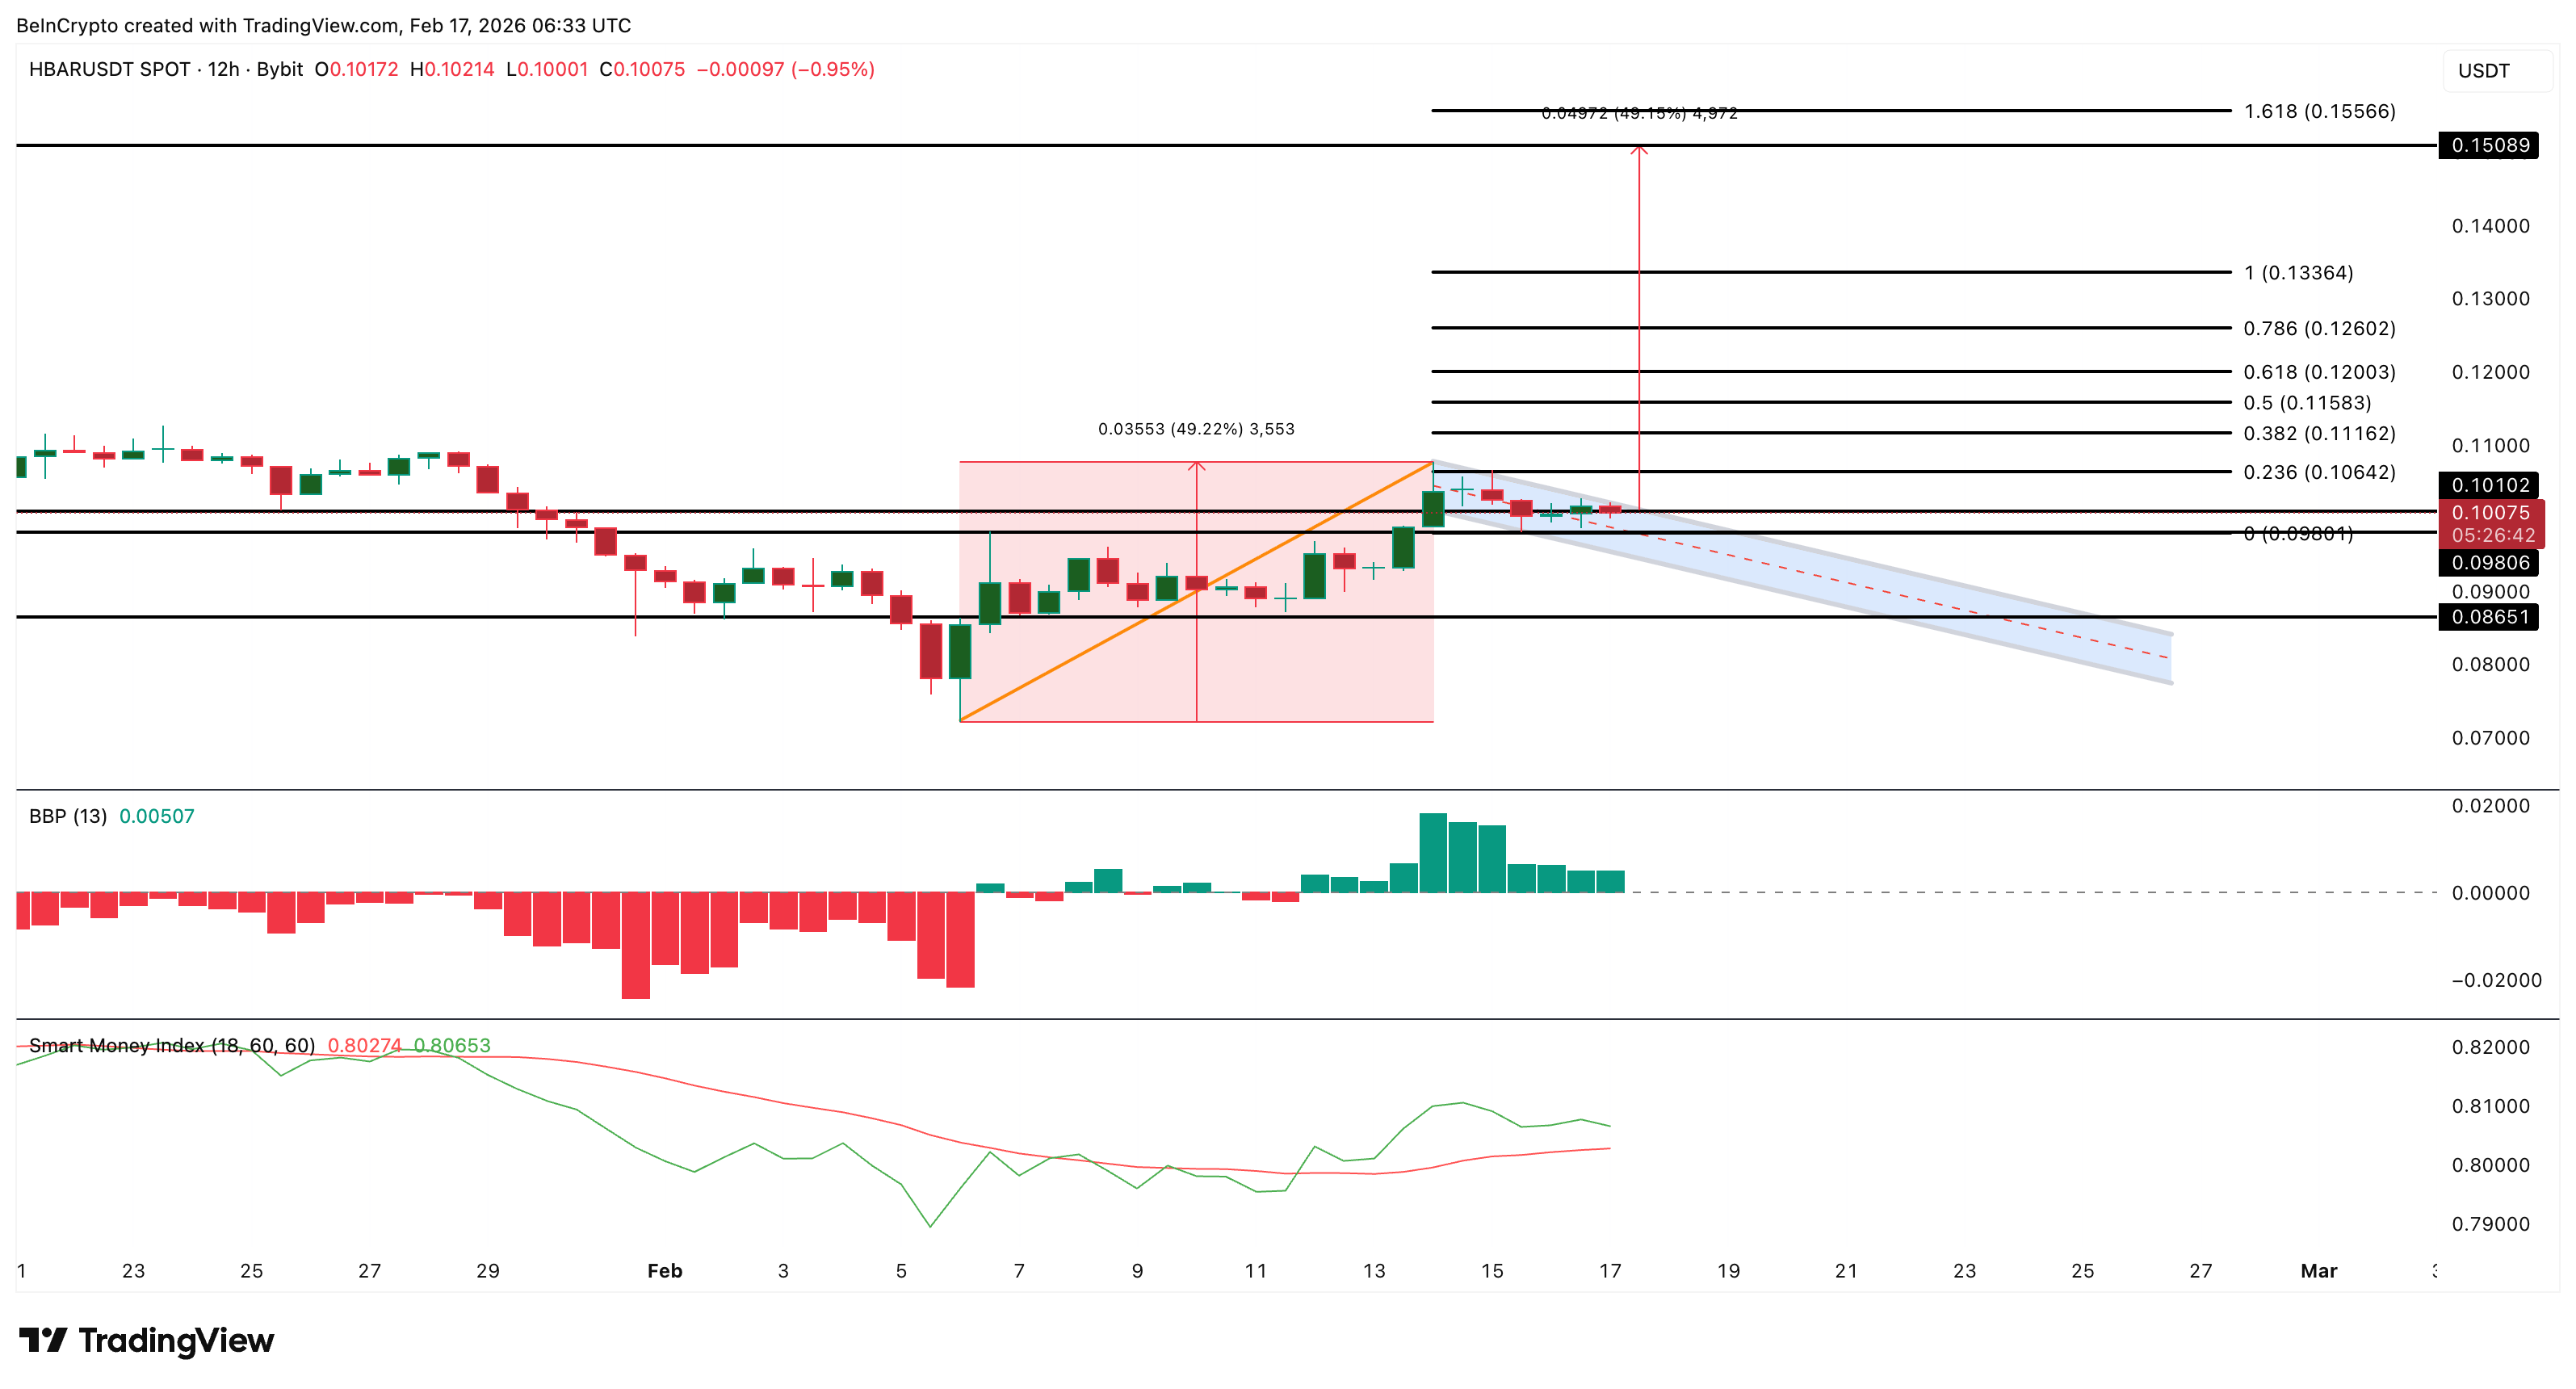 HBAR Price Analysis: TradingView
However, downside risk still exists. If HBAR falls below $0.086, the bull flag pattern would fail and cancel the breakout setup.
For now, Hedera’s pullback appears to be a consolidation phase rather than a reversal. The price structure, momentum signals, and investor activity all suggest the breakout attempt remains active. The next move above resistance will determine whether the Hedera price can complete its 50% rally setup.
Recommended Articles


