


Major Bitcoin LTH Sell-Off Signals Cycle Exhaustion as Supply Drops to 13.6M BTC
Bitcoin has struggled below the $90,000 level since last week and is now attempting to stabilize as selling pressure continues to shape market sentiment. The sharp downturn from the recent cycle high has left bullish traders on the defensive, with confidence weakening across spot and derivatives markets. Analysts who just weeks ago projected continuation toward new all-time highs are now shifting their tone, with many calling for the beginning of a bear market.
The broader market environment has amplified these concerns. Momentum has flipped downward, liquidity has thinned, and buyers have been unable to reclaim key resistance levels that would signal strength. As Bitcoin searches for support, investors are now watching reactions around the high-$80K region to determine whether this decline is part of a deeper structural reversal or a temporary correction within the larger trend.
According to top analyst Axel Adler, Long-Term Holders have played a pivotal role in the current downturn. He reports that this cohort conducted the largest profit-taking event of the entire cycle, reducing positions by 1.57 million BTC over the quarter as prices fell toward $80,000. This scale of distribution historically aligns with exhaustion phases and late-cycle tops, intensifying speculation that Bitcoin may be entering a more prolonged period of weakness.
Long-Term Holder Distribution Signals Major Cycle Shift
Axel Adler highlights that Long-Term Holders (LTH) are conducting massive profit-taking, pushing supply levels back to early 2023 lows. According to his data, the 30-day Net Position Change now reflects one of the deepest sell-offs seen in the entire bull cycle. LTH supply has fallen sharply from the peak of 15.75 million BTC to the current 13.6 million BTC—marking the lowest reading since the beginning of the cycle. Adler notes that this pattern aligns with a classic smart-money distribution phase often observed near major market tops.
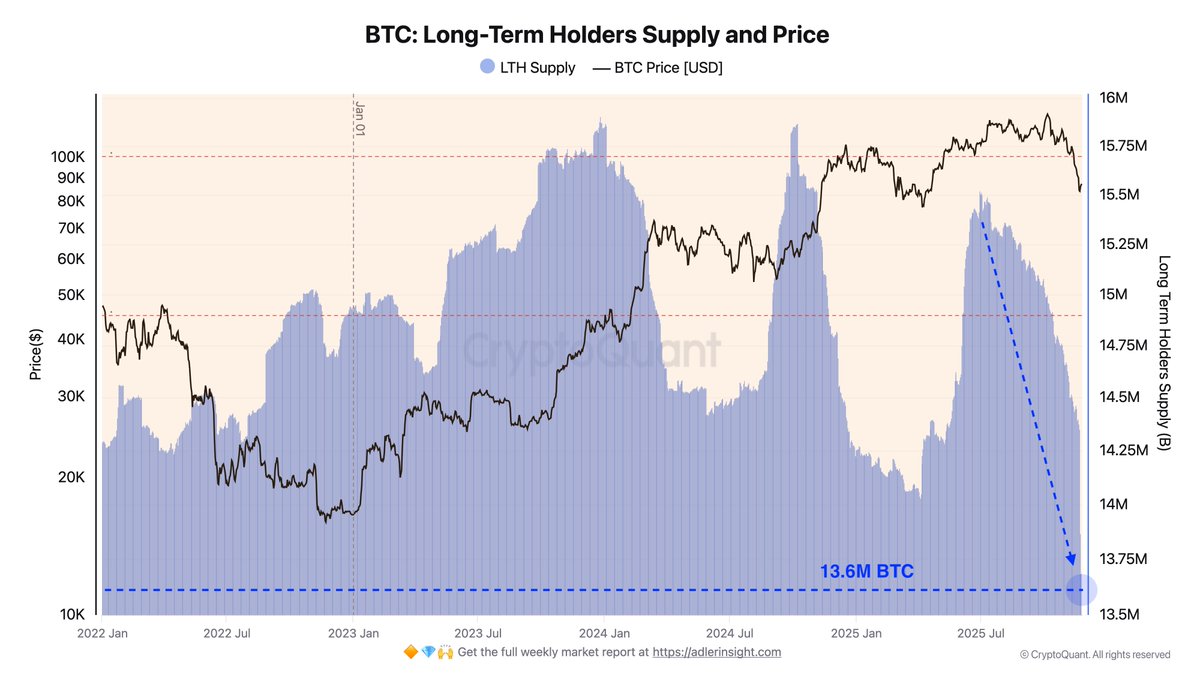
Over just the past two weeks (November 11–25), LTH sold 803,399 BTC, representing a drop of 5.54% and averaging 53,560 BTC per day. Historically, such compression in supply has only occurred during major inflection periods.
Adler compares the current reading to previous extremes—March 2024, following the $73,000 all-time high sell-off, and October 2024, when Bitcoin corrected from the ATH toward $85,000. The present phase demonstrates aggressive coin dumping, with deeply negative red bars on the Net Position Change while price simultaneously declined from the October peak.
This combination of rapid supply reduction and falling price suggests that LTH distribution is exerting meaningful pressure on the market. The data implies that the cycle may be transitioning toward a structurally weaker phase unless new demand re-enters to absorb the sell-side volume.
BTC Attempts Stabilization After Sharp Breakdown
Bitcoin’s price action on the daily chart shows a market struggling to regain footing after a steep decline from the $120K region to a recent low near $80K. The current trading level around $86,800 reflects an attempted relief bounce, yet the broader trend remains clearly bearish.

Price is positioned below the 50-day, 100-day, and 200-day moving averages, all of which are now sloping downward—a structure that typically signals sustained downside momentum. The rejection from the mid-November breakdown zone reinforces the idea that former support has flipped into resistance.
Volume spikes during the selloff indicate forced liquidation and capitulation-driven selling rather than orderly distribution, while the recent bounce has occurred on noticeably lighter volume, suggesting weak conviction from buyers.
For bulls, the key focus is whether Bitcoin can build a base above the $85K region to avoid another wave of selling pressure. Losing this level could expose further downside toward $78K and potentially $72K.
Featured image from ChatGPT, chart from TradingView.com
Recommended Articles


