Litecoin Price Forecast: LTC eyes breakout above $105 as bullish momentum builds

Source Fxstreet
  • Litecoin price hovers around $105 on Tuesday, approaching a key resistance level at $101.4.
  • Rising trading volume, positive funding rates, and large wallet accumulation signal strengthening bullish sentiment.
  • Technical indicators show upward momentum gaining traction, suggesting an upward trend ahead.

Litecoin (LTC) price is showing signs of renewed strength on Tuesday, trading near $105 as bullish momentum builds across the market. On-chain and derivatives data indicate growing investor confidence, with increasing trading volumes, positive funding rates, and accumulation by large holders. The technical outlook supports further gains as momentum indicators are gaining traction.

Litecoin’s on-chain and derivatives data suggest further gains

Santiment data indicate that the Litecoin ecosystem’s trading volume (the aggregate trading volume generated by all exchange applications on the chain) reached $2.03 billion on Sunday, the highest level since mid-October and stands at around $1.46 on Tuesday. This volume rise indicates a surge in traders’ interest and liquidity in Litecoin, boosting its bullish outlook.

Litecoin trading volume chart. Source: Santiment

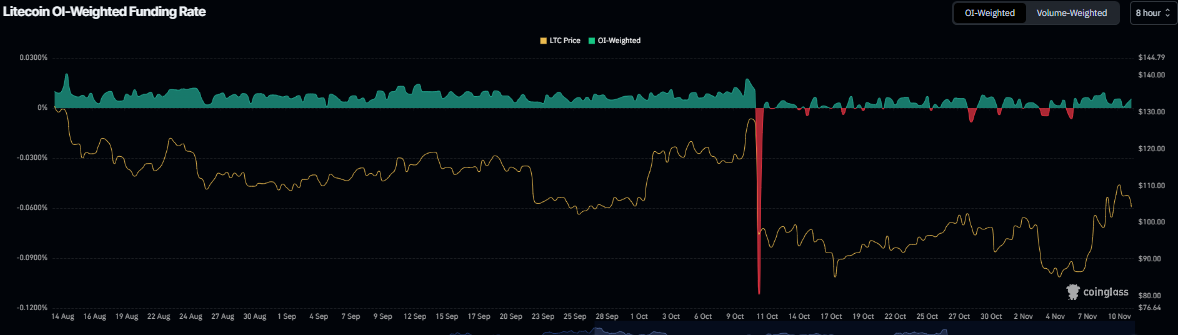
CoinGlass’s OI-Weighted Funding Rate data shows that the number of traders betting that the price of Litecoin will slide further is lower than that anticipating a price increase. The metric has flipped to a positive rate and currently reads 0.0055%, indicating that longs are paying shorts and suggesting bullish sentiment among traders.

Litecoin funding rate chart. Source: Coinglass

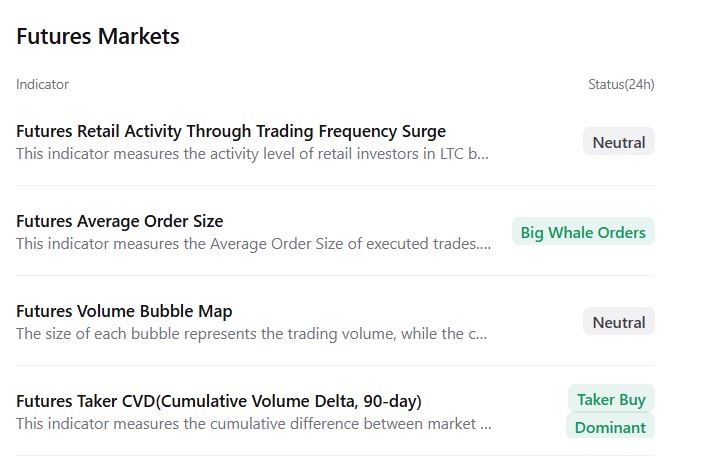
CryptoQuant futures market data suggest a positive outlook, as LTC shows large whale orders and buy dominance, signaling a potential recovery ahead.

Litecoin Price Forecast: LTC momentum indicators gaining traction

Litecoin price surged more than 10% last week, closing above key resistance levels at $96.30 and 50-day EMA at $101.45. At the time of writing on Tuesday, LTC hovers around $105.90, finding support around its 50-day EMA.

If the 50-day EMA at $101.45 continues to hold as support, it could extend the rally toward the October 6 high at $135.99.

The Relative Strength Index (RSI) on the daily chart reads 56, above the neutral level of 50, indicating bullish momentum gaining traction. The Moving Average Convergence Divergence (MACD) showed a bullish crossover last week, which remains intact, suggesting the continuation of an upward trend.

LTC/USDT daily chart 

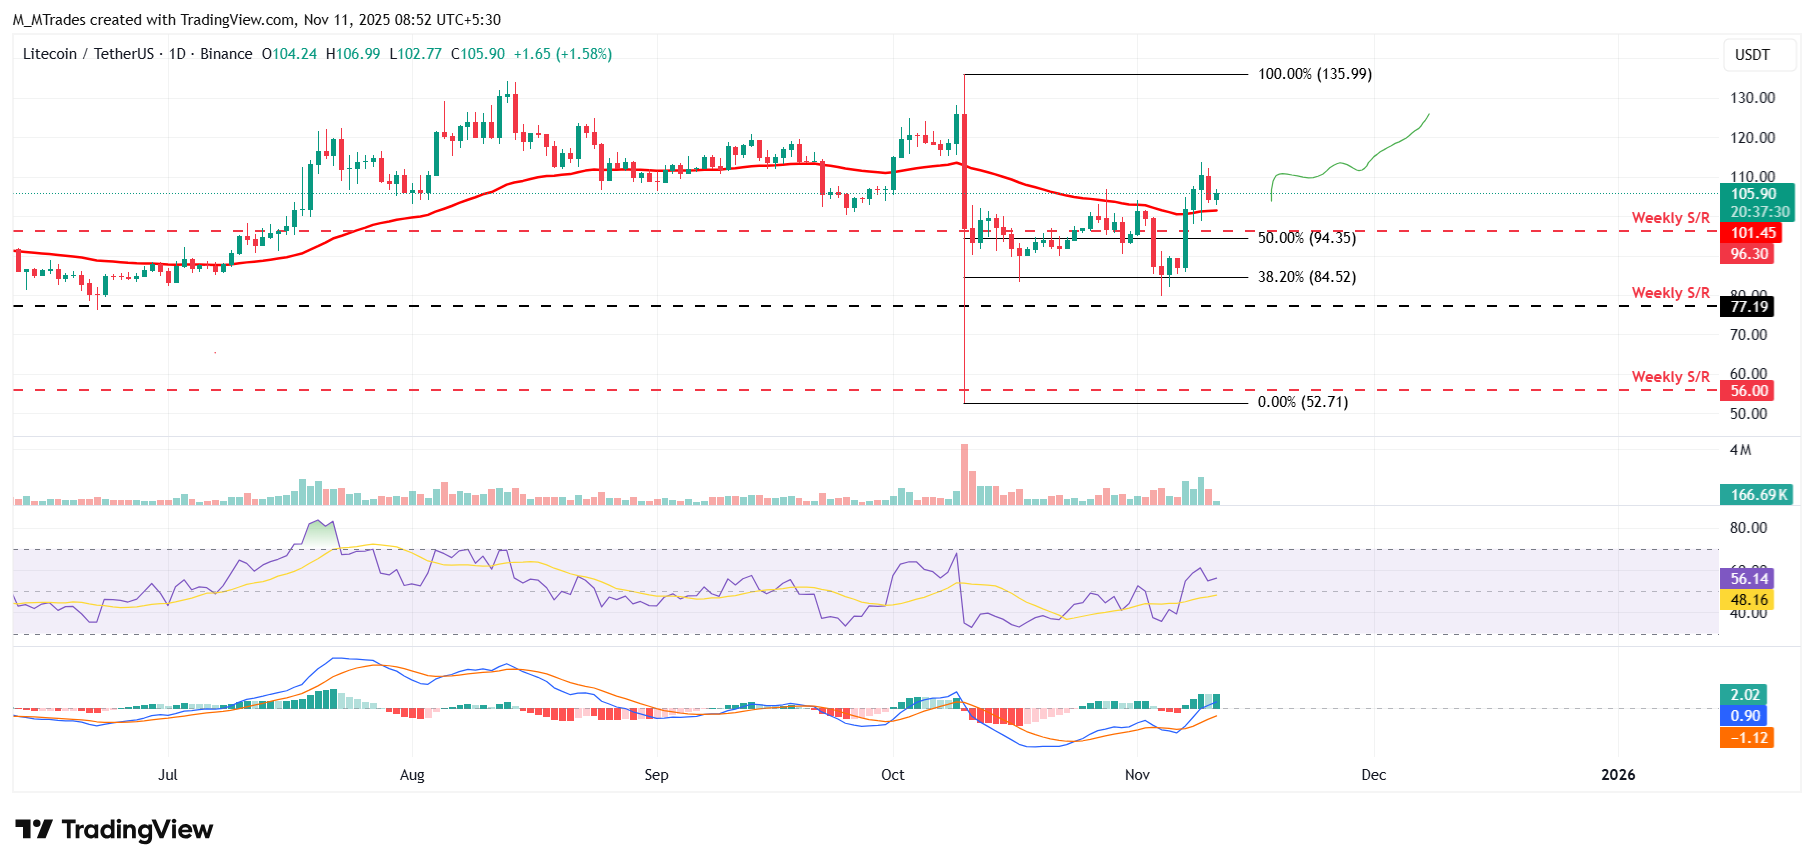
On the other hand, if LTC faces a correction and closes below the 50-day EMA at $101.45, it could extend the decline toward the weekly support at $96.30.

Disclaimer: For information purposes only. Past performance is not indicative of future results.
placeholder
Bitcoin Must Clear This Critical Cost Basis Level For Continued Upside, Analyst SaysIn a recent CryptoQuant Quicktake post, contributor Crazzyblockk highlighted key Bitcoin (BTC) cost basis zones that the leading cryptocurrency must clear – or avoid breaking below – to
Author  NewsBTC
Apr 23, Wed
In a recent CryptoQuant Quicktake post, contributor Crazzyblockk highlighted key Bitcoin (BTC) cost basis zones that the leading cryptocurrency must clear – or avoid breaking below – to
placeholder
Bitcoin Moving With Stocks, But Ethereum’s Correlation Is FadingBitcoin has been showing notable correlation to the stock equities recently, but data shows Ethereum is charting a more independent path. Bitcoin & Ethereum Showing Different Degrees Of
Author  NewsBTC
Jul 10, Thu
Bitcoin has been showing notable correlation to the stock equities recently, but data shows Ethereum is charting a more independent path. Bitcoin & Ethereum Showing Different Degrees Of
placeholder
Philippines' GDP Growth Rises to 5.5% in Second Quarter of 2025The Philippine economy expanded at a marginally faster pace in the second quarter of 2025, with GDP growing 5.5% year-on-year.
Author  Mitrade
Aug 07, Thu
The Philippine economy expanded at a marginally faster pace in the second quarter of 2025, with GDP growing 5.5% year-on-year.
placeholder
OpenAI Introduces Lowest-Cost ChatGPT Subscription in India with UPI Payment OptionOn Tuesday, OpenAI introduced ChatGPT Go, its most affordable AI subscription tier, targeting the price-sensitive Indian market. Nick Turley, OpenAI’s Vice President and Head of ChatGPT, announced the launch via an X post, highlighting that users can pay through India’s Unified Payments Interface (UPI).
Author  Mitrade
Aug 19, Tue
On Tuesday, OpenAI introduced ChatGPT Go, its most affordable AI subscription tier, targeting the price-sensitive Indian market. Nick Turley, OpenAI’s Vice President and Head of ChatGPT, announced the launch via an X post, highlighting that users can pay through India’s Unified Payments Interface (UPI).
placeholder
ANZ Raises Gold Price Forecast to $3,800/Oz, Predicts Rally to Continue Through 2026Gold is expected to continue its upward momentum throughout 2025 and into early 2026, driven by ongoing geopolitical tensions, macroeconomic challenges, and market anticipation of U.S. monetary easing, according to analysts from ANZ in a research note released Wednesday.
Author  Mitrade
Sept 10, Wed
Gold is expected to continue its upward momentum throughout 2025 and into early 2026, driven by ongoing geopolitical tensions, macroeconomic challenges, and market anticipation of U.S. monetary easing, according to analysts from ANZ in a research note released Wednesday.
Related Instrument
goTop
quote