


$100 Oil and $5,000 Gold: Why the Dollar is Preparing for a Historic Breakout This Week
TradingKey - Global markets are on the edge of their seats as we enter a very important trading week. The US Dollar Index (DXY) is sitting pretty at a ten-month high, and WTI Crude Oil has finally hit that all-important $100 level. With this, the whole "inflation trade" is back in the spotlight once again. The ongoing tensions in the Middle East - particularly the blockade of the Strait of Hormuz - are causing supply chains to stutter, and that's bringing a lot of investors to wonder what really constitutes a safe-haven asset in this day and age - specifically in 2024.
This week isn't just about price movements though - there's a bigger shift going on when it comes to global liquidity. The Fed has a critical policy meeting coming up, and the real question is can the world economy really handle a strong Dollar, and $100 oil at the same time.
Whether you're a seasoned pro in the markets or new to this whole thing, the next five trading days will be very telling of what's to come the rest of the second quarter.
Dollar Index Outlook: DXY Bulls Eye $100.50 as Safe-Haven Demand Surges
The US Dollar Index (DXY) is leading the charge in currency markets, steadily trading between 100.25 and 100.35. Following a 3% lift over the past month, the Dollar is getting a boost from two key factors: increased safe-haven demand thanks to the Iran conflict and changing views on what interest rates will do from the Federal Reserve.
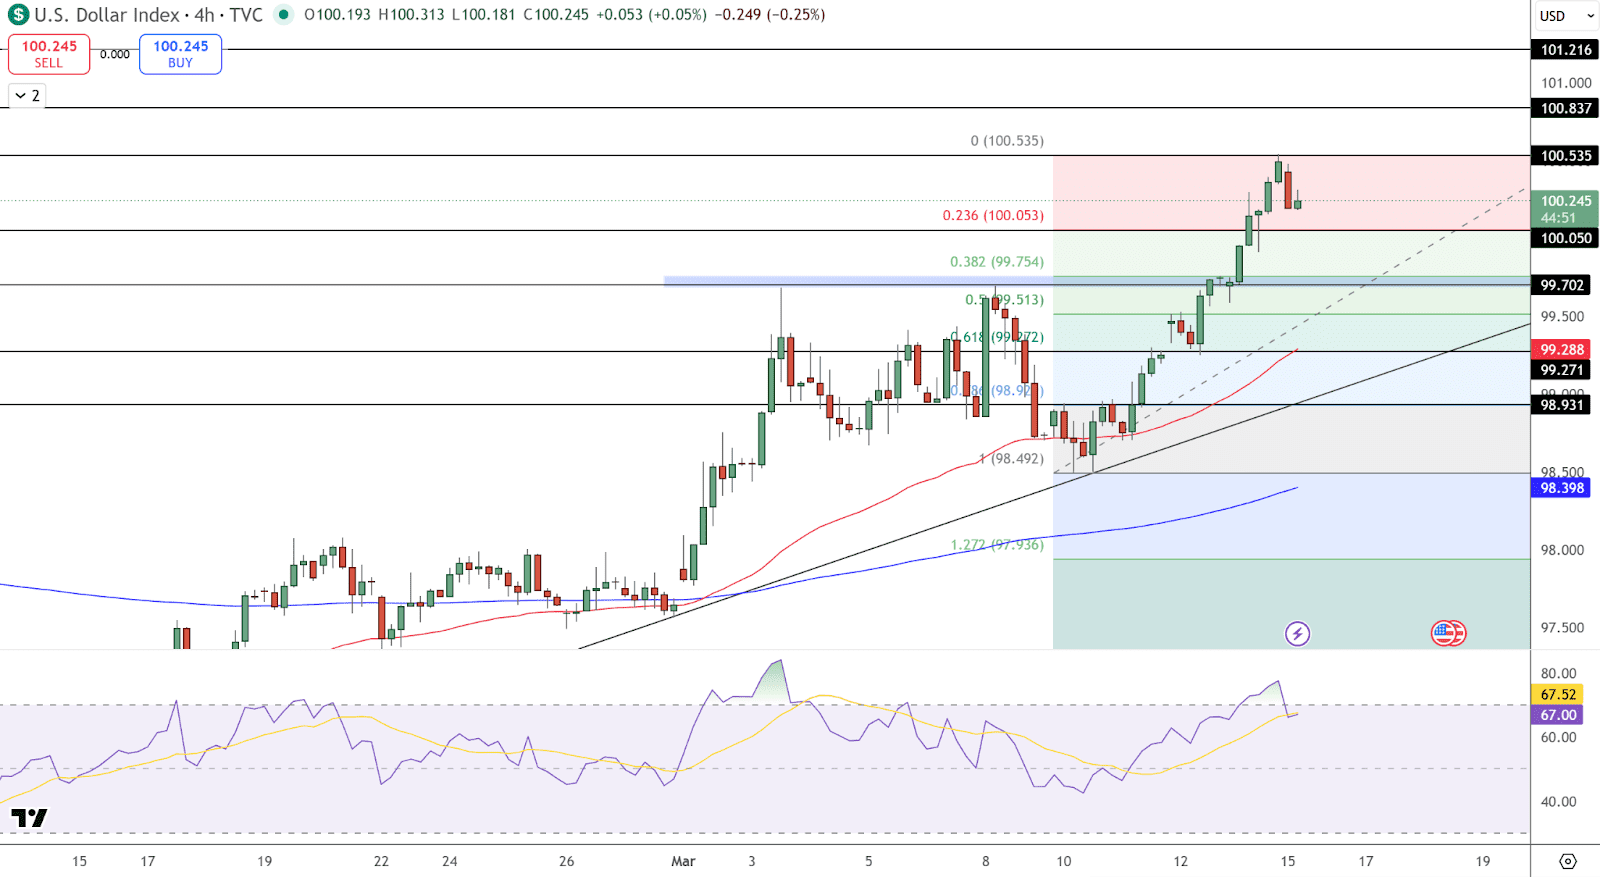
Dollar Index Price Chart - Source: Tradingview
Looking at it from a technical angle, the index has turned the $100.05 Fibonacci level from being a barrier to now serving as a base for further gains. The 4-hour chart shows an upward channel, with the 50-period moving average providing support. If the US inflation data comes in higher than expected, the index could blast right past the $100.53 [high and make a beeline for the resistance level of $100.84.
- The Bull Case: Any further escalation in the Iran conflict is likely to keep investors buying up the Dollar, supporting dips at $100.05 and $99.70.
- The Bear Case: If a diplomatic breakthrough in the Middle East were to occur it would probably trigger a rapid profit-taking move sending prices back down to $99.29.
- Momentum Watch: With RSI at 67, the Dollar is still pretty strong but doesn't look to be exhausting yet, which suggests there is still a lot of "fuel in the tank" to push prices towards new highs.
Trade idea: Buy any dips near $100.05 and look to reach $100.53, with a stop-loss below $99.70.
Gold Price Analysis: The Battle for $5,000 Amidst Geopolitical Chaos
Gold is currently painting a picture of two extremes. On one hand, the metal has already notched up a quite impressive 67% gain year-over-year, trading right at that historic $5,018–$5,038 zone. On the other hand, a resurgent Dollar and high energy costs are starting to weigh on the yellow metal's momentum, and all this has resulted in a two week losing streak as the market tries to process the massive gains it saw when it hit $5,600 earlier this year.
Looking at the technicals, gold is forming a descending triangle - a pattern that often comes just before a sharp move. As such gold is now very close to the 200-period moving average at $5,038, which has changed from being a support to now acting as a resistance. If buyers can't push gold above this level anytime soon there is a pretty good chance of a drop to the next demand zone.
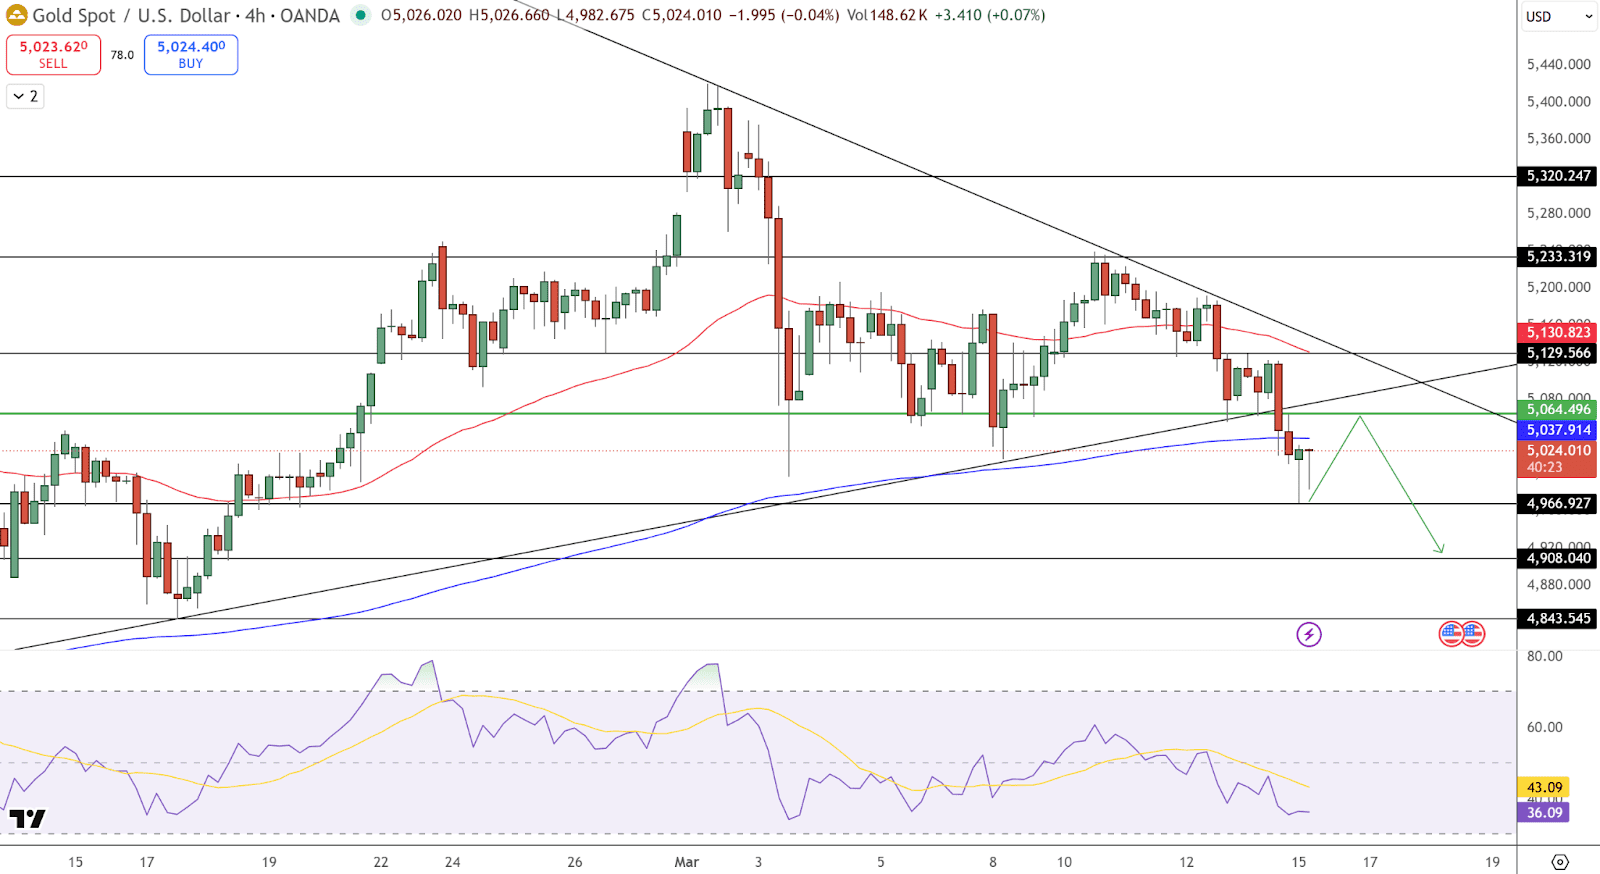
Gold (XAU/USD) Price Chart - Source: Tradingview
- Key Resistance: Sellers are defending the $5,037 and $5,129 levels aggressively.
- Key Support: Watch the $4,966 level closely; a break here opens the door to $4,908.
Fear Premium: Even though gold looks weak technically - the risk of US strikes on energy hubs means buyers are very likely to step in whenever prices fall.
Trade idea: Sell any rallies near $5,035 , targeting $4,966, with a stop-loss above $5,129.
WTI Crude Oil: Will the Strait of Hormuz Blockade Push Prices to $110?
Crude oil is the main driver of global market volatility right now - WTI futures are currently trading between $98 and $100 per barrel and recently did break above $102, a level not seen in years. The Strait of Hormuz is responsible for 20% of global oil shipments, and its closure is taking millions of barrels out of daily supply.
From a structural standpoint oil is in a recovery phase after a deep correction from the $119 peak. Buyers have stepped in at the $87 demand zone, and that's created a series of higher lows that point to a retest of the $103.24 Fibonacci level. If coalition efforts to reopen the shipping routes fail, many are expecting a rapid ascent towards $110.40.
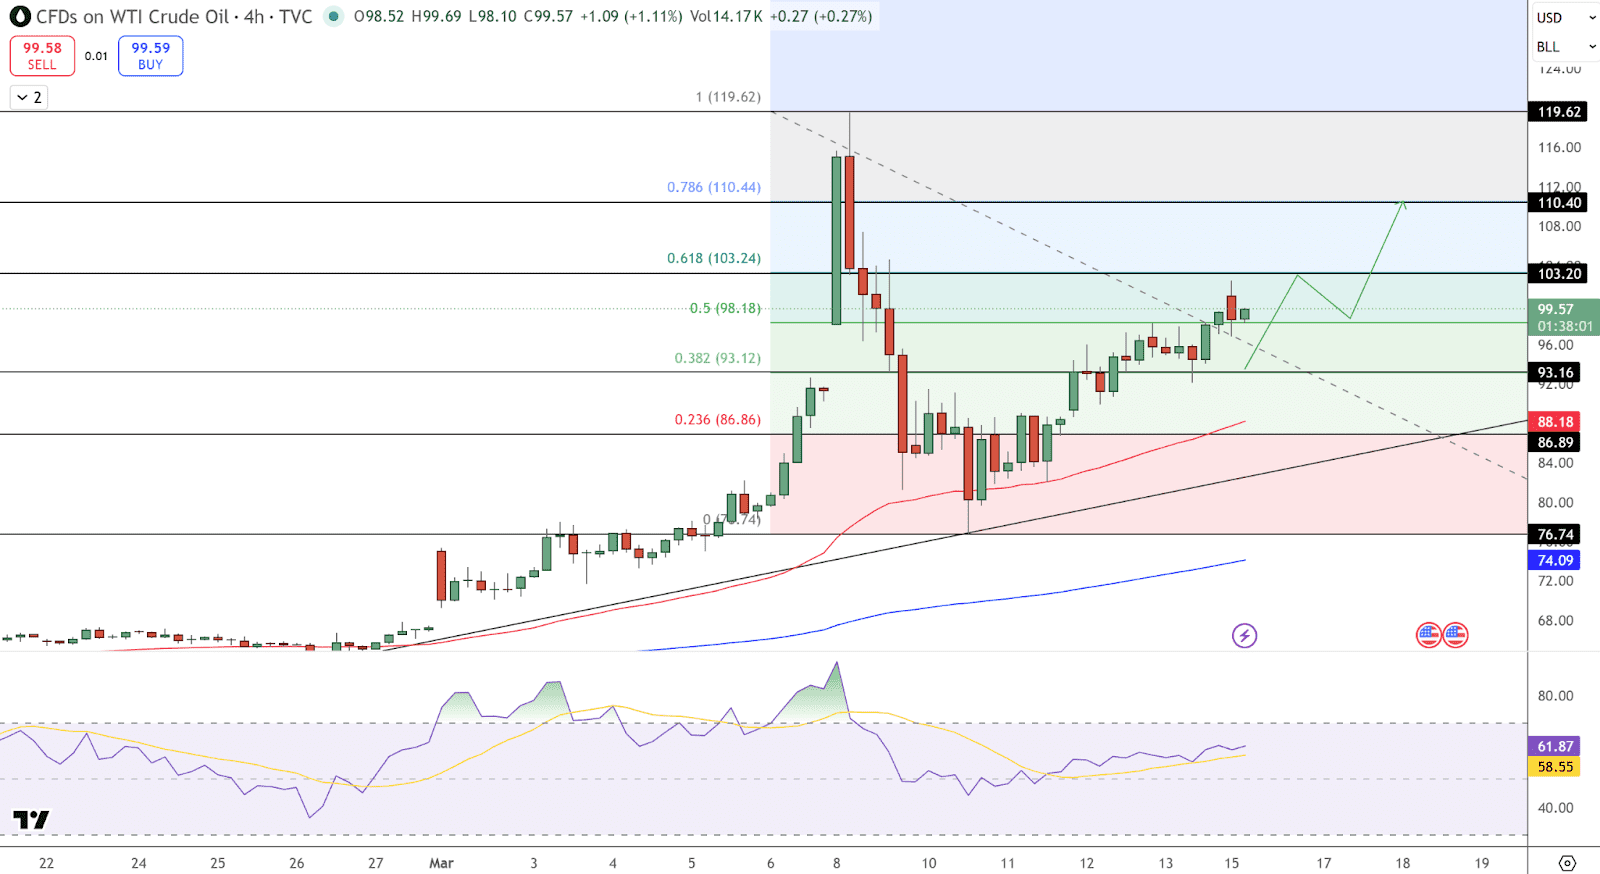
Crude Oil (USOIL) Price Chart - Source: Tradingview
Support Levels: Strong buying interest remains at $93.12 and $88.18.
Resistance Levels: The immediate hurdles are $103.24 and the psychological $110.00 mark.
Supply Dynamics: Record reserve releases are currently the only thing preventing a vertical spike, but these reserves are finite, creating a ticking clock for energy markets.
Trade idea: Buy dips near $96–$97, targeting $103.24, with risk below $93.12.
The Big Picture: Why the Triple Threat Matters for Your Portfolio
Right now, the Dollar, Gold and Oil are all moving in response to one and the same geopolitical event. In theory, at least, when the Dollar goes up, you'd expect commodities to suffer. But this time around, the scale of the conflict has totally thrown that script out the window. Come 2026, 'Risk-Off' isn't just about buying bonds - it's now a whole lot more complicated. You need to think about protecting your portfolio in a world where energy is a luxury and the Dollar stands out as the most trustworthy currency around.
Looking ahead to the coming week, keep a close eye on the $100.53 level for the DXY and $5,038 for Gold. If these key markers hold, then maybe, just maybe, we can crack down on this volatility and get back to some semblance of calm. With all this uncertainty flying around, size and risk management are going to be more important than ever.
Recommended Articles


