


USD/JPY Price Forecast: Approaches 160.00 on Yen’s continued underperformance
- USD/JPY refreshes a one-and-a-half-year high near 159.45 amid weakness in the Japanese Yen.
- Japan PM Takaichi could unveil her intentions to dissolve parliament’s lower house on Wednesday.
- The US Dollar gains after the release of steady US inflation data for December.
The USD/JPY pair posts a fresh one-and-a-half-year high near 159.45 during the early European trading session on Wednesday. The pair strengthens as the Japanese Yen (JPY) continues to underperform across the board amid political uncertainty in Japan.
Japanese Yen Price This week
The table below shows the percentage change of Japanese Yen (JPY) against listed major currencies this week. Japanese Yen was the weakest against the British Pound.
| USD | EUR | GBP | JPY | CAD | AUD | NZD | CHF | |
|---|---|---|---|---|---|---|---|---|
| USD | -0.08% | -0.28% | 0.73% | -0.21% | -0.20% | -0.21% | 0.08% | |
| EUR | 0.08% | -0.20% | 0.87% | -0.12% | -0.11% | -0.12% | 0.16% | |
| GBP | 0.28% | 0.20% | 1.07% | 0.08% | 0.09% | 0.07% | 0.36% | |
| JPY | -0.73% | -0.87% | -1.07% | -0.97% | -0.96% | -0.97% | -0.68% | |
| CAD | 0.21% | 0.12% | -0.08% | 0.97% | -0.01% | -0.00% | 0.29% | |
| AUD | 0.20% | 0.11% | -0.09% | 0.96% | 0.00% | -0.01% | 0.27% | |
| NZD | 0.21% | 0.12% | -0.07% | 0.97% | 0.00% | 0.01% | 0.27% | |
| CHF | -0.08% | -0.16% | -0.36% | 0.68% | -0.29% | -0.27% | -0.27% |
The heat map shows percentage changes of major currencies against each other. The base currency is picked from the left column, while the quote currency is picked from the top row. For example, if you pick the Japanese Yen from the left column and move along the horizontal line to the US Dollar, the percentage change displayed in the box will represent JPY (base)/USD (quote).
Concerns over Japan’s political outlook stemmed after reports stating that Prime Minister Sanae Takaichi could call an early snap election. According to Japan’s regional news outlet Nikkei, Takaichi is to inform her intent to dissolve parliament on Wednesday, a precursor to the onset of new elections.
Additionally, hopes of a looser monetary and fiscal policy this year are constantly keeping the Japanese Yen on the back foot.
Meanwhile, strength in the US Dollar (USD) is also acting as a tailwind for the pair. The US Dollar Index (DXY) trades close to its monthly high near 99.25 as speculation for the Federal Reserve (Fed) holding interest rates steady remains intact, following the release of the United States (US) inflation data for December. The data showed that the US headline and core Consumer Price Index (CPI) rose steadily at an annualized pace of 2.7% and 2.6%, respectively.
USD/JPY technical analysis
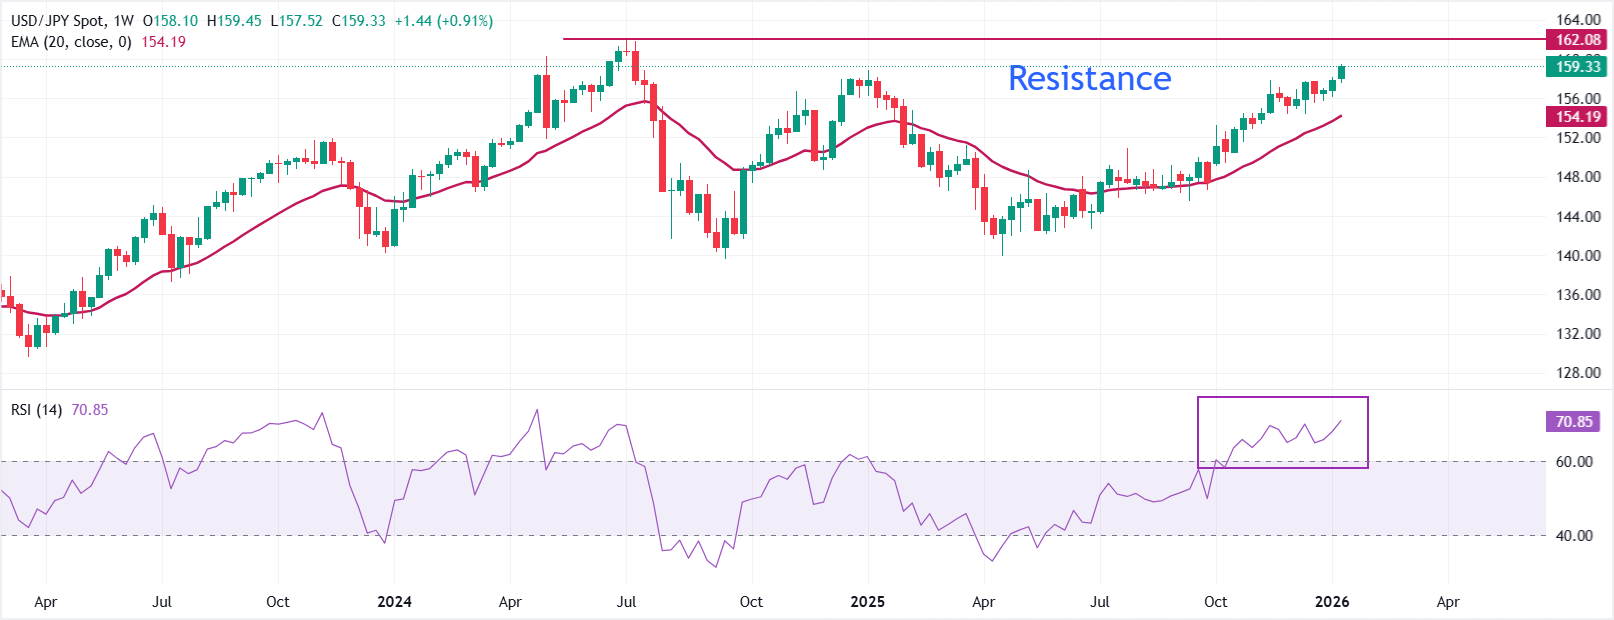
USD/JPY trades higher to near 159.33 at the time of writing. Price holds well above a rising 20-week Exponential Moving Average (EMA) at 154.19, underscoring a strong bullish trend.
The 14-week Relative Strength Index (RSI) at 70.85 (overbought) flags stretched momentum and heightens the risk of a pause.
With momentum stretched, further gains could slow, and consolidation could emerge. A dip would be expected to find support at 154.19, the 20-week EMA, while trend bias remains positive above that gauge.
(The technical analysis of this story was written with the help of an AI tool.)
Economic Indicator
Consumer Price Index (YoY)
Inflationary or deflationary tendencies are measured by periodically summing the prices of a basket of representative goods and services and presenting the data as The Consumer Price Index (CPI). CPI data is compiled on a monthly basis and released by the US Department of Labor Statistics. The YoY reading compares the prices of goods in the reference month to the same month a year earlier.The CPI is a key indicator to measure inflation and changes in purchasing trends. Generally speaking, a high reading is seen as bullish for the US Dollar (USD), while a low reading is seen as bearish.
Read more.Last release: Tue Jan 13, 2026 13:30
Frequency: Monthly
Actual: 2.7%
Consensus: 2.7%
Previous: 2.7%
Source: US Bureau of Labor Statistics
The US Federal Reserve (Fed) has a dual mandate of maintaining price stability and maximum employment. According to such mandate, inflation should be at around 2% YoY and has become the weakest pillar of the central bank’s directive ever since the world suffered a pandemic, which extends to these days. Price pressures keep rising amid supply-chain issues and bottlenecks, with the Consumer Price Index (CPI) hanging at multi-decade highs. The Fed has already taken measures to tame inflation and is expected to maintain an aggressive stance in the foreseeable future.
Recommended Articles


