


GBP/USD shrugs off strong labor data as traders stay committed to Fed easing
- GBP/USD rises as traders shrug off stronger jobless claims and continue pricing over 85% odds of Fed easing.
- US labor data remains mixed, with falling claims but rising layoffs reinforcing expectations of cooling momentum.
- Sterling steadies after Autumn Budget as economists say measures won’t impede BoE’s expected December cut.
Sterling rises during the North American session even though US jobs data suggests that the labor market remains solid but expectations that the Federal Reserve will cut rates, remained higher. At the time of writing, the GBP/USD trades at 1.3367, up 0.12%.
Sterling edges higher as markets look past solid US jobs data and maintain expectations for a December Fed rate cut
Recently, US economic data revealed that the number of Americans filling for unemployment benefits, dipped below economists estimates, for the week ending November 29. Initial Jobless Claims came at 191,000, below estimates of 220,000 and a decrease from last week upward revised figures from 216,000 to 218,000.
Continuing Claims for the week ending November 22 was 1.939 million, down from the previous week’s 1.96 million.
Meanwhile, the Challenger Job report revealed that employers announced 71,321 job cuts in November, up 24% when compared to last year’s figures, down 53% from the print announced in October this year.
Consequently, market participants are still seeing an over 85% chance of a rate cut at the Federal Reserve’s December 9-10 meeting, following Wednesday's dismal ADP Employment Change data.
Cable rebounded as markets digested the Autumn Budget. Some economists cited by Reuters revealed that the budget measures were unlikely to cause a jump in inflation, allowing the Bank of England (BoE) to resume its easing cycle.
The swaps market is pricing in a 90% chance of a rate cut when the central bank meets later this month.
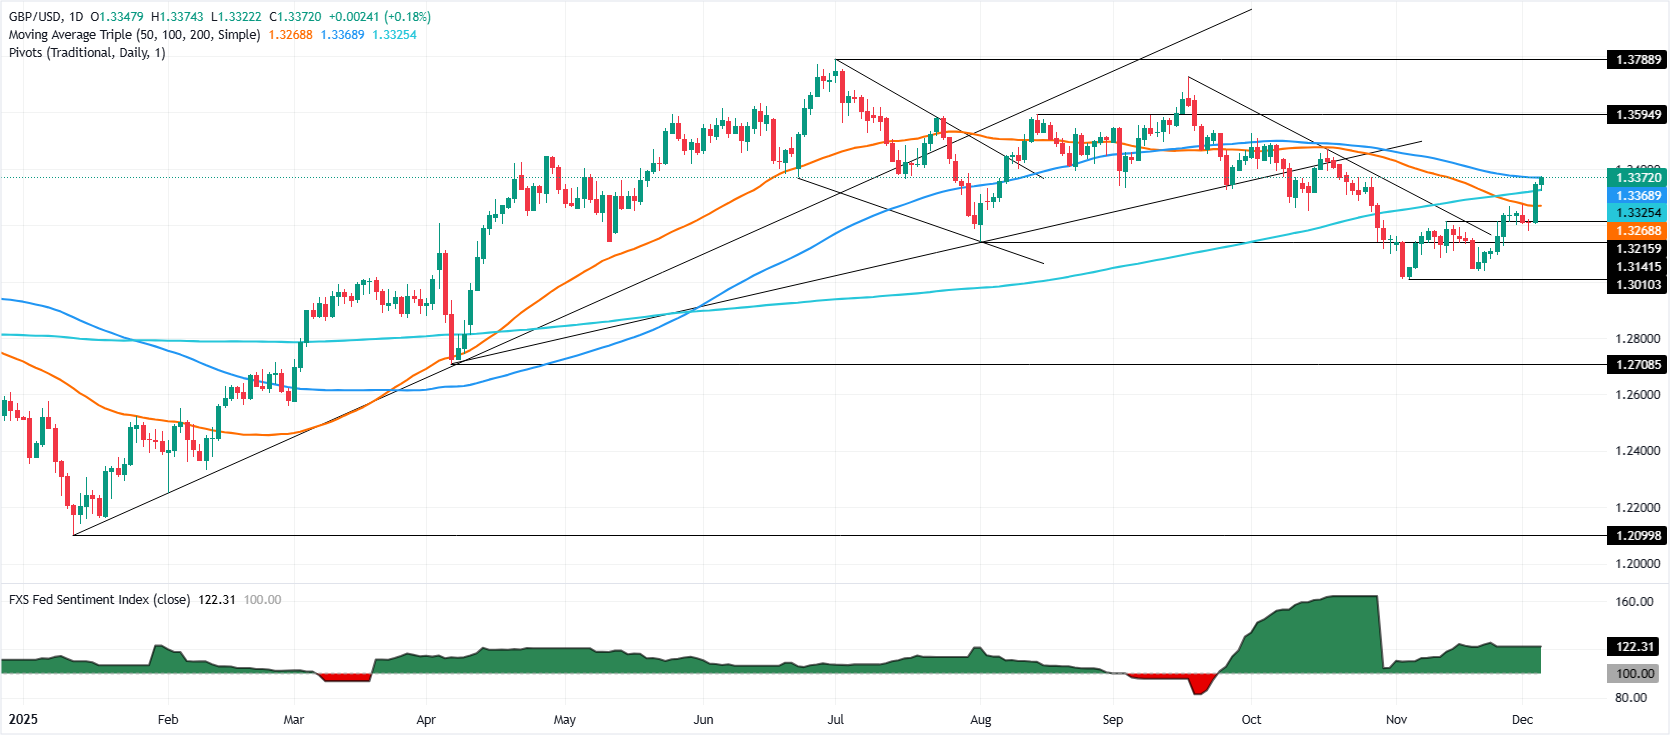
GBP/USD Price Forecast: Technical outlook
The GBP/USD resumed its uptrend with the exchange rate clearing the 100-day SMA at 1.3369 opening the door to challenge 1.3400. A daily close above the latter, and the Pound could extend its gains toward 1.3450 and the 1.3500 figure.
Conversely, a drop below the 100- and below the 200-day SMA at 1.3322 could expose the 1.3300 milestone. Once breached the next support would be the 50-day SMA at 1.3266.
Pound Sterling Price This week
The table below shows the percentage change of British Pound (GBP) against listed major currencies this week. British Pound was the strongest against the US Dollar.
| USD | EUR | GBP | JPY | CAD | AUD | NZD | CHF | |
|---|---|---|---|---|---|---|---|---|
| USD | -0.61% | -1.03% | -0.88% | -0.27% | -1.09% | -0.74% | -0.35% | |
| EUR | 0.61% | -0.41% | -0.29% | 0.34% | -0.48% | -0.11% | 0.26% | |
| GBP | 1.03% | 0.41% | 0.39% | 0.75% | -0.07% | 0.28% | 0.68% | |
| JPY | 0.88% | 0.29% | -0.39% | 0.61% | -0.21% | 0.15% | 0.54% | |
| CAD | 0.27% | -0.34% | -0.75% | -0.61% | -0.86% | -0.46% | -0.07% | |
| AUD | 1.09% | 0.48% | 0.07% | 0.21% | 0.86% | 0.35% | 0.75% | |
| NZD | 0.74% | 0.11% | -0.28% | -0.15% | 0.46% | -0.35% | 0.39% | |
| CHF | 0.35% | -0.26% | -0.68% | -0.54% | 0.07% | -0.75% | -0.39% |
The heat map shows percentage changes of major currencies against each other. The base currency is picked from the left column, while the quote currency is picked from the top row. For example, if you pick the British Pound from the left column and move along the horizontal line to the US Dollar, the percentage change displayed in the box will represent GBP (base)/USD (quote).
Recommended Articles


