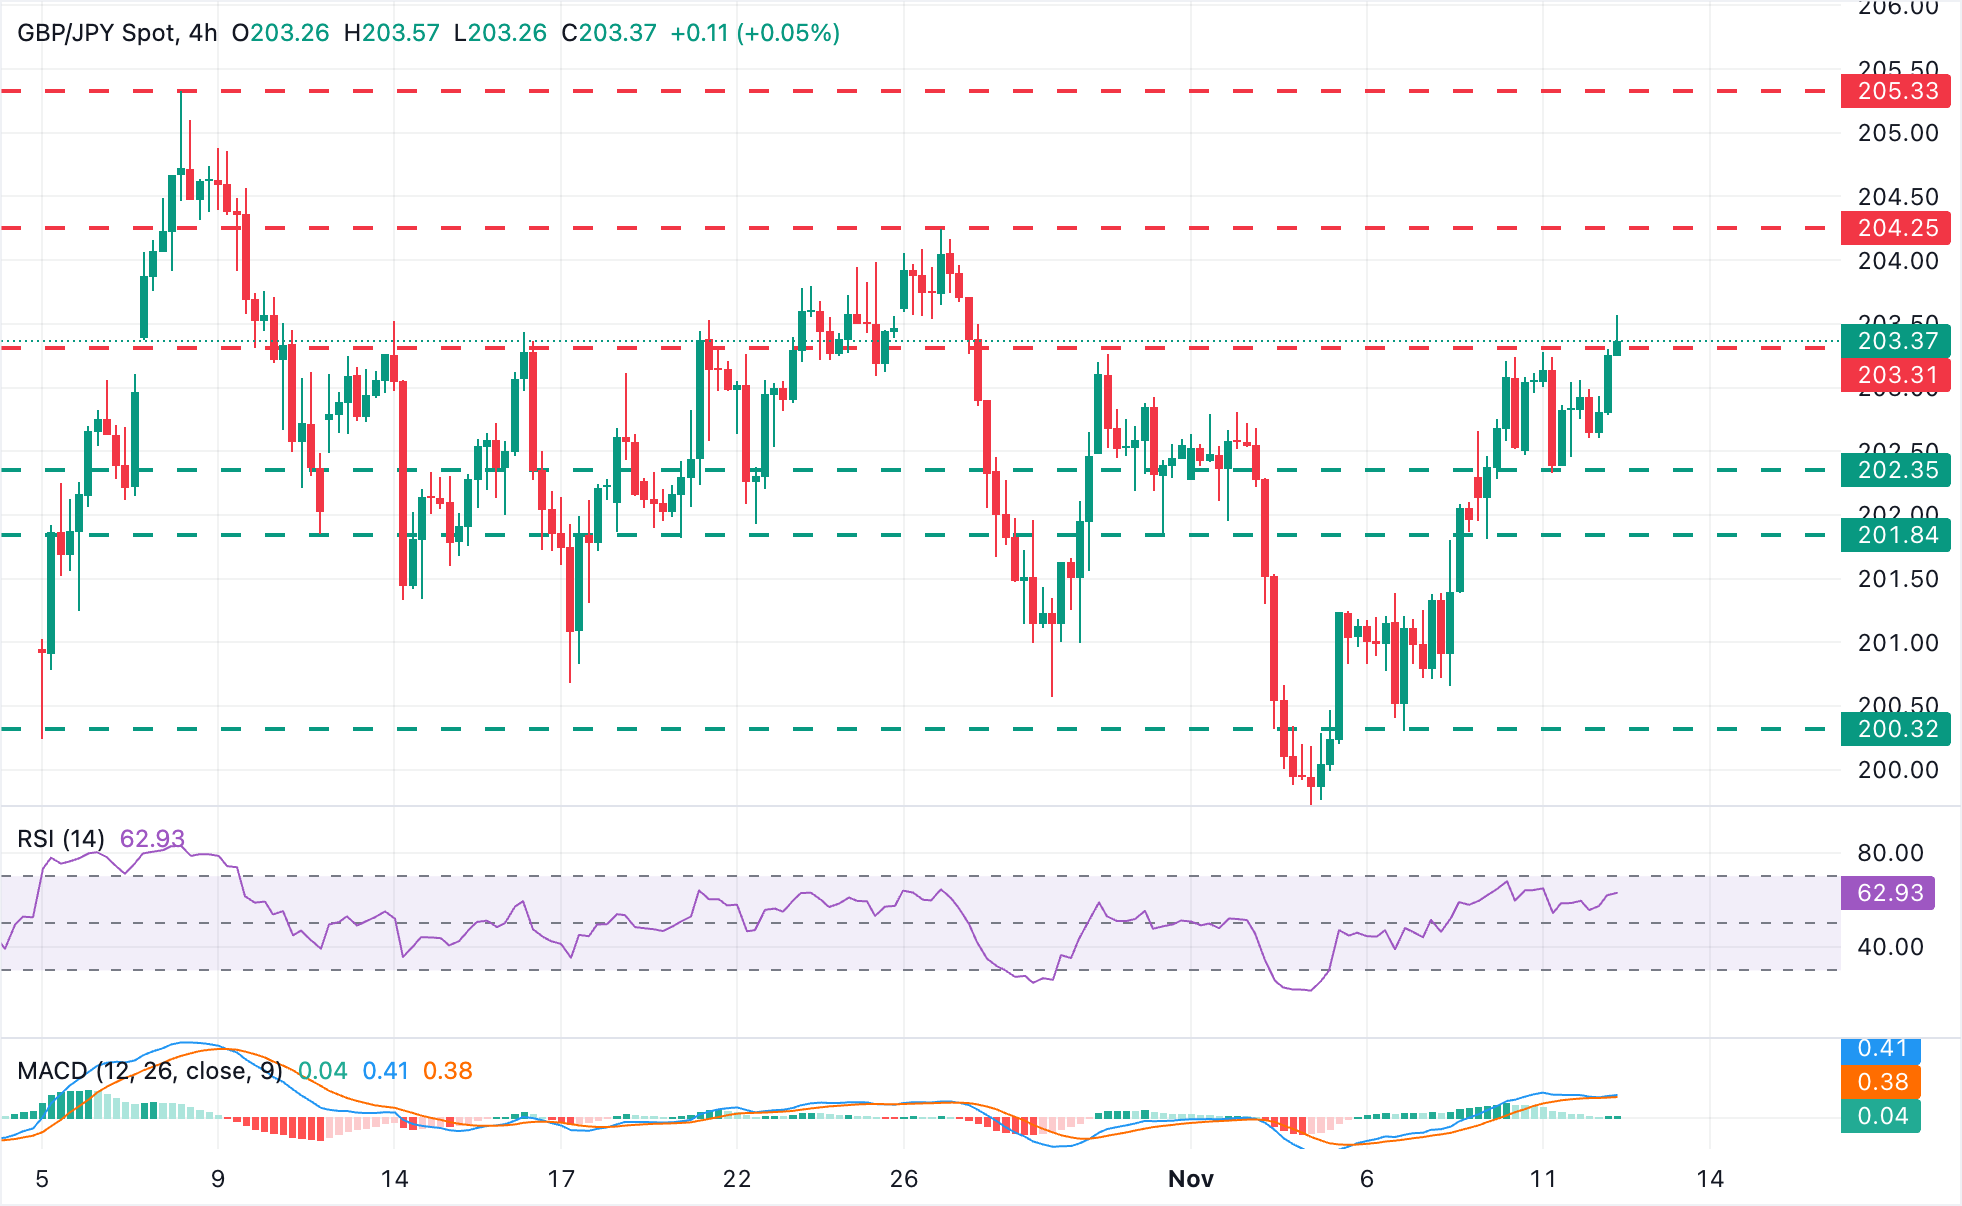
GBP/JPY Price Forecast: Pound pierces 203.30 resistance amid Yen weakness
- The Pound rallies to fresh two-week lows past 203.30, favoured by generalized JPY weakness.
- News of a loser fiscal budget in Japan has sent the Yen lower across the board on Wednesday.
- Technically, the GBP/JPY remains on a bullish trend, with 204.25 on the bull's focus.
The Pound has shrugged off the negative pressure from the weak UK employment data seen on Tuesday and bounced up from levels below 202.5, to break the 203.30 resistance area, hitting session highs above 203.50 for the first time since late October.
The Sterling is drawing support from broad-based Yen weakness, following Japanese Prime Minister Sanae Takaichi's announcement that she is working on a fiscal consolidation target, which would allow for higher government spending. Before that, the Prime Minister urged the BoJ to keep interest rates at low levels, casting further doubts on a December interest rate hike.
GBP/JPY's technical indicators are mixed

The technical picture is mixed. The Relative Strength Index (RSI) in 4-hour charts is at high levels but still below overbought territory, and fundamentals are supportive. The Moving Average Convergence Divergence, however, is showing an impending cross below the signal line, suggesting that the trend might have run out of steam.
If price action consolidates at these levels, it could give bulls confidence to attempt a retest of the October 27 high at 204.25. Beyond that, the next target would be the October 8 high, at 205.33.
To the downside, a reversal below the mentioned 203.30 level might find support at Tuesday’s low of 202.35. Further down, the November 10 low, near 201.80, might test bearish momentum before the November 6 and 7 lows in the area between 200.30 and 200.60.
Japanese Yen Price Today
The table below shows the percentage change of Japanese Yen (JPY) against listed major currencies today. Japanese Yen was the strongest against the British Pound.
| USD | EUR | GBP | JPY | CAD | AUD | NZD | CHF | |
|---|---|---|---|---|---|---|---|---|
| USD | -0.03% | 0.07% | 0.34% | -0.04% | -0.16% | 0.00% | -0.19% | |
| EUR | 0.03% | 0.10% | 0.39% | -0.01% | -0.13% | 0.03% | -0.16% | |
| GBP | -0.07% | -0.10% | 0.28% | -0.12% | -0.23% | -0.06% | -0.26% | |
| JPY | -0.34% | -0.39% | -0.28% | -0.41% | -0.53% | -0.37% | -0.56% | |
| CAD | 0.04% | 0.01% | 0.12% | 0.41% | -0.12% | 0.04% | -0.15% | |
| AUD | 0.16% | 0.13% | 0.23% | 0.53% | 0.12% | 0.16% | -0.03% | |
| NZD | -0.01% | -0.03% | 0.06% | 0.37% | -0.04% | -0.16% | -0.19% | |
| CHF | 0.19% | 0.16% | 0.26% | 0.56% | 0.15% | 0.03% | 0.19% |
The heat map shows percentage changes of major currencies against each other. The base currency is picked from the left column, while the quote currency is picked from the top row. For example, if you pick the Japanese Yen from the left column and move along the horizontal line to the US Dollar, the percentage change displayed in the box will represent JPY (base)/USD (quote).

